Evergreen Lawn neighborhood in Baltimore, Maryland (MD), 21216 detailed profile
Settings
X

Business Search - 14 Million verified businesses
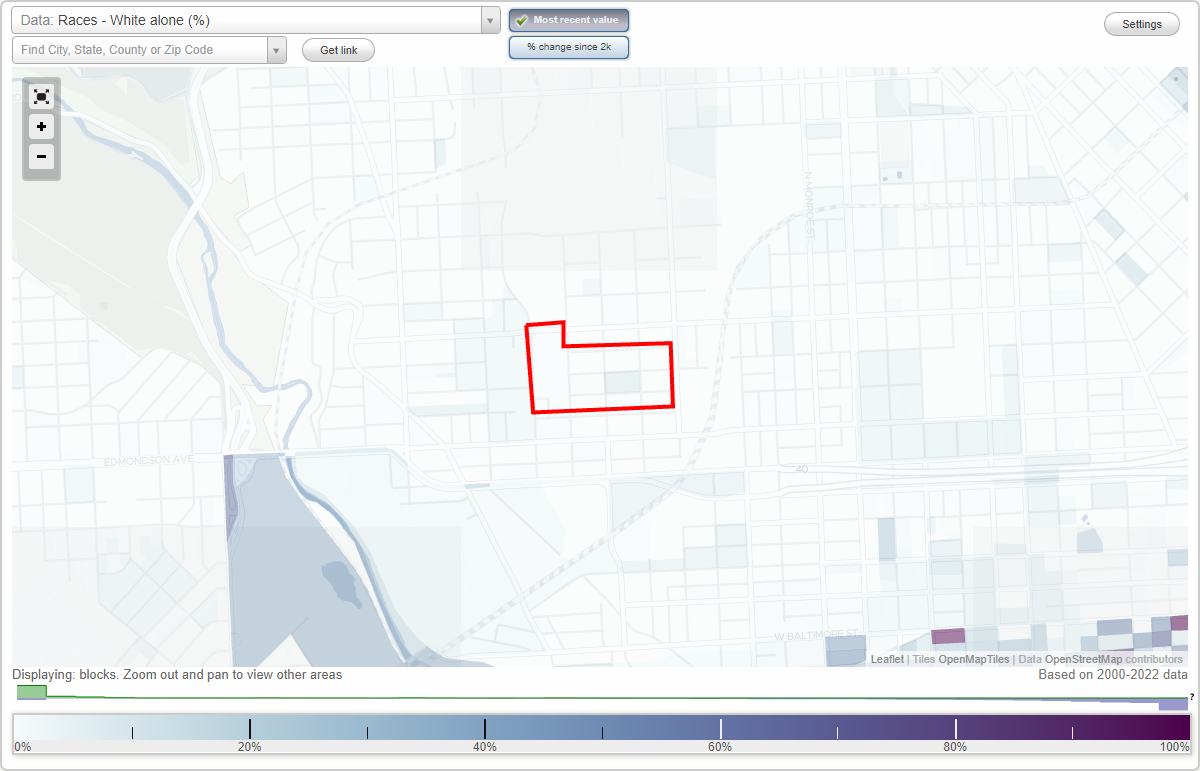
Area: 0.052 square miles
Population: 538
Population density:
| Evergreen Lawn: | 10,284 people per square mile |
| Baltimore: | 7,053 people per square mile |

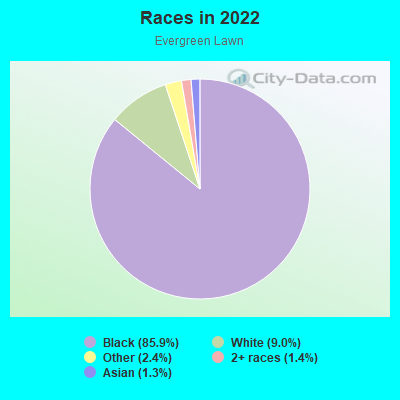
- 53585.9%Black
- 569.0%White
- 152.4%Some other race
- 91.4%Two or more races
- 81.3%Asian
Distribution of median household income
![Distribution of median household income]()
- 31Less than $10,000
- 48$10,000 to $19,999
- 59$20,000 to $29,999
- 109$30,000 to $39,999
- 46$40,000 to $49,999
- 18$50,000 to $59,999
- 33$60,000 to $74,999
- 24$75,000 to $99,999
- 72$100,000 to $124,999
- 41$125,000 to $149,999
- 37$150,000 to $199,999
- 2$200,000 or more

Distribution of owner-occupied house/condo value
![Distribution of owner-occupied house/condo value]()
- 131Less than $50,000
- 163$50,000 to $99,999
- 38$100,000 to $149,999
- 19$200,000 to $249,999
- 3$300,000 to $399,999
- 17$400,000 to $499,999
- 2$750,000 to $999,999

Distribution of rent paid by renters
![Distribution of rent paid by renters]()
- 7Less than $100
- 66$200 to $299
- 33$300 to $399
- 14$400 to $499
- 6$500 to $599
- 53$600 to $699
- 25$700 to $799
- 37$800 to $899
- 20$900 to $999
- 68$1,000 to $1,249
- 72$1,250 to $1,499

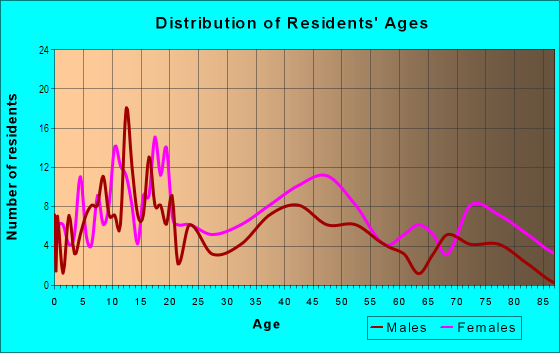
| Males: | 296 |
| Females: | 241 |
Males:
| This neighborhood: | 46.5 years |
| Whole city: | 35.0 years |
| This neighborhood: | 45.6 years |
| Whole city: | 38.2 years |
Average household size:
| Evergreen Lawn: | 2.0 people |
| Baltimore: | 2.2 people |
Percentage of family households:
| Evergreen Lawn: | 46.6% |
| Baltimore: | 34.2% |
| Here: | 36.4% |
| Baltimore: | 23.3% |
Percentage of married-couple families with children (among all households):
| Evergreen Lawn: | 4.2% |
| Baltimore: | 22.4% |
Percentage of single-mother households (among all households):
| Evergreen Lawn: | 42.5% |
| Baltimore: | 18.7% |
Percentage of never married males 15 years old and over:
Percentage of never married females 15 years old and over:
| Evergreen Lawn: | 26.5% |
| Baltimore: | 25.1% |
Percentage of never married females 15 years old and over:
| Evergreen Lawn: | 17.2% |
| city: | 27.5% |
Percentage of people that speak English not well or not at all:
| Evergreen Lawn: | 0.0% |
| Baltimore: | 2.3% |
Percentage of people born in this state:
Percentage of people born in another U.S. state:
Percentage of native residents but born outside the U.S.:
Percentage of foreign born residents:
| Here: | 88.7% |
| Baltimore: | 64.4% |
Percentage of people born in another U.S. state:
| Evergreen Lawn: | 6.3% |
| Baltimore: | 25.0% |
Percentage of native residents but born outside the U.S.:
| Here: | 1.6% |
| city: | 0.9% |
Percentage of foreign born residents:
| Here: | 3.5% |
| Baltimore: | 9.7% |
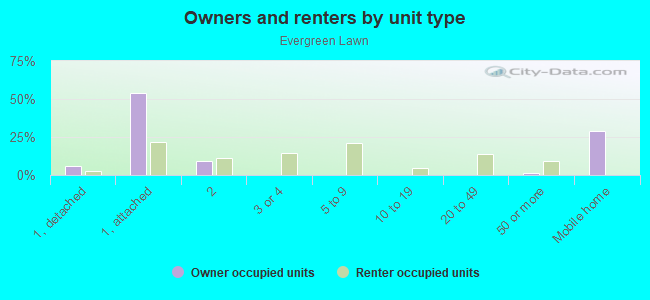
Owner-occupied
Renter-occupied

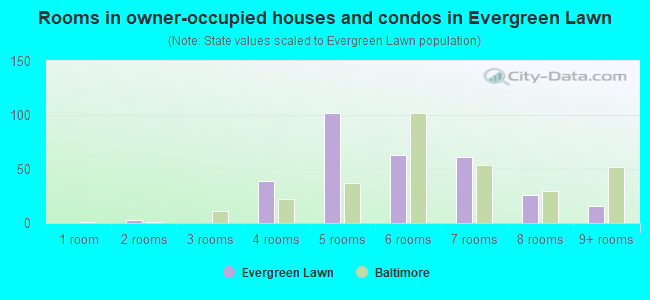
- Rooms in owner-occupied houses and condos in Evergreen Lawn
- 01 room
- 32 rooms
- 03 rooms
- 394 rooms
- 1025 rooms
- 636 rooms
- 617 rooms
- 268 rooms
- 169+ rooms
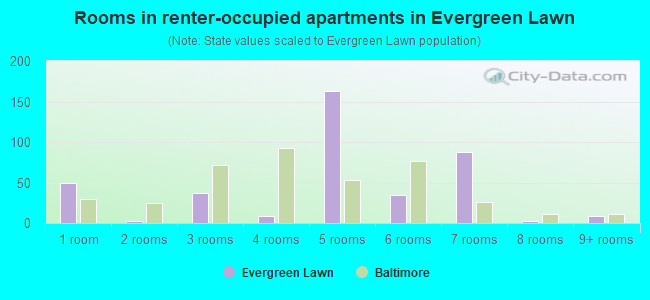
- Rooms in renter-occupied apartments in Evergreen Lawn
- 501 room
- 32 rooms
- 373 rooms
- 94 rooms
- 1635 rooms
- 346 rooms
- 887 rooms
- 28 rooms
- 99+ rooms
Owner-occupied
Renter-occupied
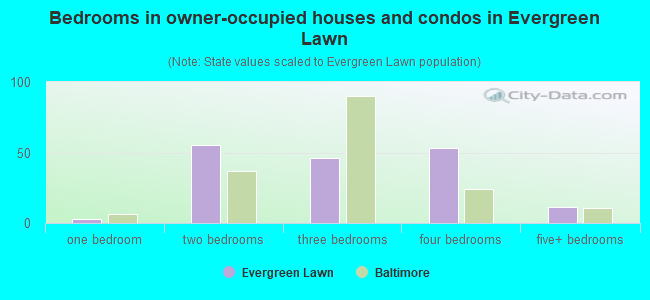
- Bedrooms in owner-occupied houses and condos in Evergreen Lawn
- 0no bedroom
- 31 bedroom
- 552 bedrooms
- 463 bedrooms
- 534 bedrooms
- 115+ bedrooms
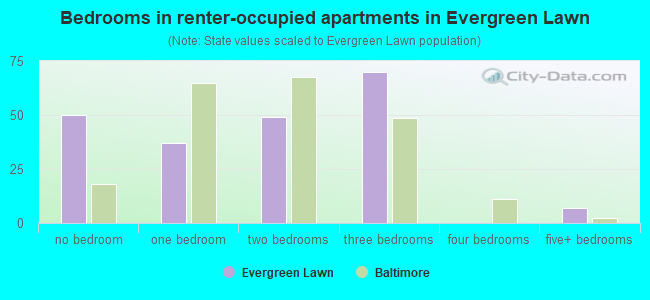
- Bedrooms in renter-occupied apartments in Evergreen Lawn
- 50no bedroom
- 371 bedroom
- 492 bedrooms
- 703 bedrooms
- 04 bedrooms
- 75+ bedrooms
Average number of cars or other vehicles available in houses/condos:
Average number of cars or other vehicles available in apartments:
| This neighborhood: | 1.5 |
| Baltimore: | 1.5 |
Average number of cars or other vehicles available in apartments:
| Here: | 0.5 |
| city: | 0.8 |
Percentage of units with a mortgage:
| Evergreen Lawn: | 65.5% |
| Baltimore: | 64.3% |
Average estimated value of townhouses or other attached units in 2022 (81.7% of all units):
| This neighborhood: | $101,790 |
| city: | $206,258 |
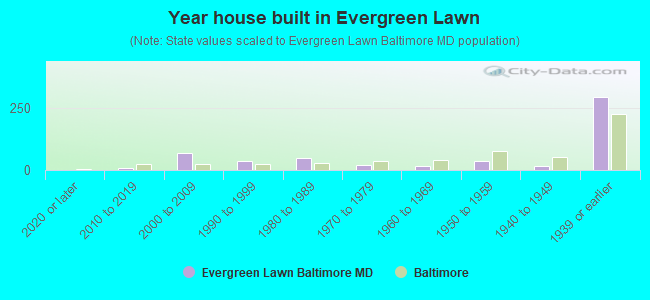
- Year house built in Evergreen Lawn
- 02020 or later
- 72010 to 2019
- 692000 to 2009
- 361990 to 1999
- 481980 to 1989
- 221970 to 1979
- 161960 to 1969
- 351950 to 1959
- 151940 to 1949
- 2921939 or earlier
Travel time to work (commute)
![Travel time to work (commute)]()
- 310 to 14 minutes
- 2615 to 19 minutes
- 2320 to 24 minutes
- 125 to 29 minutes
- 5930 to 34 minutes
- 4135 to 39 minutes
- 1840 to 44 minutes
- 9045 to 59 minutes
- 2560 to 89 minutes
- 2990 or more minutes

Means of transportation to work
![Means of transportation to work]()
- 64.8%161Drove a car alone
- 6.8%17Carpooled
- 41.0%102Bus
- 0.4%1Long-distance train or commuter rail
- 4.4%11Light rail, streetcar or trolley
- 3.6%9Taxi
- 0.4%1Walked
- 2.0%5Other means
- 45.9%114Worked at home

Time leaving home to go to work
![Time leaving home to go to work]()
- 712:00 a.m. to 4:59 a.m.
- 185:00 a.m. to 5:29 a.m.
- 125:30 a.m. to 5:59 a.m.
- 66:00 a.m. to 6:29 a.m.
- 126:30 a.m. to 6:59 a.m.
- 127:00 a.m. to 7:29 a.m.
- 277:30 a.m. to 7:59 a.m.
- 258:00 a.m. to 8:29 a.m.
- 178:30 a.m. to 8:59 a.m.
- 59:00 a.m. to 9:59 a.m.
- 211:00 a.m. to 11:59 a.m.
- 5912:00 p.m. to 3:59 p.m.
- 114:00 p.m. to 11:59 p.m.

Occupations of males:
- Percentage of males in management occupations (except farmers):
Here: 1.1% city: 10.7%
- Percentage of males in community and social services occupations:
Here: 2.3% city: 1.6%
- Percentage of males in service occupations:
Here: 1.8% city: 14.7%
- Percentage of males in sales and office occupations:
Here: 18.4% city: 14.2%
- Percentage of males in construction, extraction, and maintenance occupations:
Here: 47.2% city: 5.6%
- Percentage of males in transportation occupations:
Here: 4.5% city: 6.8%
Occupations of females:
- Percentage of females in management occupations (except farmers):
Here: 40.7% city: 10.1%
- Percentage of females in business and financial operations occupations:
Here: 19.7% city: 6.6%
- Percentage of females in computer and mathematical occupations:
Here: 2.9% city: 2.4%
- Percentage of females in education, training, and library occupations:
Here: 5.0% city: 10.7%
- Percentage of females in healthcare practitioners and technical occupations:
Here: 2.3% city: 9.8%
- Percentage of females in service occupations:
Here: 24.8% city: 20.4%
- Percentage of females in sales and office occupations:
Here: 6.4% city: 22.3%
- Percentage of females in production occupations:
Here: 3.3% city: 2.3%
- Percentage of females in transportation occupations:
Here: 1.7% city: 1.7%
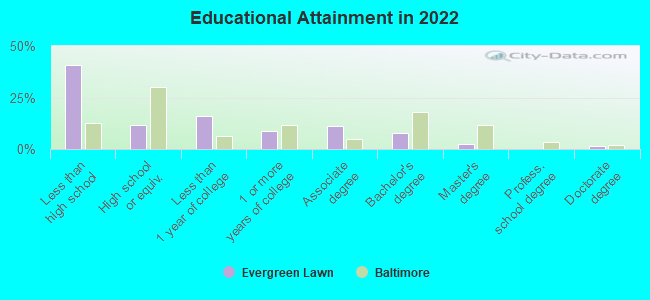
Education in this neighborhood (subdivision or community):
- Percentage of people 3 years and older in K-12 schools:
Evergreen Lawn: 41.5% Baltimore: 14.7%
- Percentage of people 3 years and older in undergraduate colleges:
Evergreen Lawn: 11.6% Baltimore: 6.0%
- Percentage of people 3 years and older in grad. or professional schools:
Evergreen Lawn: 0.0% Baltimore: 2.8%
- Percentage of students K-12 enrolled in private schools:
Evergreen Lawn: 3.2% Baltimore: 12.7%
Percentage of population below poverty level:
| Evergreen Lawn: | 29.4% |
| Baltimore: | 18.5% |
Median year owner moved in (as recorded in 2022):
| Evergreen Lawn: | 2000 |
| Baltimore: | 2009 |
Percentage of married-couple families with both working:
| Evergreen Lawn: | 540.7% |
| Baltimore: | 79.2% |
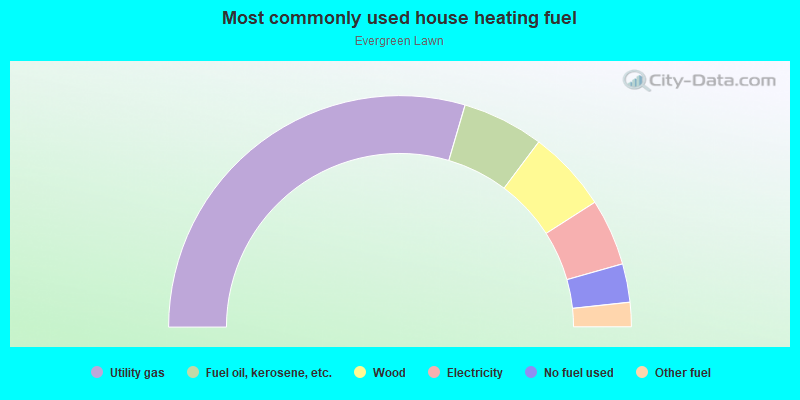
- 59.1%Utility gas
- 11.4%Fuel oil, kerosene, etc.
- 11.4%Wood
- 9.3%Electricity
- 5.4%No fuel used
- 3.4%Other fuel
Roads and streets:
Calverton Heights Ave
Length: 0.21 miles
Direction: E-W
Address range: 2400 to 2599
Direction: E-W
Address range: 2400 to 2599
W Lanvale St
Length: 0.21 miles
Direction: E-W
Address range: 2400 to 2599
Direction: E-W
Address range: 2400 to 2599
Harlem Ave
Length: 0.21 miles
Direction: E-W
Address range: 2400 to 2549
Direction: E-W
Address range: 2400 to 2549
N Warwick Ave
Length: 0.10 miles
Direction: N-S
Address range: 723 to 829
Direction: N-S
Address range: 723 to 829
Wheeler Ave
Length: 0.10 miles
Direction: N-S
Address range: 714 to 819
Direction: N-S
Address range: 714 to 819
Whitmore Ave
Length: 0.10 miles
Direction: N-S
Address range: 736 to 849
Direction: N-S
Address range: 736 to 849
Wilbron Ave
Length: 0.02 miles
Direction: N-S
Direction: N-S