Estate La Colina neighborhood in Tempe, Arizona (AZ), 85284 detailed profile
Settings
X


Business Search - 14 Million verified businesses
Area: 0.236 square miles
Population: 579
Population density:
| Estate La Colina: | 2,449 people per square mile |
| Tempe: | 4,641 people per square mile |

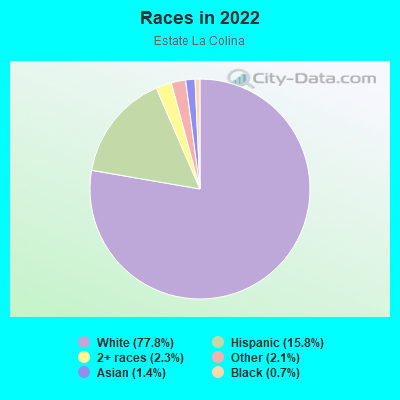
- 44877.8%White
- 9115.8%Hispanic or Latino
- 132.3%Two or more races
- 122.1%Some other race
- 81.4%Asian
- 40.7%Black
Median household income in 2022:
| Estate La Colina: | $140,896 |
| Tempe: | $76,007 |
Distribution of median household income
![Distribution of median household income]()
- 9Less than $10,000
- 2$10,000 to $19,999
- 4$20,000 to $29,999
- 12$30,000 to $39,999
- 7$40,000 to $49,999
- 10$50,000 to $59,999
- 6$60,000 to $74,999
- 30$75,000 to $99,999
- 31$100,000 to $124,999
- 38$125,000 to $149,999
- 39$150,000 to $199,999
- 64$200,000 or more

Distribution of owner-occupied house/condo value
![Distribution of owner-occupied house/condo value]()
- 3Less than $50,000
- 2$50,000 to $99,999
- 5$200,000 to $249,999
- 11$250,000 to $299,999
- 26$300,000 to $399,999
- 63$400,000 to $499,999
- 109$500,000 to $749,999
- 13$750,000 to $999,999

Distribution of rent paid by renters
![Distribution of rent paid by renters]()
- 2$900 to $999
- 2$1,000 to $1,249
- 2$1,250 to $1,499
- 8$1,500 to $1,999
- 5$2,000 or more

Median rent in 2022:
| Estate La Colina: | $1,742 |
| Tempe: | $1,566 |
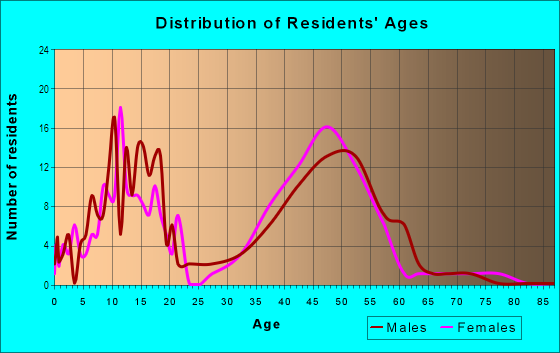
| Males: | 279 |
| Females: | 300 |
Males:
| This neighborhood: | 53.4 years |
| Whole city: | 28.9 years |
| This neighborhood: | 48.7 years |
| Whole city: | 30.5 years |
Average household size:
| Estate La Colina: | 2.3 people |
| Tempe: | 2.3 people |
Percentage of family households:
| Estate La Colina: | 46.0% |
| Tempe: | 36.3% |
| Here: | 61.0% |
| Tempe: | 32.6% |
Percentage of married-couple families with children (among all households):
| Estate La Colina: | 34.6% |
| Tempe: | 26.9% |
Percentage of single-mother households (among all households):
| Estate La Colina: | 6.2% |
| Tempe: | 8.3% |
Percentage of never married males 15 years old and over:
Percentage of never married females 15 years old and over:
| Estate La Colina: | 13.8% |
| Tempe: | 32.9% |
Percentage of never married females 15 years old and over:
| Estate La Colina: | 12.3% |
| city: | 21.7% |
Percentage of people that speak English not well or not at all:
| Estate La Colina: | 0.7% |
| Tempe: | 2.0% |
Percentage of people born in this state:
Percentage of people born in another U.S. state:
Percentage of native residents but born outside the U.S.:
Percentage of foreign born residents:
| Here: | 33.0% |
| Tempe: | 39.3% |
Percentage of people born in another U.S. state:
| Estate La Colina: | 57.0% |
| Tempe: | 46.0% |
Percentage of native residents but born outside the U.S.:
| Here: | 3.8% |
| city: | 1.8% |
Percentage of foreign born residents:
| Here: | 6.2% |
| Tempe: | 12.9% |
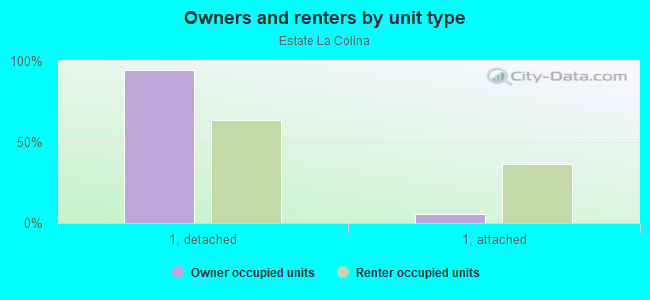
Owner-occupied
Renter-occupied

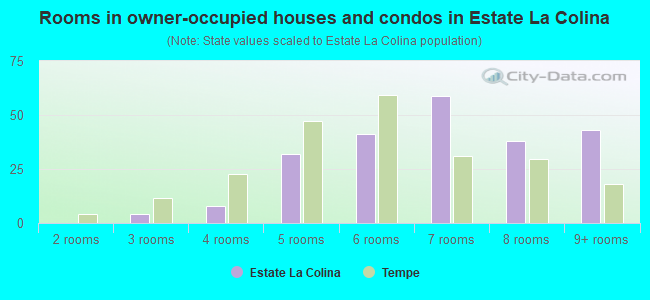
- Rooms in owner-occupied houses and condos in Estate La Colina
- 01 room
- 02 rooms
- 43 rooms
- 84 rooms
- 325 rooms
- 416 rooms
- 597 rooms
- 388 rooms
- 439+ rooms
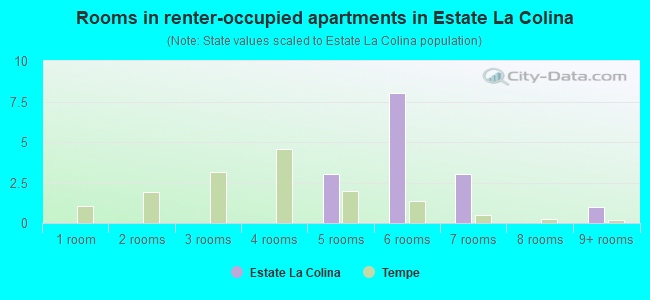
- Rooms in renter-occupied apartments in Estate La Colina
- 01 room
- 02 rooms
- 03 rooms
- 04 rooms
- 35 rooms
- 86 rooms
- 37 rooms
- 08 rooms
- 19+ rooms
Owner-occupied
Renter-occupied
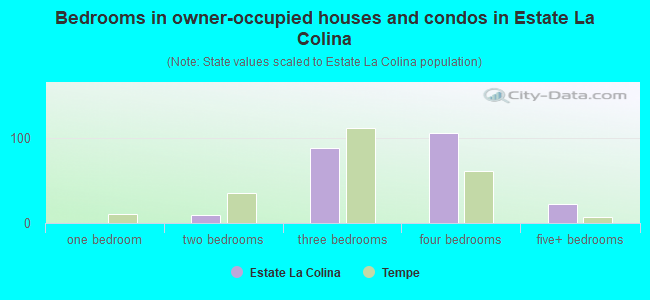
- Bedrooms in owner-occupied houses and condos in Estate La Colina
- 0no bedroom
- 01 bedroom
- 92 bedrooms
- 893 bedrooms
- 1064 bedrooms
- 235+ bedrooms
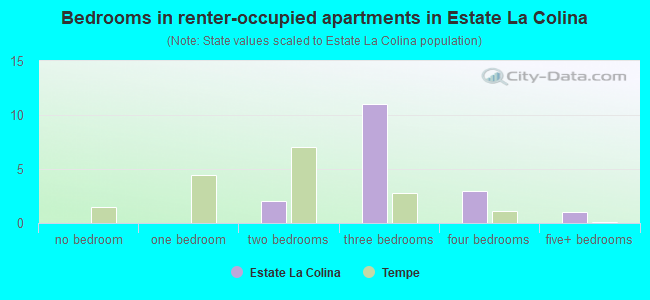
- Bedrooms in renter-occupied apartments in Estate La Colina
- 0no bedroom
- 01 bedroom
- 22 bedrooms
- 113 bedrooms
- 34 bedrooms
- 15+ bedrooms
Average number of cars or other vehicles available in houses/condos:
Average number of cars or other vehicles available in apartments:
| This neighborhood: | 2.2 |
| Tempe: | 2.0 |
Average number of cars or other vehicles available in apartments:
| Here: | 1.7 |
| city: | 1.6 |
Percentage of units with a mortgage:
| Estate La Colina: | 63.9% |
| Tempe: | 69.2% |
Housing prices:
- Average estimated value of detached houses in 2022 (89.7% of all units):
Estate La Colina: $511,654 Tempe: $535,475
- Average estimated value of townhouses or other attached units in 2022 (8.7% of all units):
This neighborhood: $283,151 city: $325,212
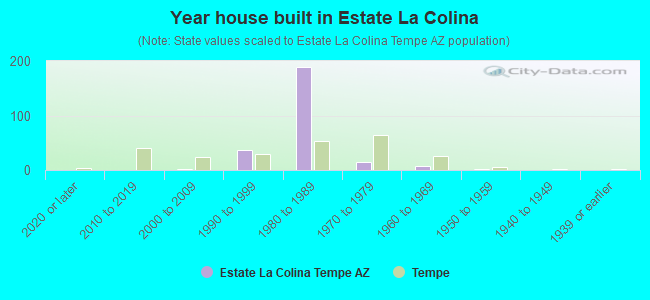
- Year house built in Estate La Colina
- 02020 or later
- 02010 to 2019
- 12000 to 2009
- 361990 to 1999
- 1891980 to 1989
- 151970 to 1979
- 81960 to 1969
- 11950 to 1959
- 01940 to 1949
- 01939 or earlier
City-data.com crime index for city in 2020 (higher means more crime):
| City: | 347.1 |
| U.S. average: | 219.5 |
Travel time to work (commute)
![Travel time to work (commute)]()
- 2Less than 5 minutes
- 145 to 9 minutes
- 2710 to 14 minutes
- 5215 to 19 minutes
- 7120 to 24 minutes
- 1925 to 29 minutes
- 3730 to 34 minutes
- 635 to 39 minutes
- 840 to 44 minutes
- 2245 to 59 minutes
- 660 to 89 minutes
- 190 or more minutes

Means of transportation to work
![Means of transportation to work]()
- 69.8%249Drove a car alone
- 4.5%16Carpooled
- 0.3%1Subway or elevated rail
- 0.8%3Other means
- 23.8%85Worked at home

Time leaving home to go to work
![Time leaving home to go to work]()
- 112:00 a.m. to 4:59 a.m.
- 125:00 a.m. to 5:29 a.m.
- 175:30 a.m. to 5:59 a.m.
- 216:00 a.m. to 6:29 a.m.
- 206:30 a.m. to 6:59 a.m.
- 377:00 a.m. to 7:29 a.m.
- 407:30 a.m. to 7:59 a.m.
- 378:00 a.m. to 8:29 a.m.
- 48:30 a.m. to 8:59 a.m.
- 279:00 a.m. to 9:59 a.m.
- 1210:00 a.m. to 10:59 a.m.
- 1411:00 a.m. to 11:59 a.m.
- 1212:00 p.m. to 3:59 p.m.
- 114:00 p.m. to 11:59 p.m.

Occupations of males:
- Percentage of males in management occupations (except farmers):
Here: 14.0% city: 10.2%
- Percentage of males in business and financial operations occupations:
Here: 10.8% city: 6.5%
- Percentage of males in computer and mathematical occupations:
Here: 15.6% city: 8.4%
- Percentage of males in architecture and engineering occupations:
Here: 5.5% city: 5.0%
- Percentage of males in community and social services occupations:
Here: 1.5% city: 1.1%
- Percentage of males in legal occupations:
Here: 1.5% city: 1.1%
- Percentage of males in education, training, and library occupations:
Here: 7.3% city: 6.1%
- Percentage of males in arts, design, entertainment, sports, and media occupations:
Here: 1.5% city: 2.8%
- Percentage of males in healthcare practitioners and technical occupations:
Here: 2.9% city: 2.8%
- Percentage of males in service occupations:
Here: 11.2% city: 14.4%
- Percentage of males in sales and office occupations:
Here: 16.7% city: 19.0%
- Percentage of males in construction, extraction, and maintenance occupations:
Here: 4.2% city: 5.1%
- Percentage of males in transportation occupations:
Here: 1.0% city: 3.9%
- Percentage of males in material moving occupations:
Here: 1.8% city: 3.5%
Occupations of females:
- Percentage of females in management occupations (except farmers):
Here: 16.8% city: 7.5%
- Percentage of females in business and financial operations occupations:
Here: 8.1% city: 9.3%
- Percentage of females in computer and mathematical occupations:
Here: 1.8% city: 3.3%
- Percentage of females in architecture and engineering occupations:
Here: 1.7% city: 0.9%
- Percentage of females in community and social services occupations:
Here: 1.2% city: 3.4%
- Percentage of females in legal occupations:
Here: 3.8% city: 1.4%
- Percentage of females in education, training, and library occupations:
Here: 14.8% city: 12.0%
- Percentage of females in arts, design, entertainment, sports, and media occupations:
Here: 3.5% city: 3.1%
- Percentage of females in healthcare practitioners and technical occupations:
Here: 10.2% city: 7.4%
- Percentage of females in service occupations:
Here: 7.9% city: 18.9%
- Percentage of females in sales and office occupations:
Here: 22.8% city: 26.9%
- Percentage of females in farming, fishing, and forestry occupations:
Here: 3.5% city: 0.2%
- Percentage of females in transportation occupations:
Here: 3.1% city: 0.9%
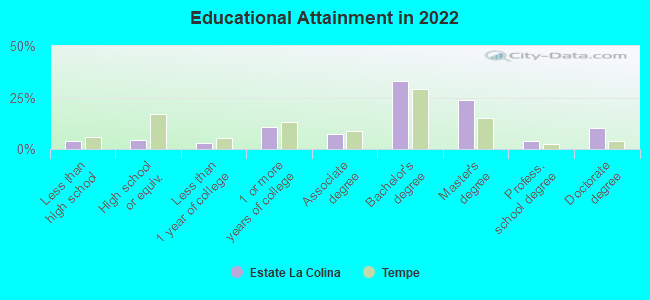
Education in this neighborhood (subdivision or community):
- Percentage of people 3 years and older in K-12 schools:
Estate La Colina: 13.7% Tempe: 12.5%
- Percentage of people 3 years and older in undergraduate colleges:
Estate La Colina: 4.2% Tempe: 15.4%
- Percentage of people 3 years and older in grad. or professional schools:
Estate La Colina: 1.2% Tempe: 6.3%
- Percentage of students K-12 enrolled in private schools:
Estate La Colina: 3.8% Tempe: 9.2%
Percentage of population below poverty level:
| Estate La Colina: | 2.7% |
| Tempe: | 15.0% |
Median year owner moved in (as recorded in 2022):
Median year renter moved in (as recorded in 2022):
| Estate La Colina: | 2007 |
| Tempe: | 2013 |
Median year renter moved in (as recorded in 2022):
| Estate La Colina: | 2018 |
| Tempe: | 2022 |
Percentage of married-couple families with both working:
| Estate La Colina: | 89.8% |
| Tempe: | 77.6% |
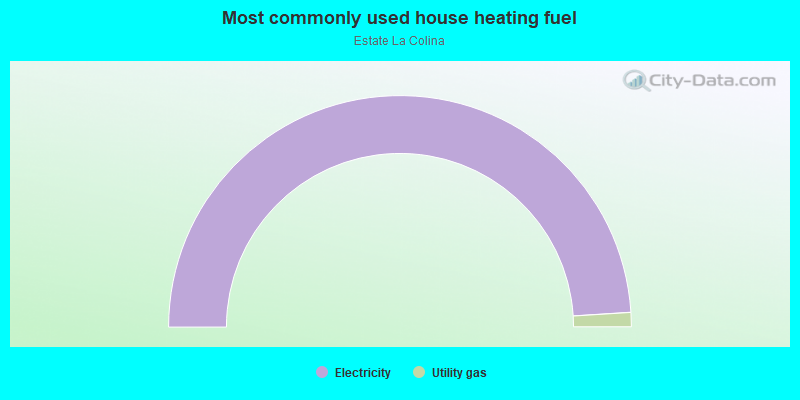
- 98.0%Electricity
- 2.0%Utility gas
Roads and streets:
E Cll de Caballos
Length: 0.53 miles
Directions: E-W, N-S, SE-NW, SW-NE
Address range: 1805 to 1999
Directions: E-W, N-S, SE-NW, SW-NE
Address range: 1805 to 1999
E Palomino Dr
Length: 0.53 miles
Directions: E-W, SE-NW, SW-NE
Address range: 1806 to 1999
Directions: E-W, SE-NW, SW-NE
Address range: 1806 to 1999
E Carver Rd
Length: 0.51 miles
Direction: E-W
Address range: 1800 to 1999
Direction: E-W
Address range: 1800 to 1999
E el Freda Rd
Length: 0.42 miles
Directions: E-W, SW-NE
Address range: 1800 to 1999
Directions: E-W, SW-NE
Address range: 1800 to 1999
S Kenwood Ln
Length: 0.39 miles
Directions: N-S, SE-NW, SW-NE
Address range: 8400 to 8799
Directions: N-S, SE-NW, SW-NE
Address range: 8400 to 8799
S Los Feliz Dr
Length: 0.37 miles
Directions: N-S, SW-NE
Address range: 8114 to 8799
Directions: N-S, SW-NE
Address range: 8114 to 8799
E Buena Vista Dr
Length: 0.36 miles
Direction: E-W
Address range: 1800 to 1999
Direction: E-W
Address range: 1800 to 1999
S Kachina Dr
Length: 0.32 miles
Directions: N-S, SE-NW
Address range: 8200 to 8699
Directions: N-S, SE-NW
Address range: 8200 to 8699
S Taylor Dr
Length: 0.29 miles
Directions: N-S, SW-NE
Address range: 8200 to 8699
Directions: N-S, SW-NE
Address range: 8200 to 8699
E Warner Rd
Length: 0.23 miles
Direction: E-W
Address range: 1921 to 1999
Direction: E-W
Address range: 1921 to 1999
E Colt Rd
Length: 0.22 miles
Directions: E-W, SE-NW
Address range: 1800 to 1999
Directions: E-W, SE-NW
Address range: 1800 to 1999
E Calle Monte Vista Dr
Length: 0.17 miles
Directions: E-W, SE-NW
Address range: 1958 to 1978
Directions: E-W, SE-NW
Address range: 1958 to 1978
E Los Arboles Dr
Length: 0.17 miles
Direction: E-W
Address range: 1900 to 1999
Direction: E-W
Address range: 1900 to 1999
S Hazelton Ln
Length: 0.15 miles
Directions: N-S, SE-NW, SW-NE
Address range: 8200 to 8499
Directions: N-S, SE-NW, SW-NE
Address range: 8200 to 8499
E Morgan Dr
Length: 0.15 miles
Direction: E-W
Address range: 1900 to 1999
Direction: E-W
Address range: 1900 to 1999
Buena Vis
Length: 0.10 miles
Direction: E-W
Address range: 1800 to 4842
Direction: E-W
Address range: 1800 to 4842
S Holbrook Ln
Length: 0.08 miles
Directions: N-S, SW-NE
Address range: 8600 to 8699
Directions: N-S, SW-NE
Address range: 8600 to 8699
S Palomino Dr
Length: 0.03 miles
Directions: E-W, SW-NE
Address range: 8600 to 8649
Directions: E-W, SW-NE
Address range: 8600 to 8649
S Hazelton Dr
Length: 0.03 miles
Direction: N-S
Address range: 8600 to 8699
Direction: N-S
Address range: 8600 to 8699