Emerson East neighborhood in Madison, Wisconsin (WI), 53704 detailed profile
Settings
X

Business Search - 14 Million verified businesses
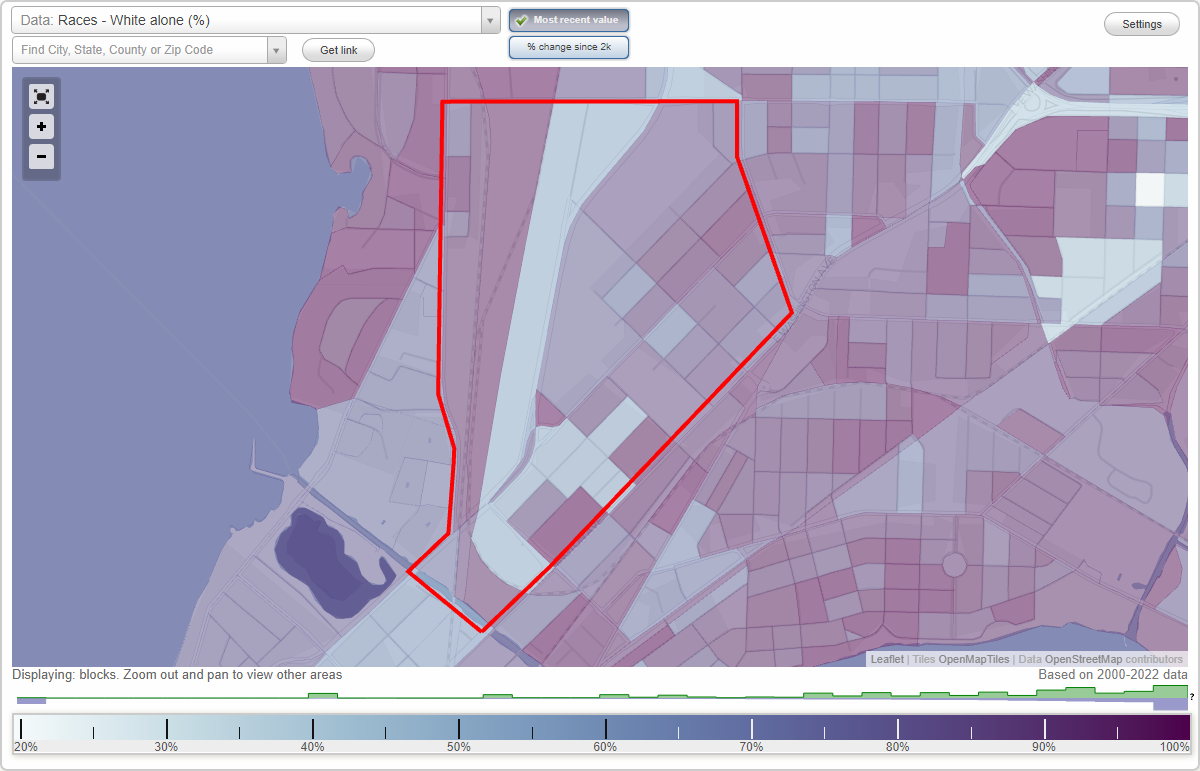
Area: 0.606 square miles
Population: 2,187
Population density:
| Emerson East: | 3,607 people per square mile |
| Madison: | 3,974 people per square mile |

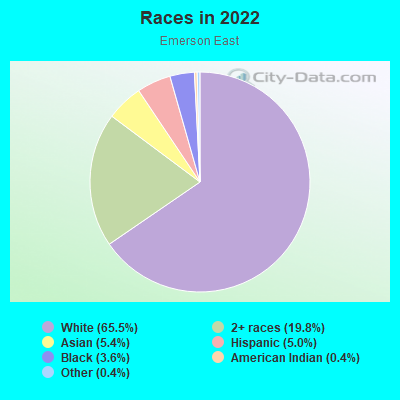
- 1,43865.5%White
- 43419.8%Two or more races
- 1185.4%Asian
- 1095.0%Hispanic or Latino
- 803.6%Black
- 80.4%American Indian
- 80.4%Some other race
Median household income in 2022:
| Emerson East: | $114,448 |
| Madison: | $73,647 |
Distribution of median household income
![Distribution of median household income]()
- 3Less than $10,000
- 106$10,000 to $19,999
- 62$20,000 to $29,999
- 141$30,000 to $39,999
- 108$40,000 to $49,999
- 63$50,000 to $59,999
- 75$60,000 to $74,999
- 103$75,000 to $99,999
- 154$100,000 to $124,999
- 65$125,000 to $149,999
- 96$150,000 to $199,999
- 64$200,000 or more

Distribution of owner-occupied house/condo value
![Distribution of owner-occupied house/condo value]()
- 4Less than $50,000
- 2$50,000 to $99,999
- 60$100,000 to $149,999
- 80$150,000 to $199,999
- 137$200,000 to $249,999
- 83$250,000 to $299,999
- 179$300,000 to $399,999
- 44$400,000 to $499,999
- 119$500,000 to $749,999
- 89$750,000 to $999,999
- 100$1,000,000 or more

Distribution of rent paid by renters
![Distribution of rent paid by renters]()
- 2$100 to $199
- 61$200 to $299
- 8$400 to $499
- 74$600 to $699
- 135$700 to $799
- 77$800 to $899
- 17$900 to $999
- 37$1,000 to $1,249
- 309$1,250 to $1,499
- 30$1,500 to $1,999
- 1$2,000 or more

Median rent in 2022:
| Emerson East: | $1,054 |
| Madison: | $1,171 |
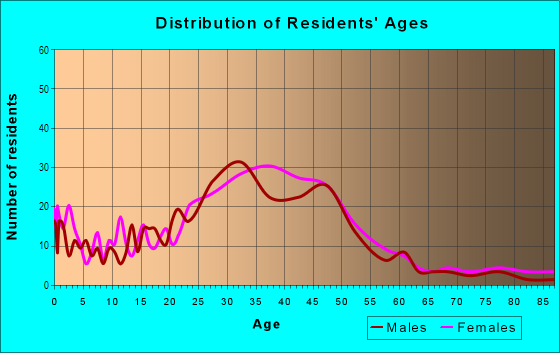
| Males: | 894 |
| Females: | 1,293 |
Males:
| This neighborhood: | 42.2 years |
| Whole city: | 31.7 years |
| This neighborhood: | 37.8 years |
| Whole city: | 32.7 years |
Average household size:
| Emerson East: | 9.5 people |
| Madison: | 2.0 people |
Percentage of family households:
| Emerson East: | 27.6% |
| Madison: | 34.8% |
| Here: | 29.0% |
| Madison: | 33.4% |
Percentage of married-couple families with children (among all households):
| Emerson East: | 27.8% |
| Madison: | 30.6% |
Percentage of single-mother households (among all households):
| Emerson East: | 15.9% |
| Madison: | 11.1% |
Percentage of never married males 15 years old and over:
Percentage of never married females 15 years old and over:
| Emerson East: | 18.8% |
| Madison: | 26.7% |
Percentage of never married females 15 years old and over:
| Emerson East: | 36.5% |
| city: | 23.7% |
Percentage of people that speak English not well or not at all:
| Emerson East: | 0.6% |
| Madison: | 1.5% |
Percentage of people born in this state:
Percentage of people born in another U.S. state:
Percentage of native residents but born outside the U.S.:
Percentage of foreign born residents:
| Here: | 54.4% |
| Madison: | 52.2% |
Percentage of people born in another U.S. state:
| Emerson East: | 34.8% |
| Madison: | 36.0% |
Percentage of native residents but born outside the U.S.:
| Here: | 2.6% |
| city: | 1.3% |
Percentage of foreign born residents:
| Here: | 8.2% |
| Madison: | 10.5% |
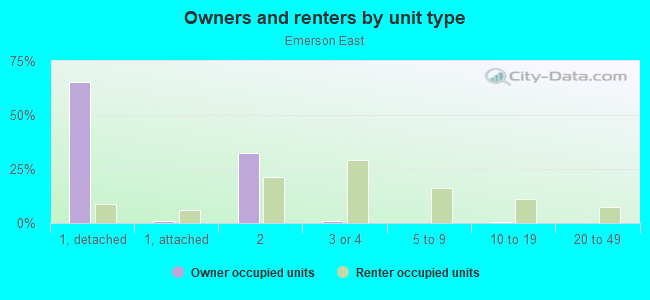
Owner-occupied
Renter-occupied

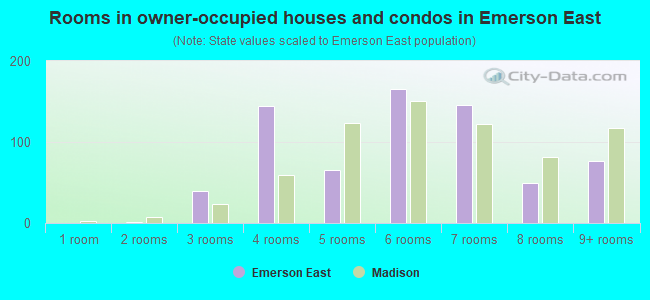
- Rooms in owner-occupied houses and condos in Emerson East
- 01 room
- 12 rooms
- 393 rooms
- 1444 rooms
- 655 rooms
- 1666 rooms
- 1467 rooms
- 508 rooms
- 779+ rooms
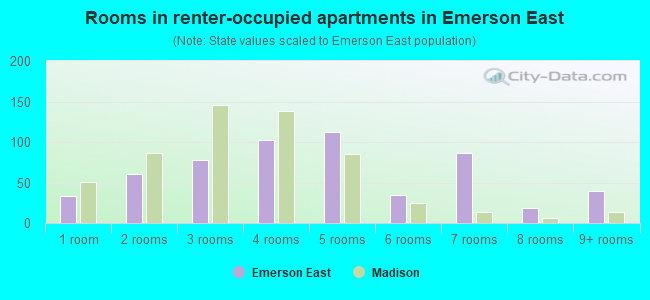
- Rooms in renter-occupied apartments in Emerson East
- 331 room
- 602 rooms
- 783 rooms
- 1034 rooms
- 1125 rooms
- 346 rooms
- 877 rooms
- 188 rooms
- 399+ rooms
Owner-occupied
Renter-occupied
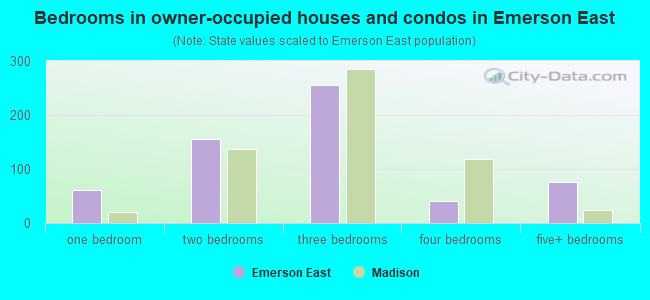
- Bedrooms in owner-occupied houses and condos in Emerson East
- 0no bedroom
- 611 bedroom
- 1562 bedrooms
- 2553 bedrooms
- 414 bedrooms
- 765+ bedrooms
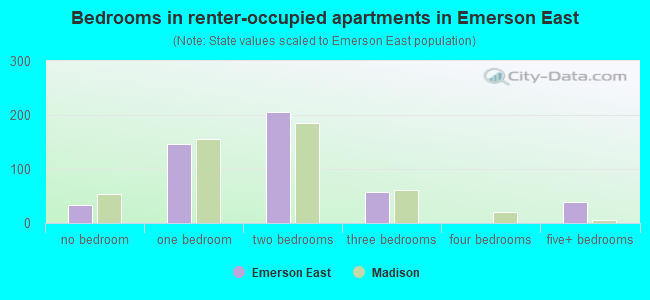
- Bedrooms in renter-occupied apartments in Emerson East
- 33no bedroom
- 1461 bedroom
- 2062 bedrooms
- 573 bedrooms
- 04 bedrooms
- 395+ bedrooms
Average number of cars or other vehicles available in houses/condos:
Average number of cars or other vehicles available in apartments:
| This neighborhood: | 1.8 |
| Madison: | 1.7 |
Average number of cars or other vehicles available in apartments:
| Here: | 1.4 |
| city: | 1.1 |
Percentage of units with a mortgage:
| Emerson East: | 85.6% |
| Madison: | 67.2% |
Average estimated value of detached houses in 2022 (48.9% of all units):
| Emerson East: | $310,538 |
| Madison: | $403,546 |
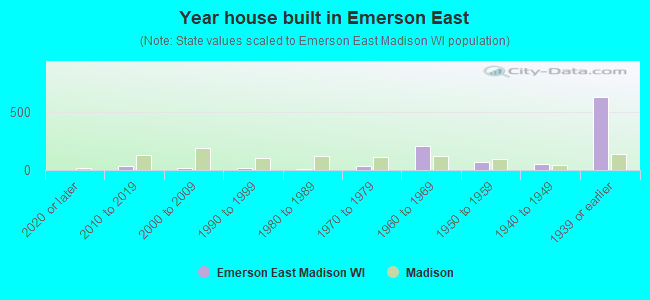
- Year house built in Emerson East
- 12020 or later
- 352010 to 2019
- 162000 to 2009
- 211990 to 1999
- 71980 to 1989
- 321970 to 1979
- 2051960 to 1969
- 721950 to 1959
- 521940 to 1949
- 6231939 or earlier
City-data.com crime index for city in 2020 (higher means more crime):
| City: | 230.1 |
| U.S. average: | 219.5 |
Travel time to work (commute)
![Travel time to work (commute)]()
- 7Less than 5 minutes
- 1835 to 9 minutes
- 20310 to 14 minutes
- 25015 to 19 minutes
- 12120 to 24 minutes
- 14025 to 29 minutes
- 20230 to 34 minutes
- 1735 to 39 minutes
- 2440 to 44 minutes
- 7045 to 59 minutes
- 1560 to 89 minutes
- 1390 or more minutes

Means of transportation to work
![Means of transportation to work]()
- 67.1%1,057Drove a car alone
- 5.8%92Carpooled
- 3.3%52Bus
- 5.2%82Bicycle
- 3.7%59Walked
- 8.4%132Other means
- 8.8%138Worked at home

Time leaving home to go to work
![Time leaving home to go to work]()
- 5612:00 a.m. to 4:59 a.m.
- 65:00 a.m. to 5:29 a.m.
- 705:30 a.m. to 5:59 a.m.
- 896:00 a.m. to 6:29 a.m.
- 1106:30 a.m. to 6:59 a.m.
- 977:00 a.m. to 7:29 a.m.
- 1447:30 a.m. to 7:59 a.m.
- 1548:00 a.m. to 8:29 a.m.
- 748:30 a.m. to 8:59 a.m.
- 1009:00 a.m. to 9:59 a.m.
- 13910:00 a.m. to 10:59 a.m.
- 1111:00 a.m. to 11:59 a.m.
- 7412:00 p.m. to 3:59 p.m.
- 1004:00 p.m. to 11:59 p.m.

Occupations of males:
- Percentage of males in management occupations (except farmers):
Here: 1.9% city: 10.9%
- Percentage of males in business and financial operations occupations:
Here: 13.2% city: 6.8%
- Percentage of males in computer and mathematical occupations:
Here: 12.0% city: 12.5%
- Percentage of males in architecture and engineering occupations:
Here: 2.3% city: 4.0%
- Percentage of males in life, physical, and social science occupations:
Here: 4.3% city: 4.2%
- Percentage of males in community and social services occupations:
Here: 11.3% city: 1.2%
- Percentage of males in education, training, and library occupations:
Here: 7.6% city: 7.6%
- Percentage of males in arts, design, entertainment, sports, and media occupations:
Here: 6.3% city: 2.5%
- Percentage of males in healthcare practitioners and technical occupations:
Here: 2.0% city: 4.0%
- Percentage of males in service occupations:
Here: 8.0% city: 13.0%
- Percentage of males in sales and office occupations:
Here: 8.5% city: 14.0%
- Percentage of males in construction, extraction, and maintenance occupations:
Here: 12.8% city: 3.6%
- Percentage of males in production occupations:
Here: 10.4% city: 5.4%
- Percentage of males in transportation occupations:
Here: 1.5% city: 2.6%
Occupations of females:
- Percentage of females in management occupations (except farmers):
Here: 7.1% city: 9.9%
- Percentage of females in business and financial operations occupations:
Here: 26.4% city: 6.6%
- Percentage of females in architecture and engineering occupations:
Here: 1.1% city: 1.2%
- Percentage of females in life, physical, and social science occupations:
Here: 1.1% city: 4.9%
- Percentage of females in community and social services occupations:
Here: 1.6% city: 3.1%
- Percentage of females in education, training, and library occupations:
Here: 7.7% city: 12.0%
- Percentage of females in healthcare practitioners and technical occupations:
Here: 8.9% city: 11.8%
- Percentage of females in service occupations:
Here: 13.8% city: 16.7%
- Percentage of females in sales and office occupations:
Here: 24.7% city: 19.7%
- Percentage of females in production occupations:
Here: 7.6% city: 3.0%
- Percentage of females in material moving occupations:
Here: 1.6% city: 1.6%
Percentage of people 16-64 in Armed Forces:
| Emerson East: | 0.4% |
| Madison: | 0.2% |
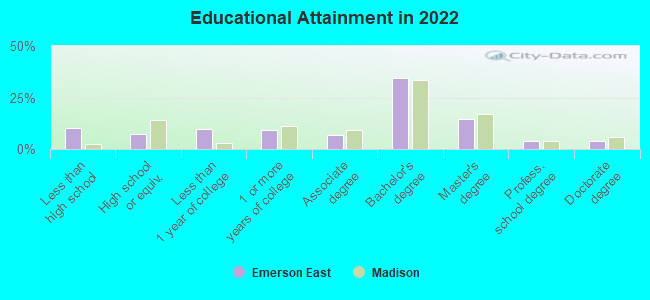
Education in this neighborhood (subdivision or community):
- Percentage of people 3 years and older in K-12 schools:
Emerson East: 14.6% Madison: 11.5%
- Percentage of people 3 years and older in undergraduate colleges:
Emerson East: 11.4% Madison: 15.1%
- Percentage of people 3 years and older in grad. or professional schools:
Emerson East: 4.9% Madison: 4.7%
- Percentage of students K-12 enrolled in private schools:
Emerson East: 24.6% Madison: 12.8%
Percentage of population below poverty level:
| Emerson East: | 8.8% |
| Madison: | 17.2% |
Median year owner moved in (as recorded in 2022):
Median year renter moved in (as recorded in 2022):
| Emerson East: | 2008 |
| Madison: | 2011 |
Median year renter moved in (as recorded in 2022):
| Emerson East: | 2018 |
| Madison: | 2022 |
Percentage of married-couple families with both working:
| Emerson East: | 93.1% |
| Madison: | 81.2% |
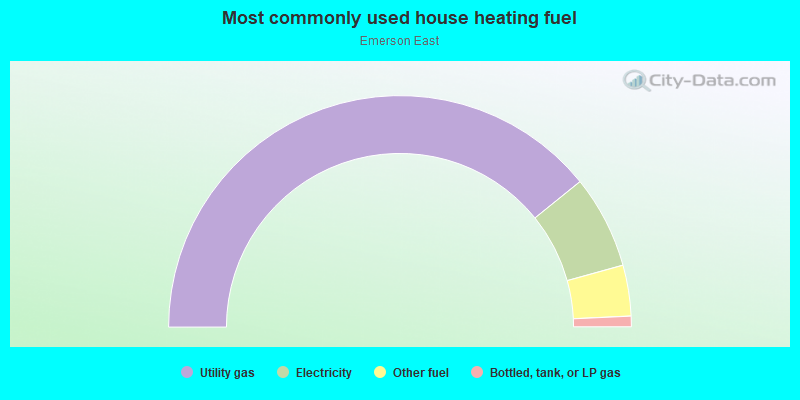
- 78.4%Utility gas
- 13.0%Electricity
- 7.1%Other fuel
- 1.5%Bottled, tank, or LP gas
Highways in this neighborhood:
Pennsylvania Ave (State Hwy 113)
Length: 0.85 miles
Directions: N-S, SW-NE
Address range: 2000 to 2399
Directions: N-S, SW-NE
Address range: 2000 to 2399
State Hwy 113 (N 1st St)
Length: 0.14 miles
Direction: SE-NW
Address range: 100 to 299
Direction: SE-NW
Address range: 100 to 299
State Hwy 113 (Packers Ave)
Length: 0.09 miles
Directions: N-S, SW-NE
Address range: 200 to 299
Directions: N-S, SW-NE
Address range: 200 to 299
Roads and streets:
E Johnson St
Length: 1.31 miles
Directions: E-W, N-S, SW-NE
Address range: 1504 to 2509
Directions: E-W, N-S, SW-NE
Address range: 1504 to 2509
E Dayton St
Length: 0.79 miles
Directions: E-W, SW-NE
Address range: 1900 to 2583
Directions: E-W, SW-NE
Address range: 1900 to 2583
E Mifflin St
Length: 0.71 miles
Direction: SW-NE
Address range: 1900 to 2499
Direction: SW-NE
Address range: 1900 to 2499
Fordem Ave
Length: 0.67 miles
Directions: N-S, SE-NW
Address range: 1600 to 2299
Directions: N-S, SE-NW
Address range: 1600 to 2299
N 6th St
Length: 0.54 miles
Direction: SE-NW
Address range: 100 to 799
Direction: SE-NW
Address range: 100 to 799
Hoard St
Length: 0.48 miles
Direction: SW-NE
Address range: 2300 to 2572
Direction: SW-NE
Address range: 2300 to 2572
N 7th St
Length: 0.34 miles
Direction: SE-NW
Address range: 100 to 599
Direction: SE-NW
Address range: 100 to 599
N 5th St
Length: 0.33 miles
Direction: SE-NW
Address range: 101 to 599
Direction: SE-NW
Address range: 101 to 599
Upham St
Length: 0.32 miles
Direction: SW-NE
Address range: 2300 to 2499
Direction: SW-NE
Address range: 2300 to 2499
N 3rd St
Length: 0.30 miles
Direction: SE-NW
Address range: 12 to 499
Direction: SE-NW
Address range: 12 to 499
Superior St
Length: 0.23 miles
Directions: E-W, N-S, SW-NE
Address range: 2200 to 2399
Directions: E-W, N-S, SW-NE
Address range: 2200 to 2399
N 4th St
Length: 0.19 miles
Direction: SE-NW
Address range: 100 to 399
Direction: SE-NW
Address range: 100 to 399
N 2nd St
Length: 0.19 miles
Direction: SE-NW
Address range: 15 to 299
Direction: SE-NW
Address range: 15 to 299
N Sherman Ave
Length: 0.15 miles
Direction: N-S
Address range: 200 to 416
Direction: N-S
Address range: 200 to 416
Carey Ct
Length: 0.10 miles
Direction: SW-NE
Address range: 2000 to 2099
Direction: SW-NE
Address range: 2000 to 2099
Erie Ct
Length: 0.07 miles
Direction: E-W
Address range: 1700 to 1799
Direction: E-W
Address range: 1700 to 1799
Michigan Ct
Length: 0.07 miles
Direction: E-W
Address range: 1700 to 1799
Direction: E-W
Address range: 1700 to 1799
N 8th St
Length: 0.07 miles
Direction: SE-NW
Address range: 500 to 599
Direction: SE-NW
Address range: 500 to 599
Northfield Pl
Length: 0.07 miles
Direction: E-W
Address range: 1700 to 1799
Direction: E-W
Address range: 1700 to 1799
Railroad features:
Canadian Pacific Rlwy
Length: 1.40 miles
Directions: N-S, SW-NE
Directions: N-S, SW-NE
Soo Line RR
Length: 0.38 miles
Directions: E-W, N-S, SE-NW
Directions: E-W, N-S, SE-NW
Wisconsin & Southern RR
Length: 0.31 miles
Direction: N-S
Direction: N-S
Union Paciric RR
Length: 0.14 miles
Direction: N-S
Direction: N-S