Elftman neighborhood in Long Beach, Alto Alegre, California (CA), 90221, 90220, 90805, 90810 detailed profile
Settings
X

Business Search - 14 Million verified businesses
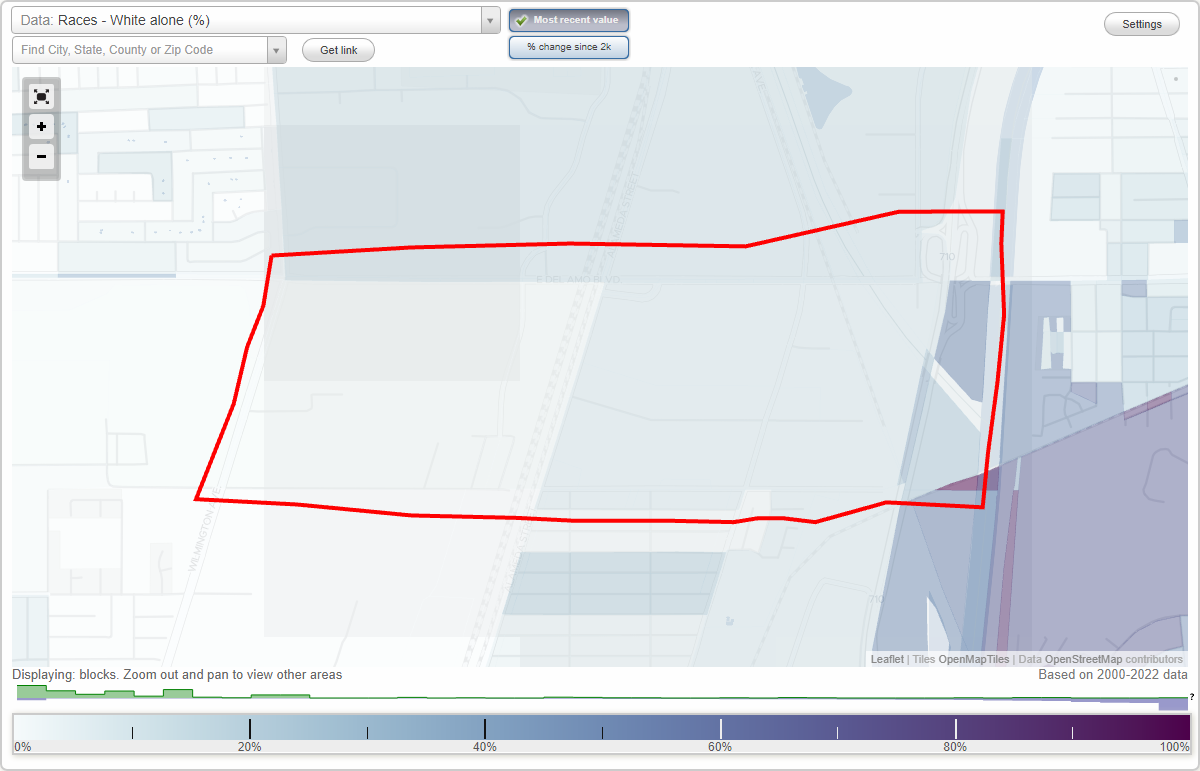
Area: 1.264 square miles
Population: 4,872
Population density:
| Elftman: | 3,855 people per square mile |
| Long Beach: | 8,948 people per square mile |

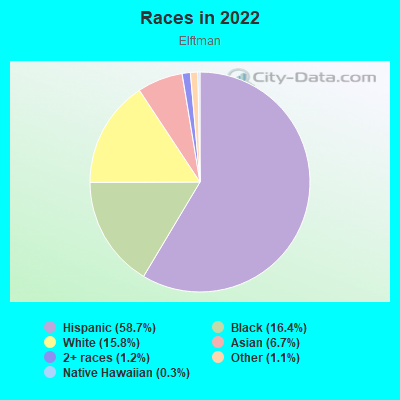
- 2,87358.7%Hispanic or Latino
- 80116.4%Black
- 77315.8%White
- 3286.7%Asian
- 571.2%Two or more races
- 531.1%Some other race
- 130.3%Native Hawaiian and Other
Pacific Islander
Median household income in 2022:
| Elftman: | $91,973 |
| Long Beach: | $80,493 |
Distribution of median household income
![Distribution of median household income]()
- 92Less than $10,000
- 68$10,000 to $19,999
- 94$20,000 to $29,999
- 88$30,000 to $39,999
- 276$40,000 to $49,999
- 127$50,000 to $59,999
- 107$60,000 to $74,999
- 252$75,000 to $99,999
- 205$100,000 to $124,999
- 84$125,000 to $149,999
- 98$150,000 to $199,999
- 177$200,000 or more

Distribution of owner-occupied house/condo value
![Distribution of owner-occupied house/condo value]()
- 85Less than $50,000
- 196$50,000 to $99,999
- 87$100,000 to $149,999
- 62$150,000 to $199,999
- 118$200,000 to $249,999
- 12$250,000 to $299,999
- 26$300,000 to $399,999
- 84$400,000 to $499,999
- 154$500,000 to $749,999
- 132$750,000 to $999,999
- 210$1,000,000 or more

Distribution of rent paid by renters
![Distribution of rent paid by renters]()
- 186$600 to $699
- 15$700 to $799
- 419$800 to $899
- 155$900 to $999
- 78$1,000 to $1,249
- 172$1,250 to $1,499
- 527$1,500 to $1,999
- 199$2,000 or more

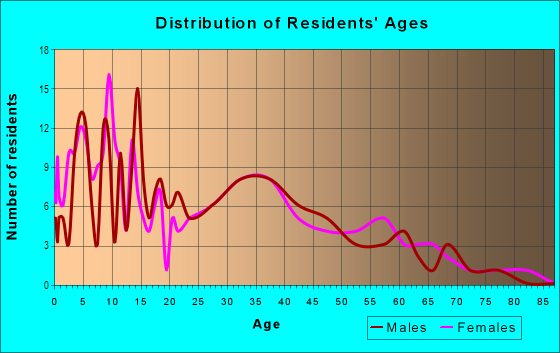
| Males: | 2,499 |
| Females: | 2,372 |
Males:
| This neighborhood: | 36.5 years |
| Whole city: | 35.5 years |
| This neighborhood: | 35.1 years |
| Whole city: | 37.7 years |
Average household size:
| Elftman: | 17.9 people |
| Long Beach: | 2.6 people |
Percentage of family households:
| Elftman: | 58.4% |
| Long Beach: | 43.1% |
| Here: | 28.7% |
| Long Beach: | 35.6% |
Percentage of married-couple families with children (among all households):
| Elftman: | 8.0% |
| Long Beach: | 21.4% |
Percentage of single-mother households (among all households):
| Elftman: | 18.1% |
| Long Beach: | 12.6% |
Percentage of never married males 15 years old and over:
Percentage of never married females 15 years old and over:
| Elftman: | 28.7% |
| Long Beach: | 24.6% |
Percentage of never married females 15 years old and over:
| Elftman: | 25.7% |
| city: | 23.9% |
Percentage of people that speak English not well or not at all:
| Elftman: | 12.6% |
| Long Beach: | 7.4% |
Percentage of people born in this state:
Percentage of people born in another U.S. state:
Percentage of native residents but born outside the U.S.:
Percentage of foreign born residents:
| Here: | 53.3% |
| Long Beach: | 62.4% |
Percentage of people born in another U.S. state:
| Elftman: | 7.7% |
| Long Beach: | 12.5% |
Percentage of native residents but born outside the U.S.:
| Here: | 2.1% |
| city: | 1.4% |
Percentage of foreign born residents:
| Here: | 36.8% |
| Long Beach: | 23.7% |
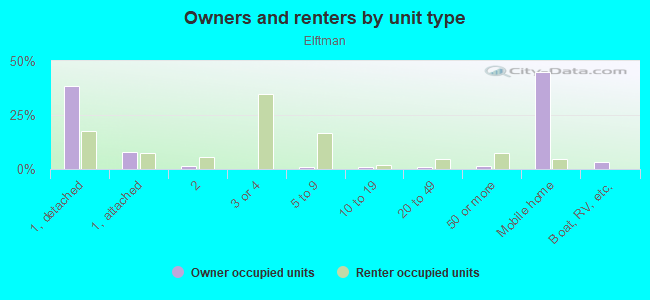
Owner-occupied
Renter-occupied

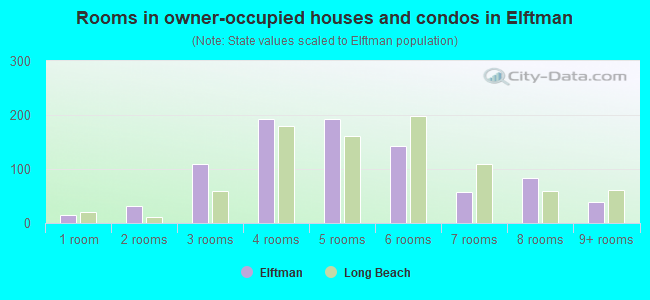
- Rooms in owner-occupied houses and condos in Elftman
- 141 room
- 312 rooms
- 1093 rooms
- 1924 rooms
- 1935 rooms
- 1426 rooms
- 577 rooms
- 848 rooms
- 399+ rooms
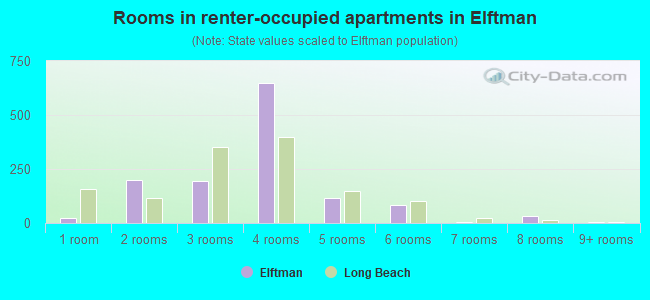
- Rooms in renter-occupied apartments in Elftman
- 221 room
- 2012 rooms
- 1963 rooms
- 6504 rooms
- 1145 rooms
- 856 rooms
- 67 rooms
- 348 rooms
- 69+ rooms
Owner-occupied
Renter-occupied
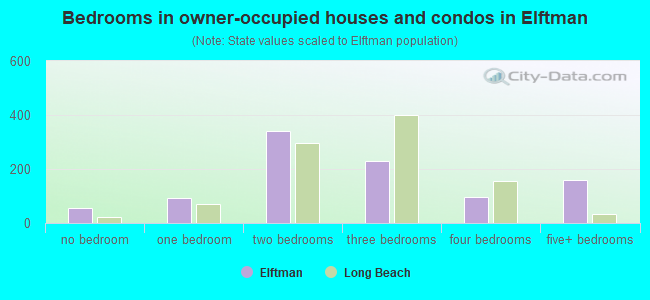
- Bedrooms in owner-occupied houses and condos in Elftman
- 54no bedroom
- 931 bedroom
- 3412 bedrooms
- 2313 bedrooms
- 984 bedrooms
- 1615+ bedrooms
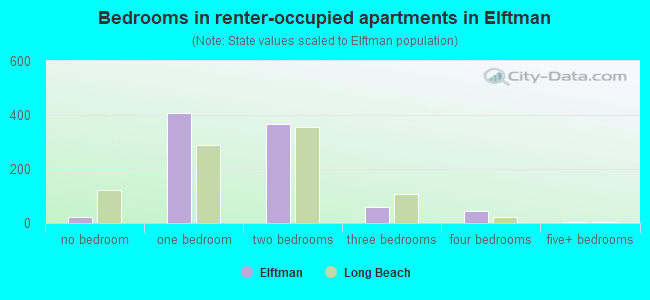
- Bedrooms in renter-occupied apartments in Elftman
- 22no bedroom
- 4061 bedroom
- 3652 bedrooms
- 603 bedrooms
- 444 bedrooms
- 45+ bedrooms
Average number of cars or other vehicles available in houses/condos:
Average number of cars or other vehicles available in apartments:
| This neighborhood: | 2.1 |
| Long Beach: | 2.1 |
Average number of cars or other vehicles available in apartments:
| Here: | 1.7 |
| city: | 1.4 |
Percentage of units with a mortgage:
| Elftman: | 48.7% |
| Long Beach: | 70.2% |
Average estimated value of detached houses in 2022 (35.0% of all units):
| Elftman: | $747,416 |
| Long Beach: | $840,606 |
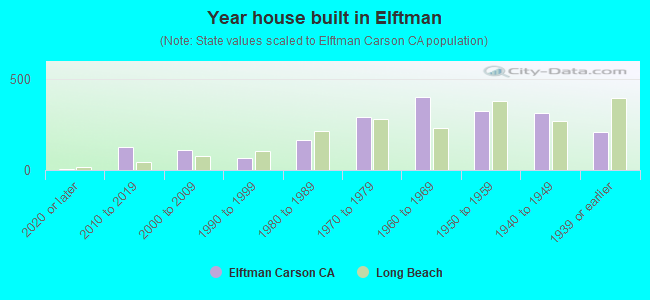
- Year house built in Elftman
- 62020 or later
- 1242010 to 2019
- 1122000 to 2009
- 631990 to 1999
- 1651980 to 1989
- 2931970 to 1979
- 3981960 to 1969
- 3231950 to 1959
- 3121940 to 1949
- 2061939 or earlier
City-data.com crime index for city in 2020 (higher means more crime):
| City: | 312.7 |
| U.S. average: | 219.5 |
Travel time to work (commute)
![Travel time to work (commute)]()
- 10Less than 5 minutes
- 565 to 9 minutes
- 7110 to 14 minutes
- 20015 to 19 minutes
- 13920 to 24 minutes
- 2225 to 29 minutes
- 18830 to 34 minutes
- 3335 to 39 minutes
- 7140 to 44 minutes
- 25845 to 59 minutes
- 11960 to 89 minutes
- 3390 or more minutes

Means of transportation to work
![Means of transportation to work]()
- 67.6%1,510Drove a car alone
- 15.9%356Carpooled
- 11.7%261Bus
- 0.1%3Subway or elevated rail
- 0.2%5Motorcycle
- 1.0%22Walked
- 3.9%87Other means
- 10.1%226Worked at home

Time leaving home to go to work
![Time leaving home to go to work]()
- 9912:00 a.m. to 4:59 a.m.
- 655:00 a.m. to 5:29 a.m.
- 1145:30 a.m. to 5:59 a.m.
- 1156:00 a.m. to 6:29 a.m.
- 596:30 a.m. to 6:59 a.m.
- 1277:00 a.m. to 7:29 a.m.
- 897:30 a.m. to 7:59 a.m.
- 1308:00 a.m. to 8:29 a.m.
- 408:30 a.m. to 8:59 a.m.
- 639:00 a.m. to 9:59 a.m.
- 3710:00 a.m. to 10:59 a.m.
- 1311:00 a.m. to 11:59 a.m.
- 5812:00 p.m. to 3:59 p.m.
- 394:00 p.m. to 11:59 p.m.

Occupations of males:
- Percentage of males in management occupations (except farmers):
Here: 11.7% city: 10.3%
- Percentage of males in business and financial operations occupations:
Here: 4.0% city: 5.1%
- Percentage of males in computer and mathematical occupations:
Here: 7.0% city: 4.1%
- Percentage of males in architecture and engineering occupations:
Here: 4.6% city: 3.2%
- Percentage of males in community and social services occupations:
Here: 1.1% city: 1.0%
- Percentage of males in education, training, and library occupations:
Here: 2.5% city: 3.8%
- Percentage of males in arts, design, entertainment, sports, and media occupations:
Here: 1.5% city: 4.0%
- Percentage of males in healthcare practitioners and technical occupations:
Here: 3.6% city: 3.0%
- Percentage of males in service occupations:
Here: 26.9% city: 16.3%
- Percentage of males in sales and office occupations:
Here: 15.2% city: 15.7%
- Percentage of males in farming, fishing, and forestry occupations:
Here: 1.1% city: 0.3%
- Percentage of males in construction, extraction, and maintenance occupations:
Here: 4.1% city: 7.8%
- Percentage of males in production occupations:
Here: 4.5% city: 6.4%
- Percentage of males in transportation occupations:
Here: 2.6% city: 6.8%
- Percentage of males in material moving occupations:
Here: 5.8% city: 5.9%
Occupations of females:
- Percentage of females in management occupations (except farmers):
Here: 8.6% city: 9.5%
- Percentage of females in business and financial operations occupations:
Here: 3.6% city: 6.5%
- Percentage of females in community and social services occupations:
Here: 1.6% city: 3.3%
- Percentage of females in education, training, and library occupations:
Here: 5.8% city: 8.3%
- Percentage of females in healthcare practitioners and technical occupations:
Here: 10.4% city: 7.4%
- Percentage of females in service occupations:
Here: 16.5% city: 21.6%
- Percentage of females in sales and office occupations:
Here: 37.7% city: 27.8%
- Percentage of females in farming, fishing, and forestry occupations:
Here: 1.3% city: 0.2%
- Percentage of females in construction, extraction, and maintenance occupations:
Here: 2.7% city: 0.2%
- Percentage of females in production occupations:
Here: 2.9% city: 3.0%
- Percentage of females in transportation occupations:
Here: 3.1% city: 1.4%
- Percentage of females in material moving occupations:
Here: 2.6% city: 2.5%
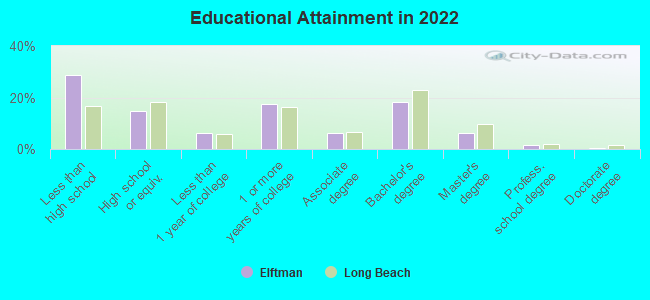
Education in this neighborhood (subdivision or community):
- Percentage of people 3 years and older in K-12 schools:
Elftman: 20.9% Long Beach: 15.8%
- Percentage of people 3 years and older in undergraduate colleges:
Elftman: 5.5% Long Beach: 7.2%
- Percentage of people 3 years and older in grad. or professional schools:
Elftman: 1.8% Long Beach: 1.4%
- Percentage of students K-12 enrolled in private schools:
Elftman: 19.4% Long Beach: 4.5%
Percentage of population below poverty level:
| Elftman: | 24.9% |
| Long Beach: | 13.8% |
Median year owner moved in (as recorded in 2022):
Median year renter moved in (as recorded in 2022):
| Elftman: | 2009 |
| Long Beach: | 2007 |
Median year renter moved in (as recorded in 2022):
| Elftman: | 2011 |
| Long Beach: | 2018 |
Percentage of married-couple families with both working:
| Elftman: | 67.1% |
| Long Beach: | 68.2% |
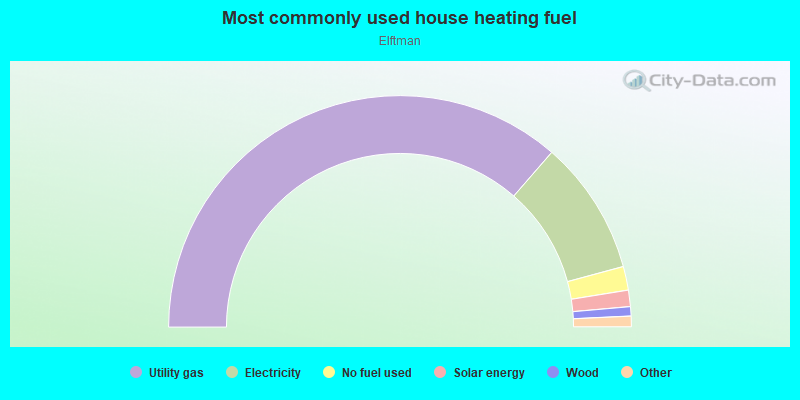
- 72.8%Utility gas
- 18.8%Electricity
- 3.3%No fuel used
- 2.3%Solar energy
- 1.3%Wood
- 0.9%Fuel oil, kerosene, etc.
- 0.6%Bottled, tank, or LP gas
Limited-access highways (interstate or state) in this neighborhood:
Long Beach Fwy (I- 710)
Length: 0.72 miles
Direction: N-S
Direction: N-S
Highways in this neighborhood:
S Alameda St (State Rte 47)
Length: 1.15 miles
Directions: N-S, SW-NE
Address range: 20386 to 21099
Directions: N-S, SW-NE
Address range: 20386 to 21099
Roads and streets:
E Dominguez St
Length: 2.00 miles
Direction: E-W
Address range: 1900 to 3099
Direction: E-W
Address range: 1900 to 3099
E del Amo Blvd
Length: 1.88 miles
Direction: E-W
Address range: 1894 to 2999
Direction: E-W
Address range: 1894 to 2999
E Tyler St
Length: 0.70 miles
Direction: E-W
Address range: 2500 to 2899
Direction: E-W
Address range: 2500 to 2899
Santa Fe Ave (S Santa Fe Ave)
Length: 0.60 miles
Direction: N-S
Address range: 20484 to 21099
Direction: N-S
Address range: 20484 to 21099
el Presido St (E el Presidio St)
Length: 0.59 miles
Direction: E-W
Address range: 2500 to 2899
Direction: E-W
Address range: 2500 to 2899
E 208th St
Length: 0.55 miles
Directions: E-W, N-S, SE-NW
Address range: 2800 to 2899
Directions: E-W, N-S, SE-NW
Address range: 2800 to 2899
Wilmington Ave
Length: 0.54 miles
Direction: N-S
Address range: 20400 to 20999
Direction: N-S
Address range: 20400 to 20999
Fordyce Ave
Length: 0.39 miles
Direction: N-S
Address range: 20400 to 20899
Direction: N-S
Address range: 20400 to 20899
E el Presidio St
Length: 0.27 miles
Direction: E-W
Direction: E-W
W del Amo Blvd
Length: 0.25 miles
Direction: E-W
Address range: 400 to 3099
Direction: E-W
Address range: 400 to 3099
S Maciel Ave
Length: 0.24 miles
Direction: N-S
Address range: 20900 to 20999
Direction: N-S
Address range: 20900 to 20999
Dominguez St
Length: 0.23 miles
Direction: E-W
Address range: 706 to 999
Direction: E-W
Address range: 706 to 999
S Susana Rd
Length: 0.19 miles
Direction: N-S
Address range: 20200 to 20499
Direction: N-S
Address range: 20200 to 20499
S Brant Ave
Length: 0.14 miles
Direction: N-S
Address range: 20900 to 20999
Direction: N-S
Address range: 20900 to 20999
Lamberton Ave
Length: 0.13 miles
Direction: N-S
Address range: 20900 to 20999
Direction: N-S
Address range: 20900 to 20999
209th St
Length: 0.13 miles
Directions: E-W, N-S, SE-NW
Address range: 2300 to 2499
Directions: E-W, N-S, SE-NW
Address range: 2300 to 2499
S Rancho Way
Length: 0.13 miles
Directions: E-W, N-S, SW-NE
Address range: 20146 to 20399
Directions: E-W, N-S, SW-NE
Address range: 20146 to 20399
Sommerset Ln
Length: 0.08 miles
Direction: N-S
Direction: N-S
S Reeves Ave
Length: 0.07 miles
Direction: N-S
Address range: 20400 to 24098
Direction: N-S
Address range: 20400 to 24098
S Prospect Ave
Length: 0.05 miles
Direction: N-S
Address range: 21000 to 21099
Direction: N-S
Address range: 21000 to 21099
S Harbor View Ave
Length: 0.05 miles
Direction: N-S
Address range: 21000 to 21099
Direction: N-S
Address range: 21000 to 21099
S Baltic Ave
Length: 0.05 miles
Direction: N-S
Address range: 21000 to 21099
Direction: N-S
Address range: 21000 to 21099
Railroad features:
Pacific Electric Rlwy
Length: 0.59 miles
Directions: N-S, SE-NW
Directions: N-S, SE-NW
Southern Pacific RR
Length: 0.55 miles
Direction: N-S
Direction: N-S
Union Pacific RR
Length: 0.23 miles
Direction: E-W
Direction: E-W