El Tivoli Place neighborhood in Dallas, Texas (TX), 75211 detailed profile
Settings
X


Business Search - 14 Million verified businesses
Area: 0.175 square miles
Population: 1,550
Population density:
| El Tivoli Place: | 8,841 people per square mile |
| Dallas: | 3,794 people per square mile |

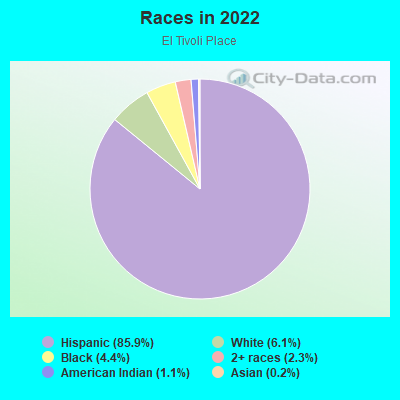
- 1,43685.9%Hispanic or Latino
- 1026.1%White
- 734.4%Black
- 392.3%Two or more races
- 181.1%American Indian
- 30.2%Asian
Median household income in 2022:
| El Tivoli Place: | $62,356 |
| Dallas: | $65,400 |
Distribution of median household income
![Distribution of median household income]()
- 61Less than $10,000
- 79$10,000 to $19,999
- 121$20,000 to $29,999
- 52$30,000 to $39,999
- 88$40,000 to $49,999
- 37$50,000 to $59,999
- 72$60,000 to $74,999
- 73$75,000 to $99,999
- 8$100,000 to $124,999
- 17$125,000 to $149,999
- 31$150,000 to $199,999
- 2$200,000 or more

Distribution of owner-occupied house/condo value
![Distribution of owner-occupied house/condo value]()
- 12Less than $50,000
- 14$50,000 to $99,999
- 96$100,000 to $149,999
- 26$150,000 to $199,999
- 192$200,000 to $249,999
- 60$250,000 to $299,999
- 25$300,000 to $399,999
- 8$400,000 to $499,999
- 20$500,000 to $749,999
- 11$750,000 to $999,999
- 3$1,000,000 or more

Distribution of rent paid by renters
![Distribution of rent paid by renters]()
- 11$300 to $399
- 16$500 to $599
- 31$600 to $699
- 44$700 to $799
- 16$800 to $899
- 226$900 to $999
- 57$1,000 to $1,249
- 33$1,250 to $1,499
- 189$1,500 to $1,999
- 55$2,000 or more

Median rent in 2022:
| El Tivoli Place: | $1,217 |
| Dallas: | $1,208 |
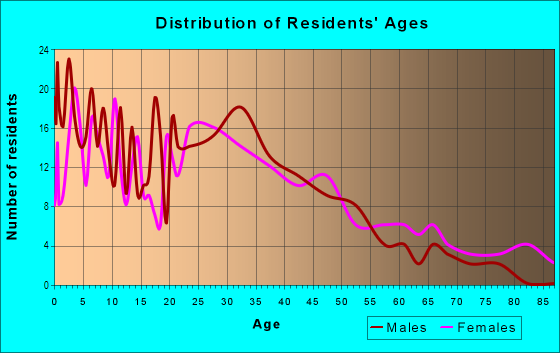
| Males: | 722 |
| Females: | 828 |
Males:
| This neighborhood: | 41.3 years |
| Whole city: | 32.8 years |
| This neighborhood: | 38.6 years |
| Whole city: | 33.4 years |
Average household size:
| El Tivoli Place: | 2.5 people |
| Dallas: | 2.4 people |
Percentage of family households:
| El Tivoli Place: | 43.8% |
| Dallas: | 42.6% |
| Here: | 37.7% |
| Dallas: | 33.8% |
Percentage of married-couple families with children (among all households):
| El Tivoli Place: | 18.5% |
| Dallas: | 24.8% |
Percentage of single-mother households (among all households):
| El Tivoli Place: | 10.2% |
| Dallas: | 13.3% |
Percentage of never married males 15 years old and over:
Percentage of never married females 15 years old and over:
| El Tivoli Place: | 23.9% |
| Dallas: | 22.1% |
Percentage of never married females 15 years old and over:
| El Tivoli Place: | 20.7% |
| city: | 21.8% |
Percentage of people that speak English not well or not at all:
| El Tivoli Place: | 28.5% |
| Dallas: | 10.7% |
Percentage of people born in this state:
Percentage of people born in another U.S. state:
Percentage of native residents but born outside the U.S.:
Percentage of foreign born residents:
| Here: | 52.5% |
| Dallas: | 52.8% |
Percentage of people born in another U.S. state:
| El Tivoli Place: | 14.2% |
| Dallas: | 22.0% |
Percentage of native residents but born outside the U.S.:
| Here: | 2.1% |
| city: | 1.3% |
Percentage of foreign born residents:
| Here: | 31.1% |
| Dallas: | 23.9% |
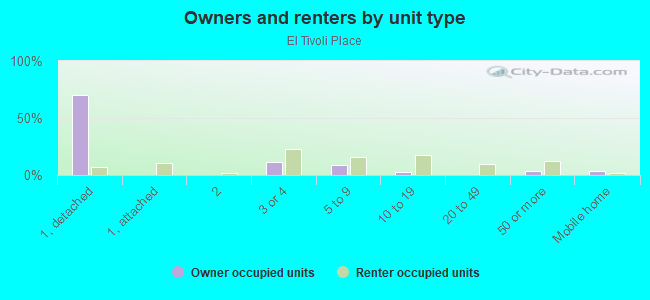
Owner-occupied
Renter-occupied

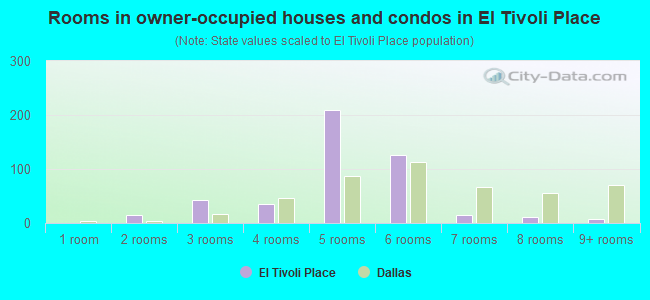
- Rooms in owner-occupied houses and condos in El Tivoli Place
- 01 room
- 142 rooms
- 433 rooms
- 364 rooms
- 2095 rooms
- 1266 rooms
- 157 rooms
- 128 rooms
- 79+ rooms
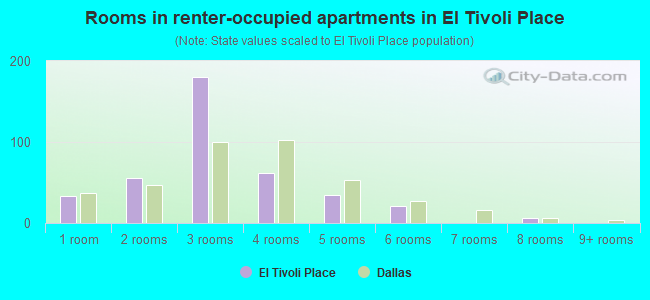
- Rooms in renter-occupied apartments in El Tivoli Place
- 331 room
- 562 rooms
- 1803 rooms
- 624 rooms
- 345 rooms
- 216 rooms
- 07 rooms
- 68 rooms
- 09+ rooms
Owner-occupied
Renter-occupied
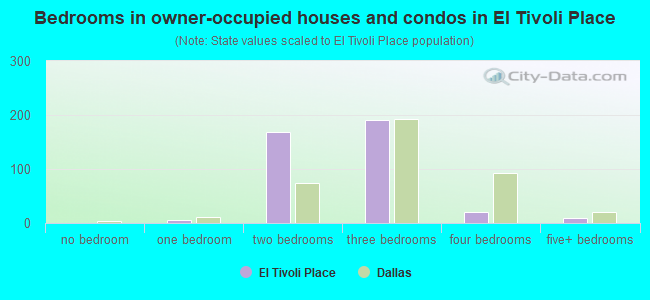
- Bedrooms in owner-occupied houses and condos in El Tivoli Place
- 0no bedroom
- 51 bedroom
- 1692 bedrooms
- 1903 bedrooms
- 204 bedrooms
- 105+ bedrooms
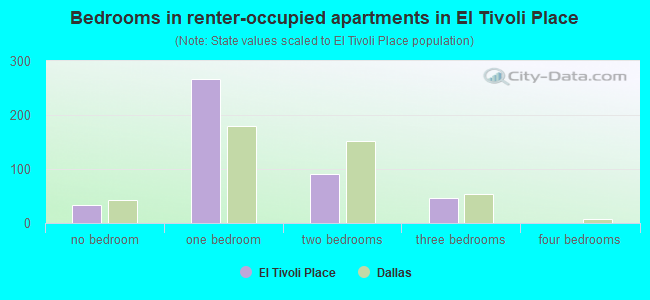
- Bedrooms in renter-occupied apartments in El Tivoli Place
- 33no bedroom
- 2661 bedroom
- 912 bedrooms
- 473 bedrooms
- 04 bedrooms
- 05+ bedrooms
Average number of cars or other vehicles available in houses/condos:
Average number of cars or other vehicles available in apartments:
| This neighborhood: | 2.0 |
| Dallas: | 2.1 |
Average number of cars or other vehicles available in apartments:
| Here: | 1.6 |
| city: | 1.3 |
Percentage of units with a mortgage:
| El Tivoli Place: | 27.6% |
| Dallas: | 53.9% |
Average estimated value of detached houses in 2022 (83.2% of all units):
| El Tivoli Place: | $200,089 |
| Dallas: | $423,859 |

- Year house built in El Tivoli Place
- 372020 or later
- 702010 to 2019
- 1022000 to 2009
- 261990 to 1999
- 1141980 to 1989
- 301970 to 1979
- 271960 to 1969
- 951950 to 1959
- 2791940 to 1949
- 321939 or earlier
City-data.com crime index for city in 2020 (higher means more crime):
| City: | 439.5 |
| U.S. average: | 219.5 |
Travel time to work (commute)
![Travel time to work (commute)]()
- 7Less than 5 minutes
- 755 to 9 minutes
- 7210 to 14 minutes
- 15515 to 19 minutes
- 11620 to 24 minutes
- 8125 to 29 minutes
- 22330 to 34 minutes
- 3335 to 39 minutes
- 6440 to 44 minutes
- 1045 to 59 minutes
- 7260 to 89 minutes
- 290 or more minutes

Means of transportation to work
![Means of transportation to work]()
- 71.5%515Drove a car alone
- 22.6%163Carpooled
- 5.6%40Bus
- 2.1%15Walked
- 21.8%157Other means
- 7.4%53Worked at home

Time leaving home to go to work
![Time leaving home to go to work]()
- 3812:00 a.m. to 4:59 a.m.
- 1125:00 a.m. to 5:29 a.m.
- 495:30 a.m. to 5:59 a.m.
- 626:00 a.m. to 6:29 a.m.
- 1316:30 a.m. to 6:59 a.m.
- 1897:00 a.m. to 7:29 a.m.
- 527:30 a.m. to 7:59 a.m.
- 1138:00 a.m. to 8:29 a.m.
- 108:30 a.m. to 8:59 a.m.
- 789:00 a.m. to 9:59 a.m.
- 6510:00 a.m. to 10:59 a.m.
- 1611:00 a.m. to 11:59 a.m.
- 3712:00 p.m. to 3:59 p.m.
- 424:00 p.m. to 11:59 p.m.

Occupations of males:
- Percentage of males in business and financial operations occupations:
Here: 1.9% city: 7.3%
- Percentage of males in computer and mathematical occupations:
Here: 1.4% city: 4.7%
- Percentage of males in healthcare practitioners and technical occupations:
Here: 4.1% city: 2.7%
- Percentage of males in service occupations:
Here: 35.8% city: 12.3%
- Percentage of males in sales and office occupations:
Here: 4.8% city: 14.9%
- Percentage of males in construction, extraction, and maintenance occupations:
Here: 22.9% city: 15.2%
- Percentage of males in production occupations:
Here: 6.2% city: 5.0%
- Percentage of males in transportation occupations:
Here: 10.9% city: 5.9%
- Percentage of males in material moving occupations:
Here: 8.2% city: 6.2%
Occupations of females:
- Percentage of females in management occupations (except farmers):
Here: 2.0% city: 9.6%
- Percentage of females in education, training, and library occupations:
Here: 3.7% city: 7.1%
- Percentage of females in service occupations:
Here: 51.4% city: 20.5%
- Percentage of females in sales and office occupations:
Here: 16.6% city: 27.7%
- Percentage of females in production occupations:
Here: 10.3% city: 3.6%
- Percentage of females in material moving occupations:
Here: 15.0% city: 3.2%
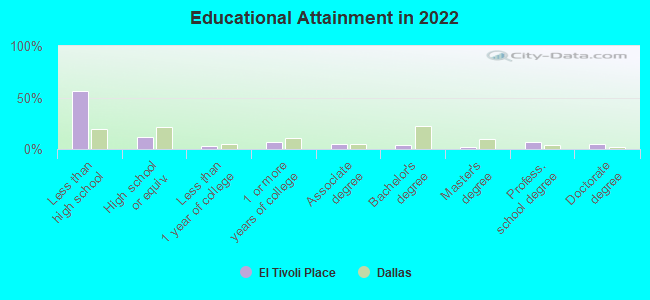
Education in this neighborhood (subdivision or community):
- Percentage of people 3 years and older in K-12 schools:
El Tivoli Place: 31.7% Dallas: 17.3%
- Percentage of people 3 years and older in undergraduate colleges:
El Tivoli Place: 4.7% Dallas: 4.1%
- Percentage of people 3 years and older in grad. or professional schools:
El Tivoli Place: 2.3% Dallas: 1.7%
- Percentage of students K-12 enrolled in private schools:
El Tivoli Place: 15.6% Dallas: 10.8%
Percentage of population below poverty level:
| El Tivoli Place: | 17.4% |
| Dallas: | 17.8% |
Median year owner moved in (as recorded in 2022):
Median year renter moved in (as recorded in 2022):
| El Tivoli Place: | 2003 |
| Dallas: | 2010 |
Median year renter moved in (as recorded in 2022):
| El Tivoli Place: | 2016 |
| Dallas: | 2020 |
Percentage of married-couple families with both working:
| El Tivoli Place: | 175.3% |
| Dallas: | 58.3% |
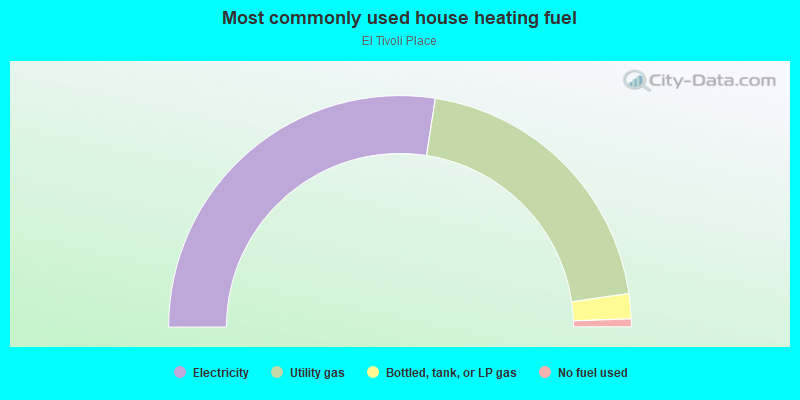
- 54.9%Electricity
- 40.5%Utility gas
- 3.5%Bottled, tank, or LP gas
- 1.1%No fuel used
Highways in this neighborhood:
State Hwy 180 (W Davis St)
Length: 0.32 miles
Direction: E-W
Address range: 2600 to 2879
Direction: E-W
Address range: 2600 to 2879
Roads and streets:
N Plymouth Rd
Length: 0.50 miles
Directions: E-W, N-S, SW-NE
Address range: 600 to 850
Directions: E-W, N-S, SW-NE
Address range: 600 to 850
Avon St
Length: 0.44 miles
Directions: E-W, N-S, SE-NW, SW-NE
Address range: 900 to 2830
Directions: E-W, N-S, SE-NW, SW-NE
Address range: 900 to 2830
Cliffdale Ave
Length: 0.36 miles
Direction: N-S
Address range: 600 to 1099
Direction: N-S
Address range: 600 to 1099
Alpaca Pass
Length: 0.32 miles
Directions: E-W, N-S, SE-NW, SW-NE
Address range: 2500 to 2599
Directions: E-W, N-S, SE-NW, SW-NE
Address range: 2500 to 2599
Bahama Dr
Length: 0.28 miles
Directions: E-W, N-S, SE-NW
Address range: 2400 to 2522
Directions: E-W, N-S, SE-NW
Address range: 2400 to 2522
Reverchon Dr
Length: 0.26 miles
Directions: N-S, SW-NE
Address range: 600 to 999
Directions: N-S, SW-NE
Address range: 600 to 999
el Tivoli Dr
Length: 0.24 miles
Directions: E-W, SE-NW
Address range: 2700 to 2799
Directions: E-W, SE-NW
Address range: 2700 to 2799
Overcrest St
Length: 0.24 miles
Directions: E-W, SE-NW
Address range: 2700 to 2823
Directions: E-W, SE-NW
Address range: 2700 to 2823
San Jose Dr
Length: 0.14 miles
Directions: E-W, SE-NW
Address range: 2700 to 2799
Directions: E-W, SE-NW
Address range: 2700 to 2799
Mateur St
Length: 0.14 miles
Directions: E-W, SE-NW
Address range: 2700 to 2799
Directions: E-W, SE-NW
Address range: 2700 to 2799
Chevez Dr
Length: 0.14 miles
Directions: N-S, SW-NE
Address range: 900 to 1099
Directions: N-S, SW-NE
Address range: 900 to 1099
Buna Dr
Length: 0.09 miles
Directions: E-W, SE-NW
Address range: 2700 to 2799
Directions: E-W, SE-NW
Address range: 2700 to 2799
Other features:
Coombs Crk
Length: 0.17 miles
Directions: E-W, N-S, SE-NW, SW-NE
Directions: E-W, N-S, SE-NW, SW-NE