Edenvale neighborhood in San Jose, California (CA), 95111 detailed profile
Settings
X


Business Search - 14 Million verified businesses
Area: 0.337 square miles
Population: 831
Population density:
| Edenvale: | 2,463 people per square mile |
| San Jose: | 5,554 people per square mile |

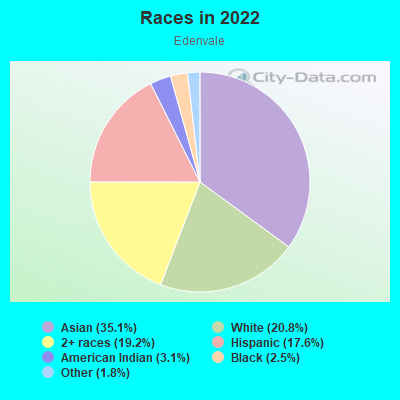
- 37135.1%Asian
- 22020.8%White
- 20319.2%Two or more races
- 18617.6%Hispanic or Latino
- 333.1%American Indian
- 262.5%Black
- 191.8%Some other race
Median household income in 2022:
| Edenvale: | $186,359 |
| San Jose: | $133,835 |
Distribution of median household income
![Distribution of median household income]()
- 24Less than $10,000
- 84$10,000 to $19,999
- 12$20,000 to $29,999
- 11$30,000 to $39,999
- 19$40,000 to $49,999
- 121$50,000 to $59,999
- 23$60,000 to $74,999
- 51$75,000 to $99,999
- 42$100,000 to $124,999
- 172$125,000 to $149,999
- 74$150,000 to $199,999
- 149$200,000 or more

Distribution of owner-occupied house/condo value
![Distribution of owner-occupied house/condo value]()
- 75Less than $50,000
- 41$50,000 to $99,999
- 194$100,000 to $149,999
- 51$150,000 to $199,999
- 19$200,000 to $249,999
- 48$250,000 to $299,999
- 67$300,000 to $399,999
- 121$400,000 to $499,999
- 16$500,000 to $749,999
- 84$750,000 to $999,999
- 213$1,000,000 or more

Distribution of rent paid by renters
![Distribution of rent paid by renters]()
- 7$300 to $399
- 23$500 to $599
- 6$600 to $699
- 2$900 to $999
- 76$1,250 to $1,499
- 10$1,500 to $1,999
- 376$2,000 or more

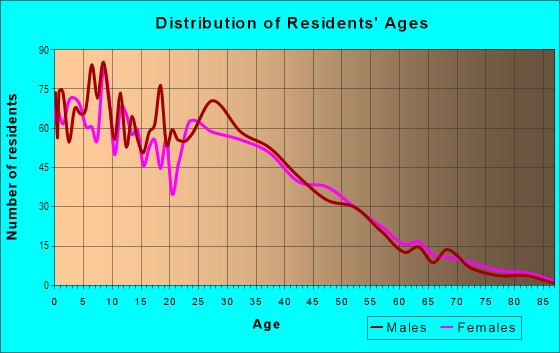
| Males: | 473 |
| Females: | 358 |
Males:
| This neighborhood: | 37.4 years |
| Whole city: | 37.6 years |
| This neighborhood: | 45.6 years |
| Whole city: | 39.1 years |
Average household size:
| Edenvale: | 3.0 people |
| San Jose: | 2.9 people |
Percentage of family households:
| Edenvale: | 57.7% |
| San Jose: | 49.9% |
| Here: | 63.9% |
| San Jose: | 53.0% |
Percentage of married-couple families with children (among all households):
| Edenvale: | 35.6% |
| San Jose: | 25.8% |
Percentage of single-mother households (among all households):
| Edenvale: | 8.2% |
| San Jose: | 5.2% |
Percentage of never married males 15 years old and over:
Percentage of never married females 15 years old and over:
| Edenvale: | 16.8% |
| San Jose: | 20.9% |
Percentage of never married females 15 years old and over:
| Edenvale: | 8.1% |
| city: | 16.7% |
Percentage of people that speak English not well or not at all:
| Edenvale: | 0.0% |
| San Jose: | 11.4% |
Percentage of people born in this state:
Percentage of people born in another U.S. state:
Percentage of native residents but born outside the U.S.:
Percentage of foreign born residents:
| Here: | 43.1% |
| San Jose: | 46.1% |
Percentage of people born in another U.S. state:
| Edenvale: | 15.8% |
| San Jose: | 10.4% |
Percentage of native residents but born outside the U.S.:
| Here: | 2.5% |
| city: | 1.7% |
Percentage of foreign born residents:
| Here: | 38.6% |
| San Jose: | 41.8% |
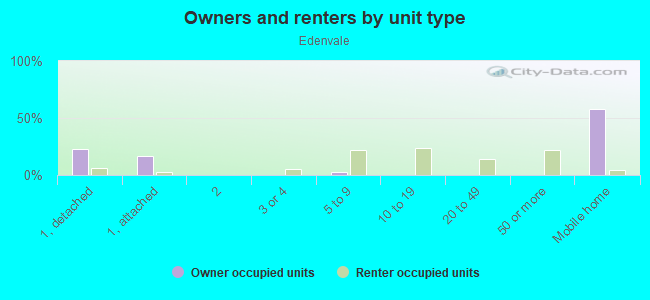
Owner-occupied
Renter-occupied

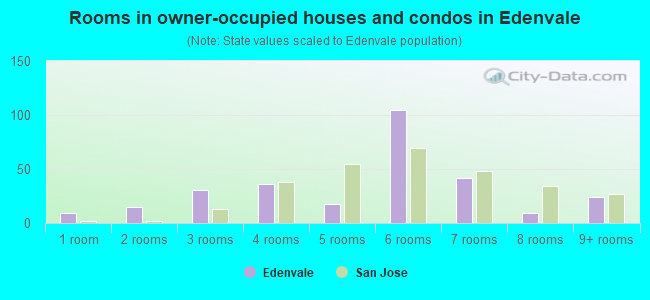
- Rooms in owner-occupied houses and condos in Edenvale
- 91 room
- 152 rooms
- 313 rooms
- 364 rooms
- 185 rooms
- 1056 rooms
- 427 rooms
- 98 rooms
- 249+ rooms
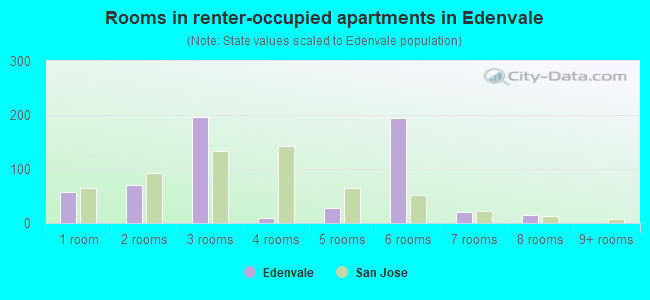
- Rooms in renter-occupied apartments in Edenvale
- 581 room
- 702 rooms
- 1963 rooms
- 104 rooms
- 285 rooms
- 1956 rooms
- 217 rooms
- 148 rooms
- 09+ rooms
Owner-occupied
Renter-occupied
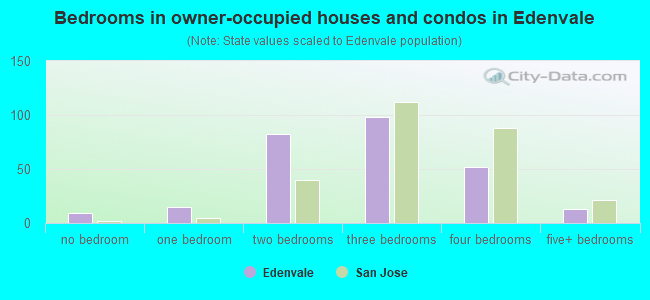
- Bedrooms in owner-occupied houses and condos in Edenvale
- 9no bedroom
- 151 bedroom
- 822 bedrooms
- 983 bedrooms
- 524 bedrooms
- 135+ bedrooms
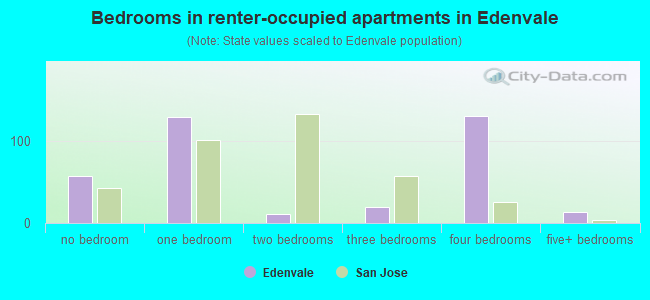
- Bedrooms in renter-occupied apartments in Edenvale
- 58no bedroom
- 1291 bedroom
- 112 bedrooms
- 203 bedrooms
- 1314 bedrooms
- 145+ bedrooms
Average number of cars or other vehicles available in houses/condos:
Average number of cars or other vehicles available in apartments:
| This neighborhood: | 2.0 |
| San Jose: | 2.3 |
Average number of cars or other vehicles available in apartments:
| Here: | 2.4 |
| city: | 1.6 |
Percentage of units with a mortgage:
| Edenvale: | 86.1% |
| San Jose: | 66.9% |
Housing prices:
- Average estimated value of detached houses in 2022 (49.5% of all units):
Edenvale: $1,121,549 San Jose: $1,532,815
- Average estimated value of mobile home in 2022 (116.2% of all units):
Edenvale: $191,122 San Jose: $237,683
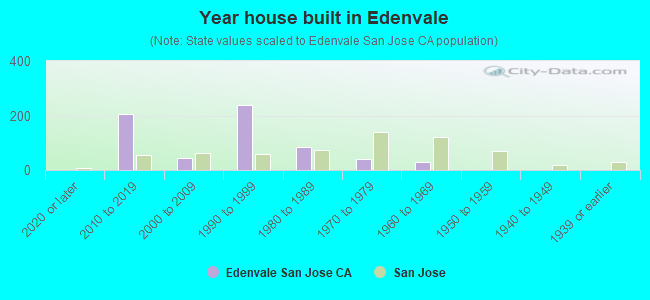
- Year house built in Edenvale
- 02020 or later
- 2042010 to 2019
- 432000 to 2009
- 2381990 to 1999
- 831980 to 1989
- 411970 to 1979
- 281960 to 1969
- 01950 to 1959
- 01940 to 1949
- 01939 or earlier
City-data.com crime index for city in 2020 (higher means more crime):
| City: | 268.4 |
| U.S. average: | 219.5 |
Travel time to work (commute)
![Travel time to work (commute)]()
- 56Less than 5 minutes
- 95 to 9 minutes
- 1310 to 14 minutes
- 1815 to 19 minutes
- 2620 to 24 minutes
- 1225 to 29 minutes
- 3230 to 34 minutes
- 535 to 39 minutes
- 940 to 44 minutes
- 9045 to 59 minutes
- 2860 to 89 minutes
- 590 or more minutes

Means of transportation to work
![Means of transportation to work]()
- 61.2%316Drove a car alone
- 15.9%82Carpooled
- 1.9%10Bus
- 3.1%16Long-distance train or commuter rail
- 2.1%11Taxi
- 0.2%1Motorcycle
- 1.2%6Bicycle
- 0.4%2Walked
- 0.2%1Other means
- 20.3%105Worked at home

Time leaving home to go to work
![Time leaving home to go to work]()
- 1012:00 a.m. to 4:59 a.m.
- 25:00 a.m. to 5:29 a.m.
- 85:30 a.m. to 5:59 a.m.
- 176:00 a.m. to 6:29 a.m.
- 226:30 a.m. to 6:59 a.m.
- 257:00 a.m. to 7:29 a.m.
- 237:30 a.m. to 7:59 a.m.
- 278:00 a.m. to 8:29 a.m.
- 168:30 a.m. to 8:59 a.m.
- 209:00 a.m. to 9:59 a.m.
- 510:00 a.m. to 10:59 a.m.
- 311:00 a.m. to 11:59 a.m.
- 1212:00 p.m. to 3:59 p.m.
- 44:00 p.m. to 11:59 p.m.

Occupations of males:
- Percentage of males in management occupations (except farmers):
Here: 7.1% city: 13.0%
- Percentage of males in business and financial operations occupations:
Here: 9.4% city: 4.6%
- Percentage of males in computer and mathematical occupations:
Here: 7.7% city: 13.6%
- Percentage of males in architecture and engineering occupations:
Here: 24.6% city: 10.2%
- Percentage of males in education, training, and library occupations:
Here: 9.4% city: 2.8%
- Percentage of males in arts, design, entertainment, sports, and media occupations:
Here: 4.4% city: 1.8%
- Percentage of males in healthcare practitioners and technical occupations:
Here: 4.0% city: 2.0%
- Percentage of males in service occupations:
Here: 3.4% city: 12.7%
- Percentage of males in sales and office occupations:
Here: 9.6% city: 12.8%
- Percentage of males in construction, extraction, and maintenance occupations:
Here: 1.5% city: 7.8%
- Percentage of males in production occupations:
Here: 1.5% city: 5.5%
- Percentage of males in transportation occupations:
Here: 7.8% city: 3.6%
- Percentage of males in material moving occupations:
Here: 1.2% city: 3.1%
Occupations of females:
- Percentage of females in business and financial operations occupations:
Here: 8.0% city: 8.6%
- Percentage of females in architecture and engineering occupations:
Here: 7.3% city: 2.8%
- Percentage of females in education, training, and library occupations:
Here: 18.1% city: 8.1%
- Percentage of females in arts, design, entertainment, sports, and media occupations:
Here: 7.3% city: 2.0%
- Percentage of females in healthcare practitioners and technical occupations:
Here: 30.8% city: 6.8%
- Percentage of females in service occupations:
Here: 4.7% city: 21.7%
- Percentage of females in sales and office occupations:
Here: 22.8% city: 22.0%
- Percentage of females in material moving occupations:
Here: 1.9% city: 1.5%
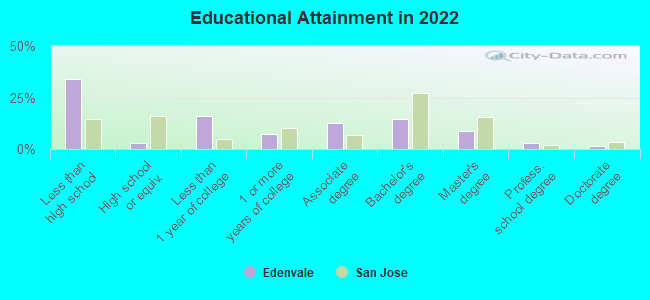
Education in this neighborhood (subdivision or community):
- Percentage of people 3 years and older in K-12 schools:
Edenvale: 52.8% San Jose: 16.1%
- Percentage of people 3 years and older in undergraduate colleges:
Edenvale: 3.9% San Jose: 6.5%
- Percentage of people 3 years and older in grad. or professional schools:
Edenvale: 5.8% San Jose: 2.0%
- Percentage of students K-12 enrolled in private schools:
Edenvale: 41.3% San Jose: 14.9%
Percentage of population below poverty level:
| Edenvale: | 15.6% |
| San Jose: | 9.0% |
Median year owner moved in (as recorded in 2022):
Median year renter moved in (as recorded in 2022):
| Edenvale: | 2010 |
| San Jose: | 2008 |
Median year renter moved in (as recorded in 2022):
| Edenvale: | 2011 |
| San Jose: | 2020 |
Percentage of married-couple families with both working:
| Edenvale: | 86.2% |
| San Jose: | 72.5% |
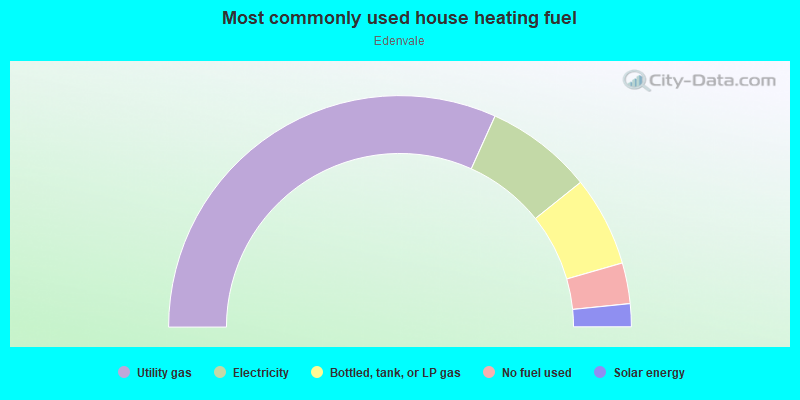
- 63.5%Utility gas
- 15.0%Electricity
- 12.6%Bottled, tank, or LP gas
- 5.7%No fuel used
- 3.2%Solar energy
Limited-access highways (interstate or state) in this neighborhood:
US Hwy 101
Length: 0.38 miles
Directions: N-S, SE-NW
Directions: N-S, SE-NW
Roads and streets:
Azucar Ave
Length: 0.60 miles
Directions: E-W, N-S, SW-NE
Address range: 50 to 299
Directions: E-W, N-S, SW-NE
Address range: 50 to 299
Whirlaway Dr
Length: 0.57 miles
Direction: E-W
Address range: 100 to 499
Direction: E-W
Address range: 100 to 499
Grey Ghost Ave
Length: 0.53 miles
Directions: E-W, SE-NW, SW-NE
Address range: 250 to 499
Directions: E-W, SE-NW, SW-NE
Address range: 250 to 499
Carryback Ave
Length: 0.53 miles
Directions: N-S, SE-NW, SW-NE
Address range: 5200 to 5599
Directions: N-S, SE-NW, SW-NE
Address range: 5200 to 5599
Roeder Rd
Length: 0.47 miles
Directions: N-S, SE-NW
Address range: 4900 to 5245
Directions: N-S, SE-NW
Address range: 4900 to 5245
Bendorf Dr
Length: 0.40 miles
Directions: E-W, N-S, SE-NW
Address range: 100 to 399
Directions: E-W, N-S, SE-NW
Address range: 100 to 399
Cll Aloudra
Length: 0.38 miles
Directions: E-W, N-S, SW-NE
Directions: E-W, N-S, SW-NE
Cll Cuervo
Length: 0.37 miles
Directions: E-W, N-S, SE-NW, SW-NE
Directions: E-W, N-S, SE-NW, SW-NE
Roundtable Dr
Length: 0.34 miles
Direction: E-W
Address range: 100 to 299
Direction: E-W
Address range: 100 to 299
Great Oaks Dr
Length: 0.30 miles
Direction: N-S
Address range: 5200 to 5399
Direction: N-S
Address range: 5200 to 5399
Discovery Ave
Length: 0.29 miles
Direction: N-S
Address range: 5100 to 5299
Direction: N-S
Address range: 5100 to 5299
Driveway
Length: 0.28 miles
Direction: N-S
Direction: N-S
Cll Pintada
Length: 0.24 miles
Directions: N-S, SE-NW, SW-NE
Directions: N-S, SE-NW, SW-NE
Pharlap Ave
Length: 0.23 miles
Directions: N-S, SE-NW
Address range: 5000 to 5299
Directions: N-S, SE-NW
Address range: 5000 to 5299
Indian Broom Dr
Length: 0.21 miles
Direction: E-W
Address range: 300 to 399
Direction: E-W
Address range: 300 to 399
Gallant Fox Ave
Length: 0.20 miles
Directions: N-S, SE-NW, SW-NE
Address range: 5100 to 5299
Directions: N-S, SE-NW, SW-NE
Address range: 5100 to 5299
Swaps Dr
Length: 0.19 miles
Direction: E-W
Address range: 300 to 399
Direction: E-W
Address range: 300 to 399
Kayak Dr
Length: 0.16 miles
Direction: E-W
Address range: 100 to 199
Direction: E-W
Address range: 100 to 199
Seabiscuit Dr
Length: 0.16 miles
Direction: E-W
Address range: 200 to 299
Direction: E-W
Address range: 200 to 299
Stagehand Dr
Length: 0.16 miles
Directions: E-W, SE-NW
Address range: 200 to 299
Directions: E-W, SE-NW
Address range: 200 to 299
Dogaway Dr
Length: 0.16 miles
Directions: E-W, SE-NW, SW-NE
Address range: 100 to 199
Directions: E-W, SE-NW, SW-NE
Address range: 100 to 199
Cll Gaviota
Length: 0.15 miles
Directions: E-W, N-S, SE-NW, SW-NE
Directions: E-W, N-S, SE-NW, SW-NE
War Admiral Ave
Length: 0.13 miles
Directions: E-W, SW-NE
Address range: 350 to 449
Directions: E-W, SW-NE
Address range: 350 to 449
Alysheba Ave
Length: 0.10 miles
Directions: E-W, SW-NE
Address range: 200 to 299
Directions: E-W, SW-NE
Address range: 200 to 299
Danze Dr
Length: 0.09 miles
Direction: E-W
Address range: 100 to 299
Direction: E-W
Address range: 100 to 299
New St
Length: 0.07 miles
Directions: E-W, N-S, SE-NW
Directions: E-W, N-S, SE-NW
Cll Buho
Length: 0.05 miles
Direction: E-W
Direction: E-W
Mitchell Ln
Length: 0.05 miles
Direction: N-S
Address range: 5200 to 5299
Direction: N-S
Address range: 5200 to 5299
Roeder Ct
Length: 0.05 miles
Direction: E-W
Address range: 300 to 399
Direction: E-W
Address range: 300 to 399
Armed Ct
Length: 0.04 miles
Direction: E-W
Address range: 300 to 399
Direction: E-W
Address range: 300 to 399
Branham Ln E
Length: 0.04 miles
Direction: SE-NW
Address range: 450 to 453
Direction: SE-NW
Address range: 450 to 453
Cll Galondrina
Length: 0.04 miles
Directions: E-W, SE-NW
Directions: E-W, SE-NW