East Vancouver neighborhood in Vancouver, Washington (WA), 98660, 98663 detailed profile
Settings
X

Business Search - 14 Million verified businesses
Area: 0.200 square miles
Population: 1,279
Population density:
| East Vancouver: | 6,402 people per square mile |
| Vancouver: | 4,545 people per square mile |

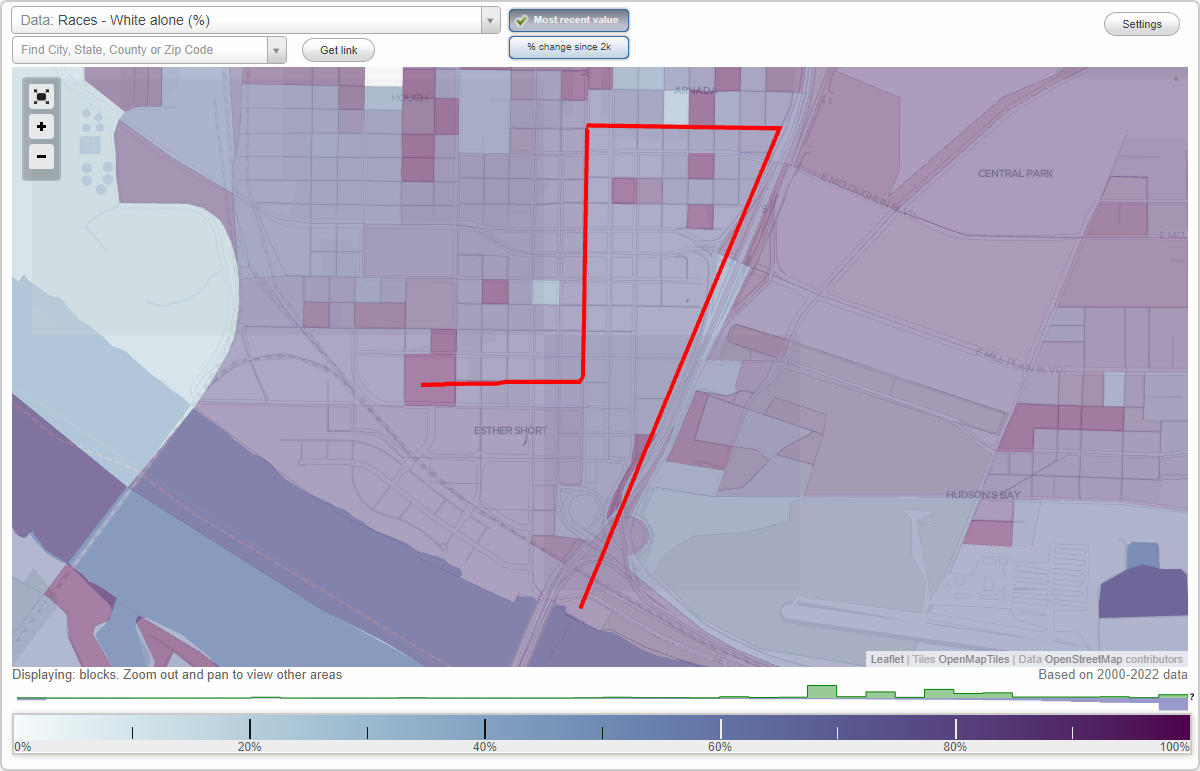
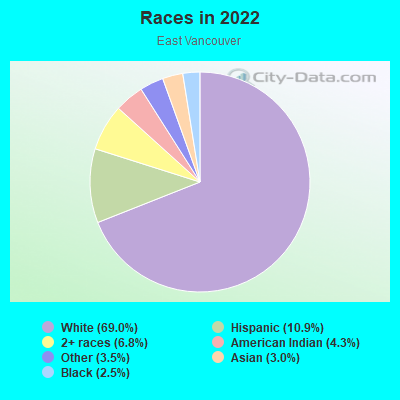
- 89869.0%White
- 14210.9%Hispanic or Latino
- 886.8%Two or more races
- 564.3%American Indian
- 463.5%Some other race
- 393.0%Asian
- 322.5%Black
Median household income in 2022:
| East Vancouver: | $57,945 |
| Vancouver: | $76,799 |
Distribution of median household income
![Distribution of median household income]()
- 18Less than $10,000
- 115$10,000 to $19,999
- 38$20,000 to $29,999
- 71$30,000 to $39,999
- 69$40,000 to $49,999
- 35$50,000 to $59,999
- 143$60,000 to $74,999
- 73$75,000 to $99,999
- 60$100,000 to $124,999
- 46$125,000 to $149,999
- 34$150,000 to $199,999
- 71$200,000 or more

Distribution of owner-occupied house/condo value
![Distribution of owner-occupied house/condo value]()
- 3$150,000 to $199,999
- 44$200,000 to $249,999
- 17$250,000 to $299,999
- 26$300,000 to $399,999
- 48$400,000 to $499,999
- 47$500,000 to $749,999
- 14$750,000 to $999,999
- 9$1,000,000 or more

Distribution of rent paid by renters
![Distribution of rent paid by renters]()
- 14$100 to $199
- 35$200 to $299
- 6$300 to $399
- 21$400 to $499
- 25$500 to $599
- 19$600 to $699
- 11$700 to $799
- 22$800 to $899
- 24$900 to $999
- 170$1,000 to $1,249
- 126$1,250 to $1,499
- 143$1,500 to $1,999
- 79$2,000 or more

Median rent in 2022:
| East Vancouver: | $1,300 |
| Vancouver: | $1,452 |
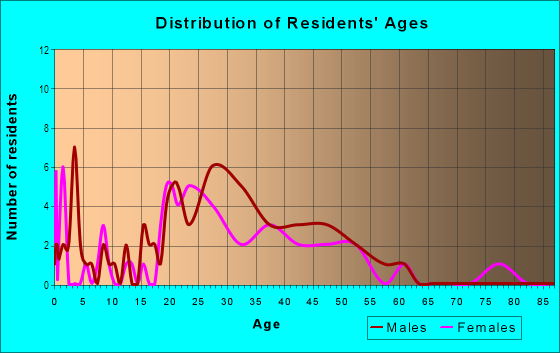
| Males: | 710 |
| Females: | 569 |
Males:
| This neighborhood: | 36.4 years |
| Whole city: | 34.7 years |
| This neighborhood: | 47.9 years |
| Whole city: | 39.9 years |
Average household size:
| East Vancouver: | 1.6 people |
| Vancouver: | 2.4 people |
Percentage of family households:
| East Vancouver: | 33.2% |
| Vancouver: | 40.5% |
| Here: | 19.3% |
| Vancouver: | 40.2% |
Percentage of married-couple families with children (among all households):
| East Vancouver: | 26.4% |
| Vancouver: | 27.2% |
Percentage of single-mother households (among all households):
| East Vancouver: | 12.8% |
| Vancouver: | 9.7% |
Percentage of never married males 15 years old and over:
Percentage of never married females 15 years old and over:
| East Vancouver: | 31.8% |
| Vancouver: | 18.8% |
Percentage of never married females 15 years old and over:
| East Vancouver: | 16.8% |
| city: | 17.6% |
Percentage of people that speak English not well or not at all:
| East Vancouver: | 0.5% |
| Vancouver: | 4.9% |
Percentage of people born in this state:
Percentage of people born in another U.S. state:
Percentage of native residents but born outside the U.S.:
Percentage of foreign born residents:
| Here: | 29.1% |
| Vancouver: | 30.3% |
Percentage of people born in another U.S. state:
| East Vancouver: | 62.3% |
| Vancouver: | 54.5% |
Percentage of native residents but born outside the U.S.:
| Here: | 0.4% |
| city: | 1.4% |
Percentage of foreign born residents:
| Here: | 8.2% |
| Vancouver: | 13.8% |
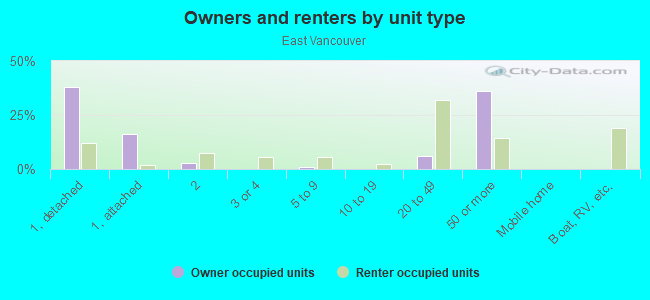
Owner-occupied
Renter-occupied

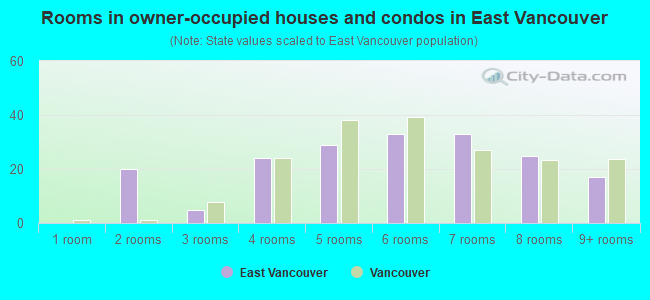
- Rooms in owner-occupied houses and condos in East Vancouver
- 01 room
- 202 rooms
- 53 rooms
- 244 rooms
- 295 rooms
- 336 rooms
- 337 rooms
- 258 rooms
- 179+ rooms
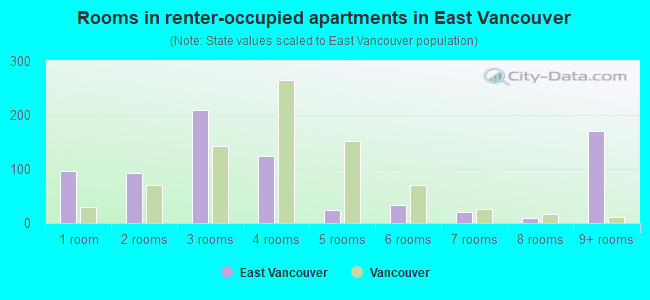
- Rooms in renter-occupied apartments in East Vancouver
- 961 room
- 932 rooms
- 2103 rooms
- 1244 rooms
- 255 rooms
- 336 rooms
- 217 rooms
- 108 rooms
- 1719+ rooms
Owner-occupied
Renter-occupied
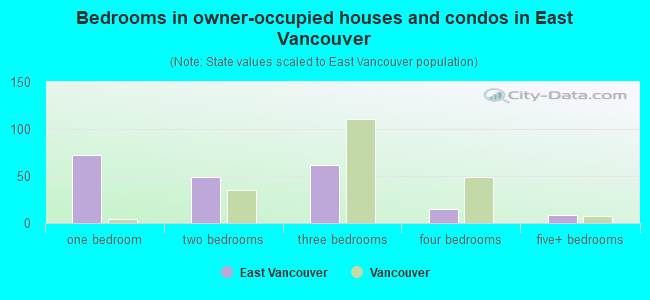
- Bedrooms in owner-occupied houses and condos in East Vancouver
- 0no bedroom
- 721 bedroom
- 492 bedrooms
- 623 bedrooms
- 154 bedrooms
- 85+ bedrooms
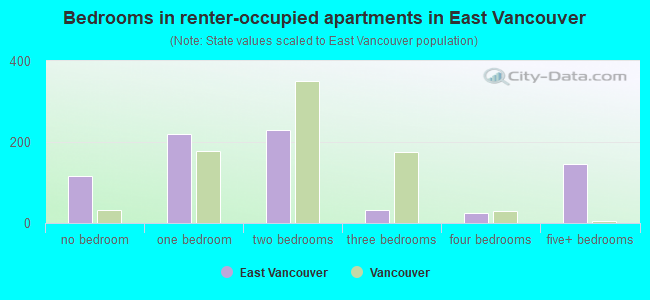
- Bedrooms in renter-occupied apartments in East Vancouver
- 115no bedroom
- 2201 bedroom
- 2292 bedrooms
- 333 bedrooms
- 254 bedrooms
- 1465+ bedrooms
Average number of cars or other vehicles available in houses/condos:
Average number of cars or other vehicles available in apartments:
| This neighborhood: | 1.9 |
| Vancouver: | 2.2 |
Average number of cars or other vehicles available in apartments:
| Here: | 1.2 |
| city: | 1.4 |
Percentage of units with a mortgage:
| East Vancouver: | 62.6% |
| Vancouver: | 64.8% |
Average estimated '22 value of housing units in 5-or-more-unit structures (14.9% of all units):
| East Vancouver: | $333,156 |
| Washington: | $503,183 |
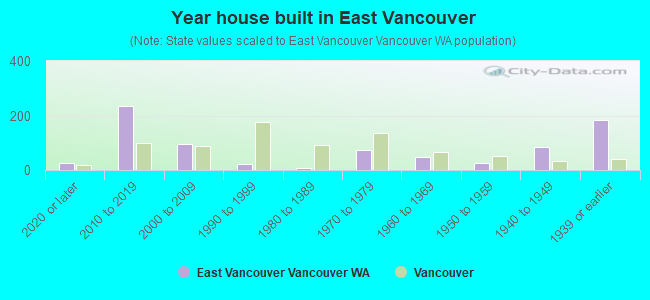
- Year house built in East Vancouver
- 252020 or later
- 2342010 to 2019
- 972000 to 2009
- 221990 to 1999
- 81980 to 1989
- 721970 to 1979
- 481960 to 1969
- 271950 to 1959
- 841940 to 1949
- 1821939 or earlier
City-data.com crime index for city in 2020 (higher means more crime):
| City: | 339.4 |
| U.S. average: | 219.5 |
Travel time to work (commute)
![Travel time to work (commute)]()
- 30Less than 5 minutes
- 855 to 9 minutes
- 11810 to 14 minutes
- 10715 to 19 minutes
- 5820 to 24 minutes
- 2725 to 29 minutes
- 5730 to 34 minutes
- 1235 to 39 minutes
- 1340 to 44 minutes
- 1145 to 59 minutes
- 1060 to 89 minutes
- 2690 or more minutes

Means of transportation to work
![Means of transportation to work]()
- 62.4%523Drove a car alone
- 4.3%36Carpooled
- 2.7%23Bus
- 0.7%6Subway or elevated rail
- 0.2%2Light rail, streetcar or trolley
- 1.0%8Motorcycle
- 13.7%115Bicycle
- 11.6%97Walked
- 0.7%6Other means
- 17.3%145Worked at home

Time leaving home to go to work
![Time leaving home to go to work]()
- 4712:00 a.m. to 4:59 a.m.
- 95:00 a.m. to 5:29 a.m.
- 285:30 a.m. to 5:59 a.m.
- 516:00 a.m. to 6:29 a.m.
- 446:30 a.m. to 6:59 a.m.
- 697:00 a.m. to 7:29 a.m.
- 787:30 a.m. to 7:59 a.m.
- 808:00 a.m. to 8:29 a.m.
- 318:30 a.m. to 8:59 a.m.
- 349:00 a.m. to 9:59 a.m.
- 3610:00 a.m. to 10:59 a.m.
- 511:00 a.m. to 11:59 a.m.
- 2312:00 p.m. to 3:59 p.m.
- 174:00 p.m. to 11:59 p.m.

Occupations of males:
- Percentage of males in management occupations (except farmers):
Here: 26.6% city: 9.6%
- Percentage of males in business and financial operations occupations:
Here: 4.6% city: 5.2%
- Percentage of males in computer and mathematical occupations:
Here: 8.8% city: 4.9%
- Percentage of males in architecture and engineering occupations:
Here: 3.5% city: 3.6%
- Percentage of males in legal occupations:
Here: 1.1% city: 0.5%
- Percentage of males in education, training, and library occupations:
Here: 4.4% city: 2.4%
- Percentage of males in arts, design, entertainment, sports, and media occupations:
Here: 4.1% city: 1.7%
- Percentage of males in healthcare practitioners and technical occupations:
Here: 4.5% city: 2.3%
- Percentage of males in service occupations:
Here: 14.2% city: 12.4%
- Percentage of males in sales and office occupations:
Here: 16.4% city: 15.7%
- Percentage of males in construction, extraction, and maintenance occupations:
Here: 3.8% city: 11.5%
- Percentage of males in production occupations:
Here: 1.2% city: 8.2%
- Percentage of males in transportation occupations:
Here: 3.7% city: 8.9%
- Percentage of males in material moving occupations:
Here: 1.4% city: 5.8%
Occupations of females:
- Percentage of females in management occupations (except farmers):
Here: 13.7% city: 8.2%
- Percentage of females in business and financial operations occupations:
Here: 7.5% city: 7.3%
- Percentage of females in architecture and engineering occupations:
Here: 6.3% city: 0.7%
- Percentage of females in life, physical, and social science occupations:
Here: 10.9% city: 1.0%
- Percentage of females in community and social services occupations:
Here: 1.7% city: 1.9%
- Percentage of females in legal occupations:
Here: 1.7% city: 1.0%
- Percentage of females in education, training, and library occupations:
Here: 3.7% city: 6.5%
- Percentage of females in arts, design, entertainment, sports, and media occupations:
Here: 2.0% city: 2.2%
- Percentage of females in healthcare practitioners and technical occupations:
Here: 7.2% city: 9.1%
- Percentage of females in service occupations:
Here: 20.2% city: 24.5%
- Percentage of females in sales and office occupations:
Here: 15.4% city: 26.7%
- Percentage of females in production occupations:
Here: 1.7% city: 3.4%
- Percentage of females in material moving occupations:
Here: 7.1% city: 2.3%
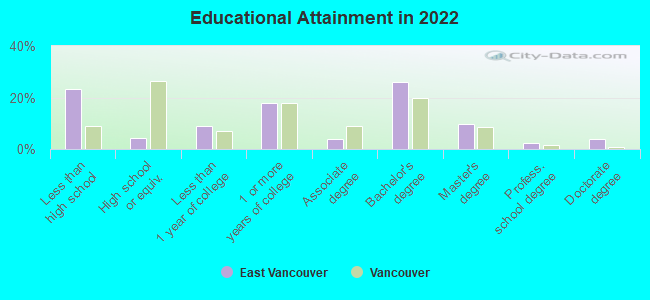
Education in this neighborhood (subdivision or community):
- Percentage of people 3 years and older in K-12 schools:
East Vancouver: 12.2% Vancouver: 16.4%
- Percentage of people 3 years and older in undergraduate colleges:
East Vancouver: 3.8% Vancouver: 4.1%
- Percentage of people 3 years and older in grad. or professional schools:
East Vancouver: 4.3% Vancouver: 1.0%
- Percentage of students K-12 enrolled in private schools:
East Vancouver: 47.4% Vancouver: 6.8%
Percentage of population below poverty level:
| East Vancouver: | 13.5% |
| Vancouver: | 10.0% |
Median year owner moved in (as recorded in 2022):
| East Vancouver: | 2011 |
| Vancouver: | 2012 |
Percentage of married-couple families with both working:
| East Vancouver: | 111.6% |
| Vancouver: | 55.7% |
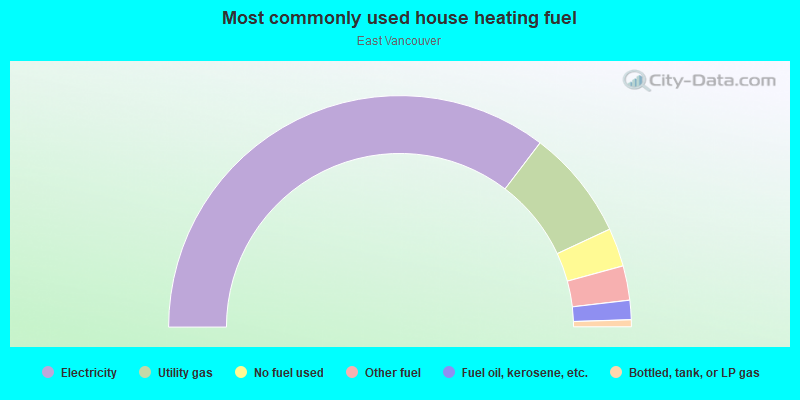
- 70.8%Electricity
- 15.4%Utility gas
- 5.4%No fuel used
- 4.8%Other fuel
- 2.7%Fuel oil, kerosene, etc.
- 1.0%Bottled, tank, or LP gas
Limited-access highways (interstate or state) in this neighborhood:
I- 5
Length: 0.14 miles
Direction: SW-NE
Direction: SW-NE
Roads and streets:
C St
Length: 0.71 miles
Directions: N-S, SW-NE
Address range: 600 to 1899
Directions: N-S, SW-NE
Address range: 600 to 1899
Broadway St
Length: 0.70 miles
Direction: N-S
Address range: 500 to 1899
Direction: N-S
Address range: 500 to 1899
E 19th St
Length: 0.49 miles
Direction: E-W
Address range: 200 to 849
Direction: E-W
Address range: 200 to 849
E McLoughlin Blvd
Length: 0.46 miles
Directions: E-W, SW-NE
Address range: 200 to 799
Directions: E-W, SW-NE
Address range: 200 to 799
E 15th St
Length: 0.46 miles
Directions: E-W, SE-NW, SW-NE
Address range: 200 to 699
Directions: E-W, SE-NW, SW-NE
Address range: 200 to 699
E 17th St
Length: 0.43 miles
Direction: E-W
Address range: 200 to 799
Direction: E-W
Address range: 200 to 799
E 16th St
Length: 0.39 miles
Direction: E-W
Address range: 200 to 708
Direction: E-W
Address range: 200 to 708
D St
Length: 0.37 miles
Direction: N-S
Address range: 1500 to 1899
Direction: N-S
Address range: 1500 to 1899
E Mill Plain Blvd
Length: 0.30 miles
Direction: E-W
Address range: 200 to 499
Direction: E-W
Address range: 200 to 499
E St
Length: 0.29 miles
Directions: E-W, N-S, SE-NW, SW-NE
Address range: 1500 to 1899
Directions: E-W, N-S, SE-NW, SW-NE
Address range: 1500 to 1899
E 12th St
Length: 0.27 miles
Direction: E-W
Address range: 200 to 599
Direction: E-W
Address range: 200 to 599
E 13th St
Length: 0.26 miles
Direction: E-W
Address range: 200 to 549
Direction: E-W
Address range: 200 to 549
I-5
Length: 0.24 miles
Directions: E-W, N-S, SE-NW, SW-NE
Directions: E-W, N-S, SE-NW, SW-NE
E Evergreen Blvd
Length: 0.22 miles
Direction: E-W
Address range: 200 to 499
Direction: E-W
Address range: 200 to 499
F St
Length: 0.21 miles
Direction: N-S
Address range: 1500 to 1899
Direction: N-S
Address range: 1500 to 1899
E 8th St
Length: 0.18 miles
Direction: E-W
Address range: 200 to 399
Direction: E-W
Address range: 200 to 399
Reserve St
Length: 0.17 miles
Directions: N-S, SW-NE
Address range: 400 to 1798
Directions: N-S, SW-NE
Address range: 400 to 1798
G St
Length: 0.16 miles
Direction: N-S
Address range: 1600 to 1899
Direction: N-S
Address range: 1600 to 1899
E 7th St
Length: 0.12 miles
Direction: E-W
Address range: 200 to 349
Direction: E-W
Address range: 200 to 349
E 11th St
Length: 0.08 miles
Direction: E-W
Address range: 200 to 299
Direction: E-W
Address range: 200 to 299
E 6th St
Length: 0.07 miles
Directions: E-W, N-S, SE-NW
Address range: 200 to 299
Directions: E-W, N-S, SE-NW
Address range: 200 to 299
W Reserve St
Length: 0.06 miles
Directions: E-W, SW-NE
Address range: 1800 to 1899
Directions: E-W, SW-NE
Address range: 1800 to 1899