East Northside neighborhood in San Jose, California (CA), 95112 detailed profile
Settings
X

Business Search - 14 Million verified businesses
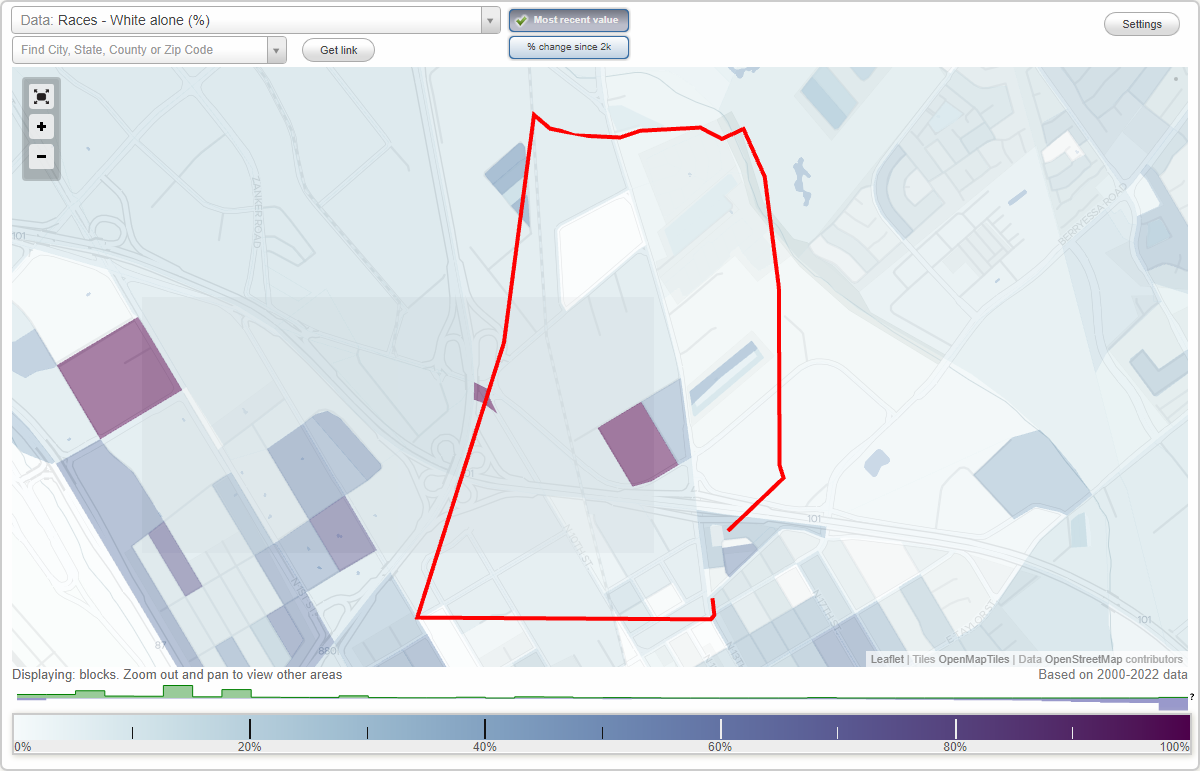
Area: 0.662 square miles
Population: 11,209
Population density:
| East Northside: | 16,933 people per square mile |
| San Jose: | 5,554 people per square mile |

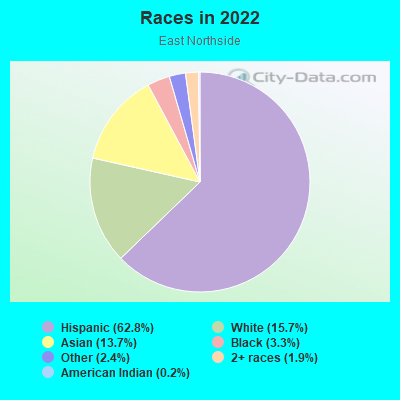
- 7,36762.8%Hispanic or Latino
- 1,83715.7%White
- 1,61013.7%Asian
- 3893.3%Black
- 2812.4%Some other race
- 2251.9%Two or more races
- 260.2%American Indian
Distribution of median household income
![Distribution of median household income]()
- 168Less than $10,000
- 438$10,000 to $19,999
- 395$20,000 to $29,999
- 530$30,000 to $39,999
- 354$40,000 to $49,999
- 232$50,000 to $59,999
- 193$60,000 to $74,999
- 132$75,000 to $99,999
- 386$100,000 to $124,999
- 288$125,000 to $149,999
- 362$150,000 to $199,999
- 760$200,000 or more

Distribution of owner-occupied house/condo value
![Distribution of owner-occupied house/condo value]()
- 217$100,000 to $149,999
- 17$400,000 to $499,999
- 179$500,000 to $749,999
- 782$750,000 to $999,999
- 659$1,000,000 or more

Distribution of rent paid by renters
![Distribution of rent paid by renters]()
- 188$300 to $399
- 75$500 to $599
- 17$600 to $699
- 51$800 to $899
- 71$900 to $999
- 228$1,000 to $1,249
- 196$1,250 to $1,499
- 587$1,500 to $1,999
- 842$2,000 or more

Median rent in 2022:
| East Northside: | $2,010 |
| San Jose: | $2,001 |
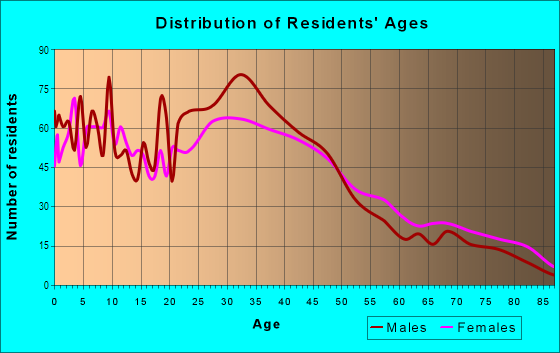
| Males: | 5,652 |
| Females: | 5,556 |
Males:
| This neighborhood: | 33.2 years |
| Whole city: | 37.6 years |
| This neighborhood: | 34.0 years |
| Whole city: | 39.1 years |
Average household size:
| East Northside: | 16.2 people |
| San Jose: | 2.9 people |
Percentage of family households:
| East Northside: | 51.4% |
| San Jose: | 49.9% |
| Here: | 53.4% |
| San Jose: | 53.0% |
Percentage of married-couple families with children (among all households):
| East Northside: | 19.7% |
| San Jose: | 25.8% |
Percentage of single-mother households (among all households):
| East Northside: | 10.1% |
| San Jose: | 5.2% |
Percentage of never married males 15 years old and over:
Percentage of never married females 15 years old and over:
| East Northside: | 25.3% |
| San Jose: | 20.9% |
Percentage of never married females 15 years old and over:
| East Northside: | 19.2% |
| city: | 16.7% |
Percentage of people that speak English not well or not at all:
| East Northside: | 19.3% |
| San Jose: | 11.4% |
Percentage of people born in this state:
Percentage of people born in another U.S. state:
Percentage of native residents but born outside the U.S.:
Percentage of foreign born residents:
| Here: | 44.5% |
| San Jose: | 46.1% |
Percentage of people born in another U.S. state:
| East Northside: | 13.1% |
| San Jose: | 10.4% |
Percentage of native residents but born outside the U.S.:
| Here: | 2.6% |
| city: | 1.7% |
Percentage of foreign born residents:
| Here: | 39.7% |
| San Jose: | 41.8% |
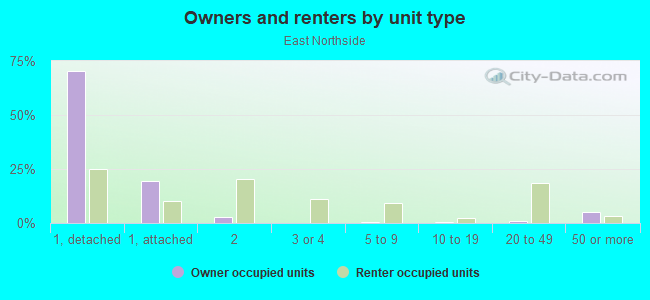
Owner-occupied
Renter-occupied

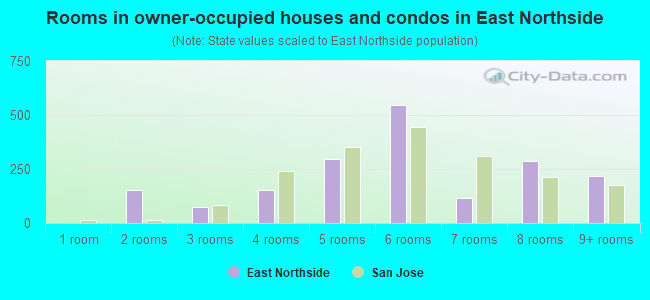
- Rooms in owner-occupied houses and condos in East Northside
- 01 room
- 1552 rooms
- 733 rooms
- 1534 rooms
- 2985 rooms
- 5456 rooms
- 1177 rooms
- 2898 rooms
- 2179+ rooms
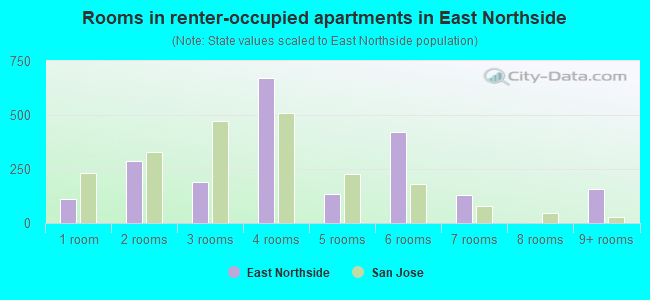
- Rooms in renter-occupied apartments in East Northside
- 1111 room
- 2852 rooms
- 1923 rooms
- 6704 rooms
- 1355 rooms
- 4216 rooms
- 1307 rooms
- 08 rooms
- 1579+ rooms
Owner-occupied
Renter-occupied
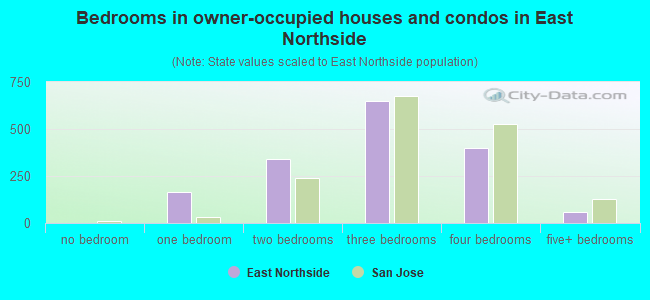
- Bedrooms in owner-occupied houses and condos in East Northside
- 0no bedroom
- 1651 bedroom
- 3392 bedrooms
- 6503 bedrooms
- 4014 bedrooms
- 605+ bedrooms
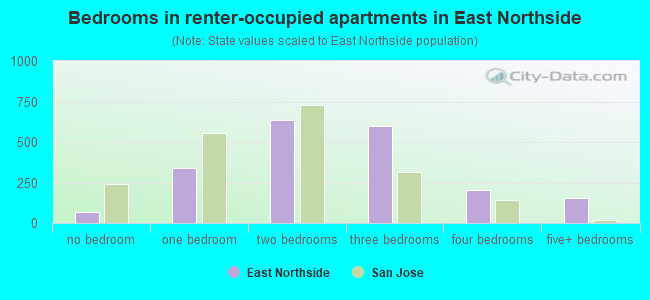
- Bedrooms in renter-occupied apartments in East Northside
- 70no bedroom
- 3381 bedroom
- 6382 bedrooms
- 5963 bedrooms
- 2044 bedrooms
- 1575+ bedrooms
Average number of cars or other vehicles available in houses/condos:
Average number of cars or other vehicles available in apartments:
| This neighborhood: | 2.6 |
| San Jose: | 2.3 |
Average number of cars or other vehicles available in apartments:
| Here: | 1.7 |
| city: | 1.6 |
Percentage of units with a mortgage:
| East Northside: | 77.5% |
| San Jose: | 66.9% |
Average estimated value of detached houses in 2022 (55.1% of all units):
| East Northside: | $1,020,643 |
| San Jose: | $1,532,815 |
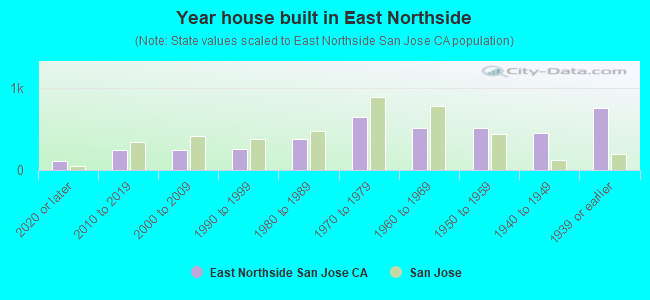
- Year house built in East Northside
- 1072020 or later
- 2382010 to 2019
- 2402000 to 2009
- 2501990 to 1999
- 3751980 to 1989
- 6401970 to 1979
- 5131960 to 1969
- 5091950 to 1959
- 4501940 to 1949
- 7511939 or earlier
City-data.com crime index for city in 2020 (higher means more crime):
| City: | 268.4 |
| U.S. average: | 219.5 |
Travel time to work (commute)
![Travel time to work (commute)]()
- 33Less than 5 minutes
- 1755 to 9 minutes
- 37910 to 14 minutes
- 86015 to 19 minutes
- 60220 to 24 minutes
- 18025 to 29 minutes
- 63030 to 34 minutes
- 15435 to 39 minutes
- 19540 to 44 minutes
- 34345 to 59 minutes
- 37260 to 89 minutes
- 8190 or more minutes

Means of transportation to work
![Means of transportation to work]()
- 62.2%3,631Drove a car alone
- 13.9%811Carpooled
- 2.5%148Bus
- 2.7%159Long-distance train or commuter rail
- 3.0%174Light rail, streetcar or trolley
- 0.2%14Taxi
- 0.9%53Motorcycle
- 7.5%440Bicycle
- 3.2%189Walked
- 2.0%117Other means
- 12.6%737Worked at home

Time leaving home to go to work
![Time leaving home to go to work]()
- 18012:00 a.m. to 4:59 a.m.
- 2015:00 a.m. to 5:29 a.m.
- 1895:30 a.m. to 5:59 a.m.
- 2276:00 a.m. to 6:29 a.m.
- 2796:30 a.m. to 6:59 a.m.
- 7187:00 a.m. to 7:29 a.m.
- 3307:30 a.m. to 7:59 a.m.
- 4768:00 a.m. to 8:29 a.m.
- 2758:30 a.m. to 8:59 a.m.
- 6069:00 a.m. to 9:59 a.m.
- 20310:00 a.m. to 10:59 a.m.
- 2911:00 a.m. to 11:59 a.m.
- 13112:00 p.m. to 3:59 p.m.
- 1204:00 p.m. to 11:59 p.m.

Occupations of males:
- Percentage of males in management occupations (except farmers):
Here: 11.0% city: 13.0%
- Percentage of males in business and financial operations occupations:
Here: 3.2% city: 4.6%
- Percentage of males in computer and mathematical occupations:
Here: 5.5% city: 13.6%
- Percentage of males in architecture and engineering occupations:
Here: 2.4% city: 10.2%
- Percentage of males in legal occupations:
Here: 4.1% city: 0.8%
- Percentage of males in education, training, and library occupations:
Here: 3.0% city: 2.8%
- Percentage of males in arts, design, entertainment, sports, and media occupations:
Here: 5.7% city: 1.8%
- Percentage of males in service occupations:
Here: 21.1% city: 12.7%
- Percentage of males in sales and office occupations:
Here: 8.0% city: 12.8%
- Percentage of males in construction, extraction, and maintenance occupations:
Here: 10.1% city: 7.8%
- Percentage of males in production occupations:
Here: 3.4% city: 5.5%
- Percentage of males in transportation occupations:
Here: 3.0% city: 3.6%
- Percentage of males in material moving occupations:
Here: 13.9% city: 3.1%
Occupations of females:
- Percentage of females in management occupations (except farmers):
Here: 18.0% city: 11.0%
- Percentage of females in business and financial operations occupations:
Here: 6.7% city: 8.6%
- Percentage of females in computer and mathematical occupations:
Here: 3.1% city: 5.4%
- Percentage of females in life, physical, and social science occupations:
Here: 2.8% city: 1.7%
- Percentage of females in community and social services occupations:
Here: 4.3% city: 1.8%
- Percentage of females in education, training, and library occupations:
Here: 4.6% city: 8.1%
- Percentage of females in arts, design, entertainment, sports, and media occupations:
Here: 2.2% city: 2.0%
- Percentage of females in healthcare practitioners and technical occupations:
Here: 1.9% city: 6.8%
- Percentage of females in service occupations:
Here: 26.5% city: 21.7%
- Percentage of females in sales and office occupations:
Here: 16.8% city: 22.0%
- Percentage of females in farming, fishing, and forestry occupations:
Here: 1.5% city: 0.2%
- Percentage of females in construction, extraction, and maintenance occupations:
Here: 2.7% city: 0.2%
- Percentage of females in production occupations:
Here: 7.6% city: 4.0%
Percentage of people 16-64 in Armed Forces:
| East Northside: | 0.1% |
| San Jose: | 0.0% |
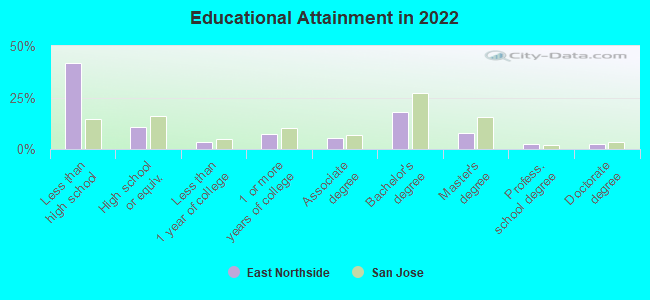
Education in this neighborhood (subdivision or community):
- Percentage of people 3 years and older in K-12 schools:
East Northside: 26.1% San Jose: 16.1%
- Percentage of people 3 years and older in undergraduate colleges:
East Northside: 8.5% San Jose: 6.5%
- Percentage of people 3 years and older in grad. or professional schools:
East Northside: 2.8% San Jose: 2.0%
- Percentage of students K-12 enrolled in private schools:
East Northside: 16.5% San Jose: 14.9%
Percentage of population below poverty level:
| East Northside: | 10.4% |
| San Jose: | 9.0% |
Median year owner moved in (as recorded in 2022):
Median year renter moved in (as recorded in 2022):
| East Northside: | 2007 |
| San Jose: | 2008 |
Median year renter moved in (as recorded in 2022):
| East Northside: | 2015 |
| San Jose: | 2020 |
Percentage of married-couple families with both working:
| East Northside: | 105.1% |
| San Jose: | 72.5% |
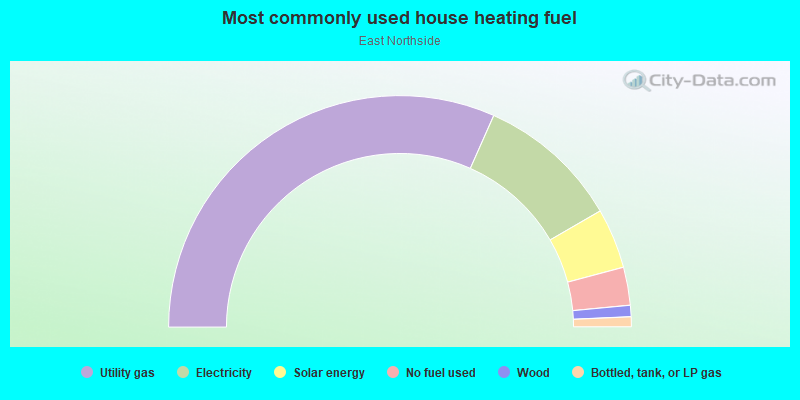
- 63.3%Utility gas
- 20.0%Electricity
- 8.4%Solar energy
- 5.3%No fuel used
- 1.6%Wood
- 1.4%Bottled, tank, or LP gas
Roads and streets:
N 16th St
Length: 1.10 miles
Direction: SE-NW
Address range: 300 to 899
Direction: SE-NW
Address range: 300 to 899
N 17th St
Length: 1.10 miles
Direction: SE-NW
Address range: 300 to 899
Direction: SE-NW
Address range: 300 to 899
N 15th St
Length: 1.10 miles
Direction: SE-NW
Address range: 300 to 899
Direction: SE-NW
Address range: 300 to 899
N 18th St
Length: 0.92 miles
Direction: SE-NW
Address range: 400 to 899
Direction: SE-NW
Address range: 400 to 899
N 19th St
Length: 0.92 miles
Direction: SE-NW
Address range: 400 to 899
Direction: SE-NW
Address range: 400 to 899
N 14th St
Length: 0.92 miles
Direction: SE-NW
Address range: 300 to 899
Direction: SE-NW
Address range: 300 to 899
E Taylor St
Length: 0.76 miles
Directions: E-W, SW-NE
Address range: 650 to 1198
Directions: E-W, SW-NE
Address range: 650 to 1198
N 20th St
Length: 0.74 miles
Directions: N-S, SE-NW
Address range: 400 to 799
Directions: N-S, SE-NW
Address range: 400 to 799
N 21st St
Length: 0.74 miles
Direction: SE-NW
Address range: 400 to 795
Direction: SE-NW
Address range: 400 to 795
Jackson St
Length: 0.70 miles
Directions: E-W, SW-NE
Address range: 650 to 1099
Directions: E-W, SW-NE
Address range: 650 to 1099
E Mission St
Length: 0.62 miles
Direction: SW-NE
Address range: 650 to 1099
Direction: SW-NE
Address range: 650 to 1099
E Empire St
Length: 0.61 miles
Directions: N-S, SW-NE
Address range: 648 to 1099
Directions: N-S, SW-NE
Address range: 648 to 1099
Washington St
Length: 0.58 miles
Direction: SW-NE
Address range: 650 to 1099
Direction: SW-NE
Address range: 650 to 1099
E Hedding St
Length: 0.32 miles
Directions: N-S, SW-NE
Address range: 650 to 949
Directions: N-S, SW-NE
Address range: 650 to 949
Vestal St
Length: 0.21 miles
Directions: E-W, SW-NE
Address range: 650 to 799
Directions: E-W, SW-NE
Address range: 650 to 799
E Julian St
Length: 0.21 miles
Direction: SW-NE
Address range: 650 to 799
Direction: SW-NE
Address range: 650 to 799
Monferino Dr
Length: 0.19 miles
Direction: SE-NW
Address range: 600 to 699
Direction: SE-NW
Address range: 600 to 699
N 22nd St
Length: 0.19 miles
Directions: N-S, SE-NW
Address range: 500 to 599
Directions: N-S, SE-NW
Address range: 500 to 599
N 23rd St
Length: 0.17 miles
Directions: E-W, SE-NW
Address range: 700 to 799
Directions: E-W, SE-NW
Address range: 700 to 799
Terrace Dr
Length: 0.10 miles
Directions: N-S, SE-NW
Address range: 400 to 499
Directions: N-S, SE-NW
Address range: 400 to 499
de Mattei Ct
Length: 0.09 miles
Directions: E-W, SE-NW, SW-NE
Address range: 1000 to 1099
Directions: E-W, SE-NW, SW-NE
Address range: 1000 to 1099
Marianelli Ct
Length: 0.08 miles
Directions: E-W, SW-NE
Address range: 1000 to 1099
Directions: E-W, SW-NE
Address range: 1000 to 1099
N Bayshore Rd W
Length: 0.06 miles
Direction: E-W
Direction: E-W
Glithero Ct
Length: 0.05 miles
Direction: SW-NE
Address range: 1000 to 1099
Direction: SW-NE
Address range: 1000 to 1099
Houghton Ct
Length: 0.05 miles
Direction: SW-NE
Address range: 1000 to 1099
Direction: SW-NE
Address range: 1000 to 1099
Calumet Ct
Length: 0.05 miles
Direction: SW-NE
Address range: 1000 to 1099
Direction: SW-NE
Address range: 1000 to 1099
Other features:
Coyote Crk
Length: 0.17 miles
Directions: N-S, SW-NE
Directions: N-S, SW-NE