East Libbey Avenue neighborhood in Fort Worth, Texas (TX), 76107 detailed profile
Settings
X

Business Search - 14 Million verified businesses
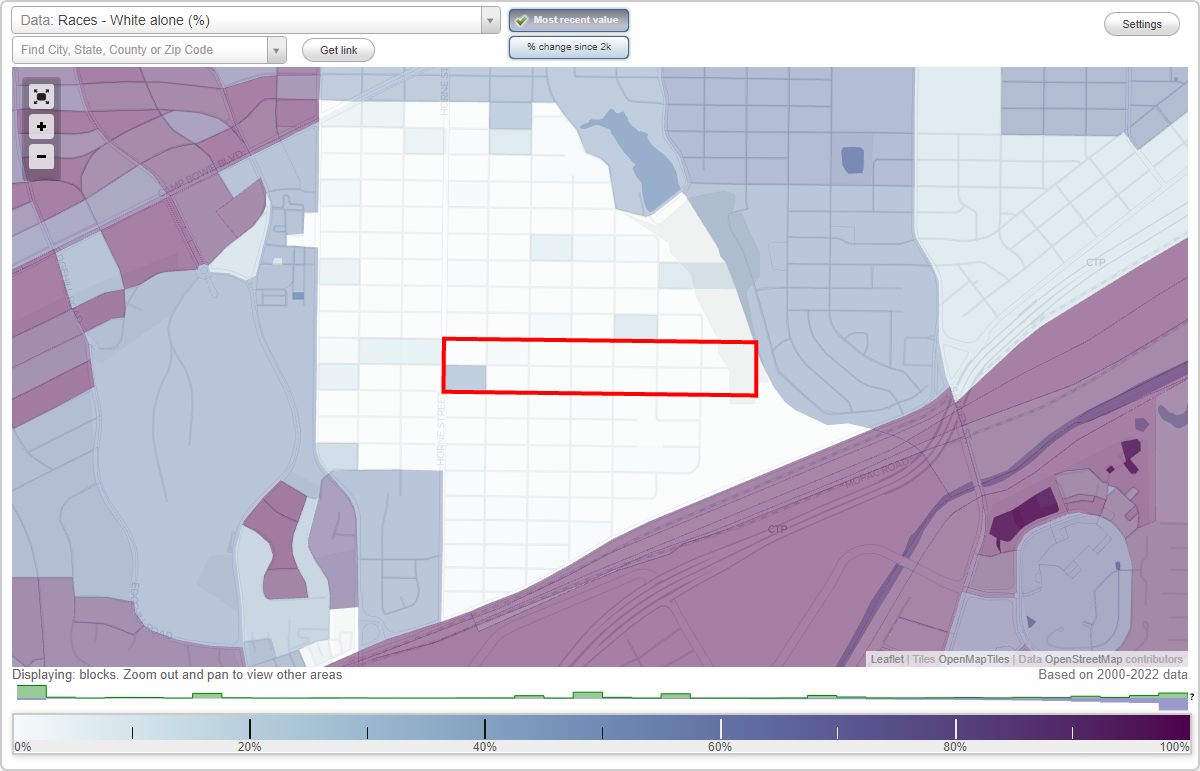
Area: 0.103 square miles
Population: 615
Population density:
| East Libbey Avenue: | 5,971 people per square mile |
| Fort Worth: | 3,286 people per square mile |

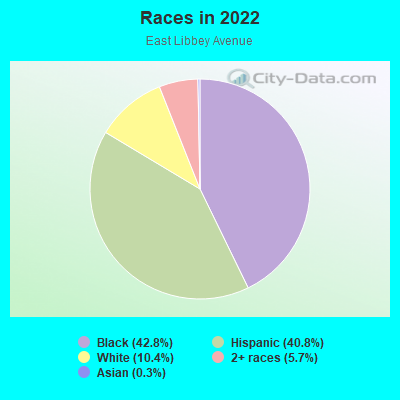
- 26442.8%Black
- 25240.8%Hispanic or Latino
- 6410.4%White
- 355.7%Two or more races
- 20.3%Asian
Median household income in 2022:
| East Libbey Avenue: | $76,294 |
| Fort Worth: | $71,527 |
Distribution of median household income
![Distribution of median household income]()
- 3Less than $10,000
- 26$10,000 to $19,999
- 42$20,000 to $29,999
- 11$30,000 to $39,999
- 26$40,000 to $49,999
- 19$50,000 to $59,999
- 15$60,000 to $74,999
- 31$75,000 to $99,999
- 61$100,000 to $124,999
- 1$150,000 to $199,999
- 3$200,000 or more

Distribution of owner-occupied house/condo value
![Distribution of owner-occupied house/condo value]()
- 14Less than $50,000
- 18$50,000 to $99,999
- 30$100,000 to $149,999
- 19$150,000 to $199,999
- 36$200,000 to $249,999
- 10$250,000 to $299,999
- 1$750,000 to $999,999

Distribution of rent paid by renters
![Distribution of rent paid by renters]()
- 6Less than $100
- 1$100 to $199
- 8$200 to $299
- 4$300 to $399
- 20$400 to $499
- 4$500 to $599
- 19$600 to $699
- 1$700 to $799
- 4$800 to $899
- 20$900 to $999
- 18$1,000 to $1,249
- 2$1,250 to $1,499
- 2$1,500 to $1,999
- 1$2,000 or more

Median rent in 2022:
| East Libbey Avenue: | $870 |
| Fort Worth: | $1,182 |
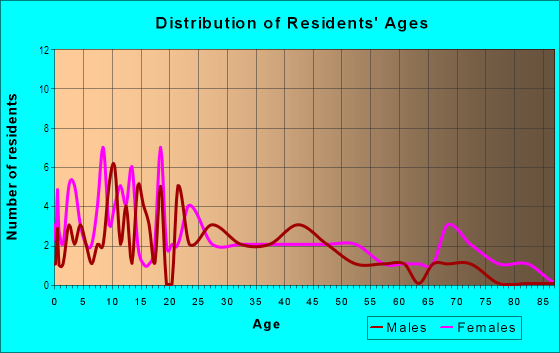
| Males: | 261 |
| Females: | 353 |
Males:
| This neighborhood: | 45.9 years |
| Whole city: | 33.6 years |
| This neighborhood: | 52.4 years |
| Whole city: | 34.8 years |
Average household size:
| East Libbey Avenue: | 3.7 people |
| Fort Worth: | 2.7 people |
Percentage of family households:
| East Libbey Avenue: | 41.7% |
| Fort Worth: | 52.4% |
| Here: | 26.3% |
| Fort Worth: | 48.2% |
Percentage of married-couple families with children (among all households):
| East Libbey Avenue: | 25.9% |
| Fort Worth: | 25.9% |
Percentage of single-mother households (among all households):
| East Libbey Avenue: | 2.5% |
| Fort Worth: | 7.4% |
Percentage of never married males 15 years old and over:
Percentage of never married females 15 years old and over:
| East Libbey Avenue: | 20.6% |
| Fort Worth: | 18.5% |
Percentage of never married females 15 years old and over:
| East Libbey Avenue: | 25.0% |
| city: | 17.3% |
Percentage of people that speak English not well or not at all:
| East Libbey Avenue: | 2.5% |
| Fort Worth: | 6.5% |
Percentage of people born in this state:
Percentage of people born in another U.S. state:
Percentage of native residents but born outside the U.S.:
Percentage of foreign born residents:
| Here: | 58.9% |
| Fort Worth: | 55.0% |
Percentage of people born in another U.S. state:
| East Libbey Avenue: | 24.4% |
| Fort Worth: | 26.2% |
Percentage of native residents but born outside the U.S.:
| Here: | 0.3% |
| city: | 2.1% |
Percentage of foreign born residents:
| Here: | 16.4% |
| Fort Worth: | 16.6% |
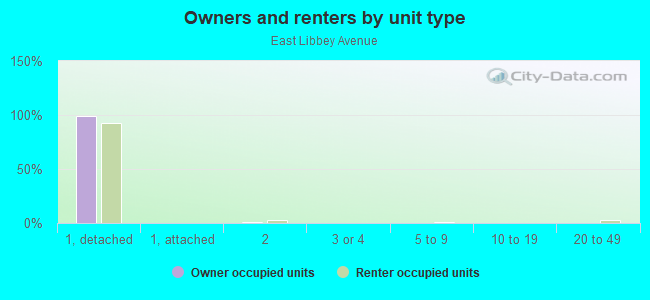
Owner-occupied
Renter-occupied

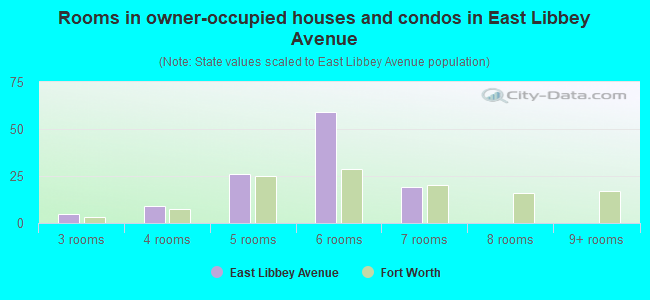
- Rooms in owner-occupied houses and condos in East Libbey Avenue
- 01 room
- 02 rooms
- 53 rooms
- 94 rooms
- 265 rooms
- 596 rooms
- 197 rooms
- 08 rooms
- 09+ rooms
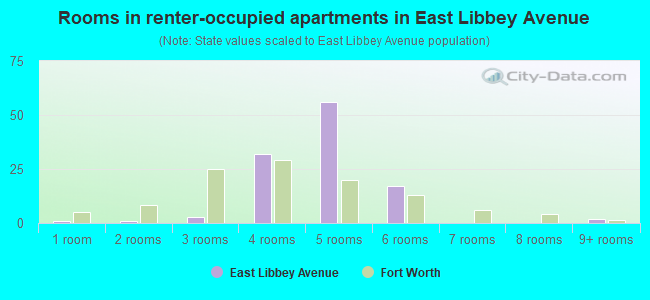
- Rooms in renter-occupied apartments in East Libbey Avenue
- 11 room
- 12 rooms
- 33 rooms
- 324 rooms
- 565 rooms
- 176 rooms
- 07 rooms
- 08 rooms
- 29+ rooms
Owner-occupied
Renter-occupied
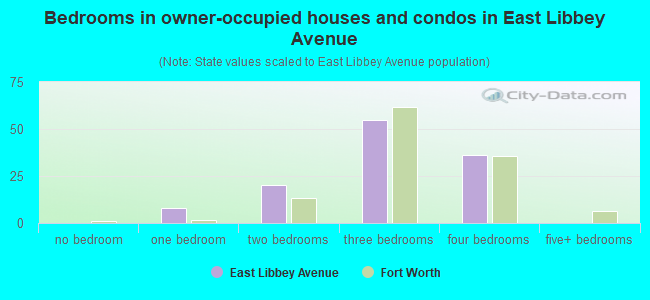
- Bedrooms in owner-occupied houses and condos in East Libbey Avenue
- 0no bedroom
- 81 bedroom
- 202 bedrooms
- 553 bedrooms
- 364 bedrooms
- 05+ bedrooms
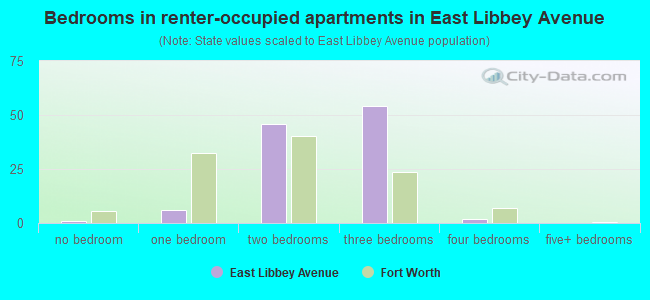
- Bedrooms in renter-occupied apartments in East Libbey Avenue
- 1no bedroom
- 61 bedroom
- 462 bedrooms
- 543 bedrooms
- 24 bedrooms
- 05+ bedrooms
Average number of cars or other vehicles available in houses/condos:
Average number of cars or other vehicles available in apartments:
| This neighborhood: | 2.2 |
| Fort Worth: | 2.1 |
Average number of cars or other vehicles available in apartments:
| Here: | 1.6 |
| city: | 1.5 |
Percentage of units with a mortgage:
| East Libbey Avenue: | 40.8% |
| Fort Worth: | 61.2% |
Average estimated value of detached houses in 2022 (98.7% of all units):
| East Libbey Avenue: | $158,715 |
| Fort Worth: | $264,175 |
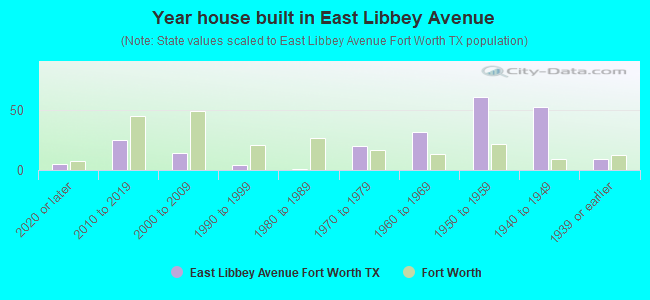
- Year house built in East Libbey Avenue
- 52020 or later
- 252010 to 2019
- 142000 to 2009
- 41990 to 1999
- 11980 to 1989
- 201970 to 1979
- 321960 to 1969
- 611950 to 1959
- 531940 to 1949
- 91939 or earlier
City-data.com crime index for city in 2020 (higher means more crime):
| City: | 303.1 |
| U.S. average: | 219.5 |
Travel time to work (commute)
![Travel time to work (commute)]()
- 55 to 9 minutes
- 1310 to 14 minutes
- 1415 to 19 minutes
- 1620 to 24 minutes
- 625 to 29 minutes
- 830 to 34 minutes
- 235 to 39 minutes
- 2945 to 59 minutes
- 1160 to 89 minutes

Means of transportation to work
![Means of transportation to work]()
- 92.9%350Drove a car alone
- 5.3%20Carpooled
- 1.3%5Bus
- 0.3%1Other means
- 0.3%1Worked at home

Time leaving home to go to work
![Time leaving home to go to work]()
- 312:00 a.m. to 4:59 a.m.
- 15:00 a.m. to 5:29 a.m.
- 45:30 a.m. to 5:59 a.m.
- 116:00 a.m. to 6:29 a.m.
- 97:00 a.m. to 7:29 a.m.
- 87:30 a.m. to 7:59 a.m.
- 148:00 a.m. to 8:29 a.m.
- 99:00 a.m. to 9:59 a.m.
- 510:00 a.m. to 10:59 a.m.
- 912:00 p.m. to 3:59 p.m.
- 64:00 p.m. to 11:59 p.m.

Occupations of males:
- Percentage of males in management occupations (except farmers):
Here: 4.4% city: 11.7%
- Percentage of males in computer and mathematical occupations:
Here: 3.3% city: 4.3%
- Percentage of males in education, training, and library occupations:
Here: 5.2% city: 2.9%
- Percentage of males in service occupations:
Here: 12.9% city: 12.0%
- Percentage of males in sales and office occupations:
Here: 20.1% city: 15.8%
- Percentage of males in construction, extraction, and maintenance occupations:
Here: 18.0% city: 11.7%
- Percentage of males in production occupations:
Here: 10.8% city: 7.8%
- Percentage of males in transportation occupations:
Here: 2.8% city: 7.1%
- Percentage of males in material moving occupations:
Here: 27.8% city: 7.1%
Occupations of females:
- Percentage of females in management occupations (except farmers):
Here: 2.9% city: 9.6%
- Percentage of females in business and financial operations occupations:
Here: 8.5% city: 6.3%
- Percentage of females in life, physical, and social science occupations:
Here: 2.1% city: 0.5%
- Percentage of females in community and social services occupations:
Here: 4.5% city: 2.2%
- Percentage of females in education, training, and library occupations:
Here: 2.2% city: 9.5%
- Percentage of females in arts, design, entertainment, sports, and media occupations:
Here: 1.1% city: 1.8%
- Percentage of females in healthcare practitioners and technical occupations:
Here: 6.9% city: 7.9%
- Percentage of females in service occupations:
Here: 42.6% city: 20.2%
- Percentage of females in sales and office occupations:
Here: 32.4% city: 28.3%
- Percentage of females in production occupations:
Here: 3.8% city: 3.5%
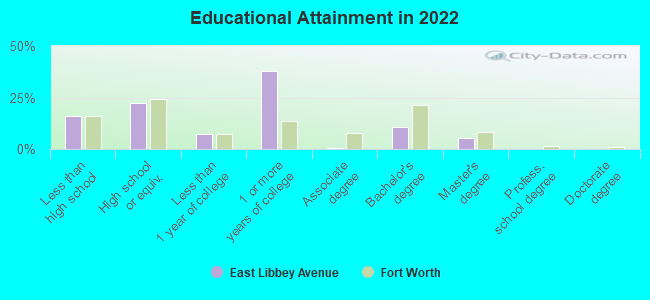
Education in this neighborhood (subdivision or community):
- Percentage of people 3 years and older in K-12 schools:
East Libbey Avenue: 21.4% Fort Worth: 20.3%
- Percentage of people 3 years and older in undergraduate colleges:
East Libbey Avenue: 2.2% Fort Worth: 4.7%
- Percentage of people 3 years and older in grad. or professional schools:
East Libbey Avenue: 0.3% Fort Worth: 1.6%
- Percentage of students K-12 enrolled in private schools:
East Libbey Avenue: 0.0% Fort Worth: 7.2%
Percentage of population below poverty level:
| East Libbey Avenue: | 19.6% |
| Fort Worth: | 12.0% |
Median year owner moved in (as recorded in 2022):
Median year renter moved in (as recorded in 2022):
| East Libbey Avenue: | 2764 |
| Fort Worth: | 2013 |
Median year renter moved in (as recorded in 2022):
| East Libbey Avenue: | 2768 |
| Fort Worth: | 2020 |
Percentage of married-couple families with both working:
| East Libbey Avenue: | 90.8% |
| Fort Worth: | 71.2% |
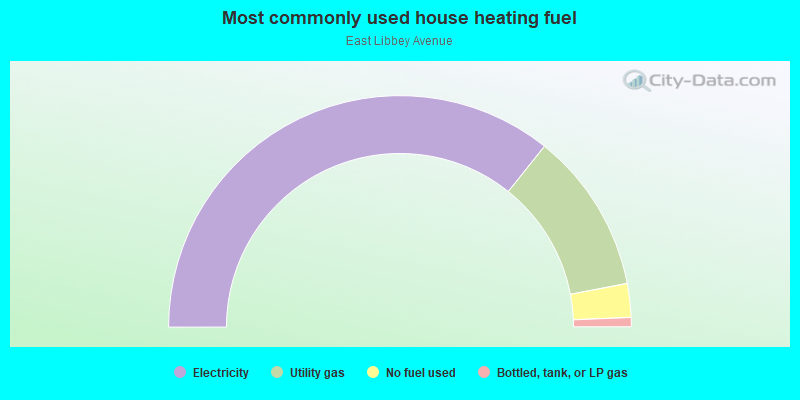
- 71.4%Electricity
- 22.5%Utility gas
- 4.7%No fuel used
- 1.3%Bottled, tank, or LP gas
Roads and streets:
Libbey Ave
Length: 0.71 miles
Direction: E-W
Address range: 5000 to 5599
Direction: E-W
Address range: 5000 to 5599
Blackmore Ave
Length: 0.69 miles
Direction: E-W
Address range: 5000 to 5599
Direction: E-W
Address range: 5000 to 5599
Faron St
Length: 0.07 miles
Direction: N-S
Address range: 4100 to 4199
Direction: N-S
Address range: 4100 to 4199
Hervie St
Length: 0.07 miles
Direction: N-S
Address range: 4100 to 4199
Direction: N-S
Address range: 4100 to 4199
Prevost St
Length: 0.07 miles
Direction: N-S
Address range: 4100 to 4199
Direction: N-S
Address range: 4100 to 4199
Bourine St
Length: 0.07 miles
Direction: N-S
Address range: 4100 to 4199
Direction: N-S
Address range: 4100 to 4199
Merrick St
Length: 0.07 miles
Direction: N-S
Address range: 4100 to 4199
Direction: N-S
Address range: 4100 to 4199
Neville St
Length: 0.07 miles
Direction: N-S
Address range: 4100 to 4199
Direction: N-S
Address range: 4100 to 4199