East Garrett Park neighborhood in Dallas, Texas (TX), 75206 detailed profile
Settings
X

Business Search - 14 Million verified businesses
Area: 0.090 square miles
Population: 1,427
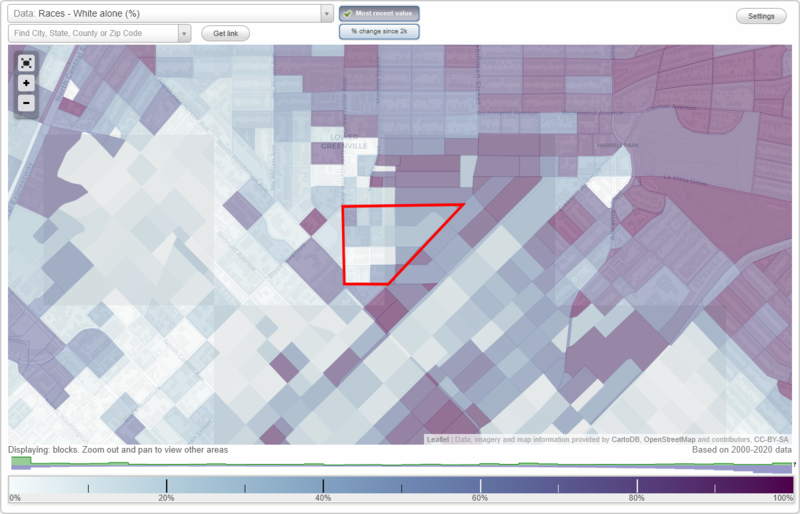
Population density:
| East Garrett Park: | 15,907 people per square mile |
| Dallas: | 3,794 people per square mile |

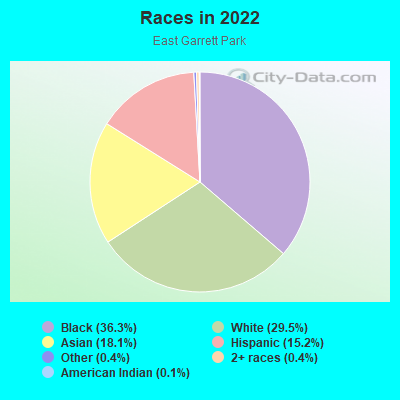
- 84336.3%Black
- 68429.5%White
- 41918.1%Asian
- 35315.2%Hispanic or Latino
- 100.4%Some other race
- 90.4%Two or more races
- 30.1%American Indian
Median household income in 2022:
| East Garrett Park: | $105,799 |
| Dallas: | $65,400 |
Distribution of median household income
![Distribution of median household income]()
- 206Less than $10,000
- 212$10,000 to $19,999
- 66$20,000 to $29,999
- 107$30,000 to $39,999
- 159$40,000 to $49,999
- 41$50,000 to $59,999
- 518$60,000 to $74,999
- 36$75,000 to $99,999
- 96$100,000 to $124,999
- 31$125,000 to $149,999
- 59$150,000 to $199,999
- 104$200,000 or more

Distribution of owner-occupied house/condo value
![Distribution of owner-occupied house/condo value]()
- 7$100,000 to $149,999
- 16$150,000 to $199,999
- 16$200,000 to $249,999
- 4$250,000 to $299,999
- 38$300,000 to $399,999
- 55$400,000 to $499,999
- 46$500,000 to $749,999
- 31$750,000 to $999,999
- 61$1,000,000 or more

Distribution of rent paid by renters
![Distribution of rent paid by renters]()
- 114$200 to $299
- 6$300 to $399
- 12$400 to $499
- 8$500 to $599
- 126$600 to $699
- 21$700 to $799
- 174$800 to $899
- 44$900 to $999
- 266$1,000 to $1,249
- 219$1,250 to $1,499
- 181$1,500 to $1,999
- 37$2,000 or more

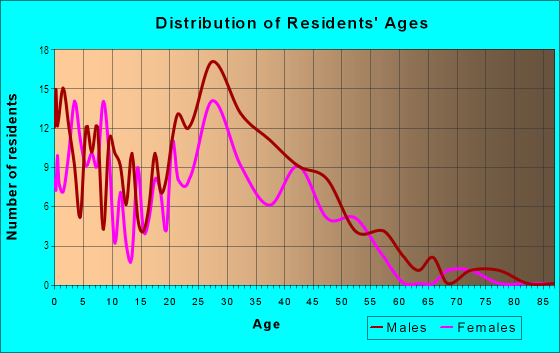
| Males: | 878 |
| Females: | 549 |
Males:
| This neighborhood: | 29.7 years |
| Whole city: | 32.8 years |
| This neighborhood: | 32.4 years |
| Whole city: | 33.4 years |
Average household size:
| East Garrett Park: | 1.9 people |
| Dallas: | 2.4 people |
Percentage of family households:
| East Garrett Park: | 21.6% |
| Dallas: | 42.6% |
| Here: | 12.5% |
| Dallas: | 33.8% |
Percentage of married-couple families with children (among all households):
| East Garrett Park: | 7.5% |
| Dallas: | 24.8% |
Percentage of single-mother households (among all households):
| East Garrett Park: | 47.7% |
| Dallas: | 13.3% |
Percentage of never married males 15 years old and over:
Percentage of never married females 15 years old and over:
| East Garrett Park: | 41.9% |
| Dallas: | 22.1% |
Percentage of never married females 15 years old and over:
| East Garrett Park: | 21.5% |
| city: | 21.8% |
Percentage of people that speak English not well or not at all:
| East Garrett Park: | 4.0% |
| Dallas: | 10.7% |
Percentage of people born in this state:
Percentage of people born in another U.S. state:
Percentage of native residents but born outside the U.S.:
Percentage of foreign born residents:
| Here: | 54.0% |
| Dallas: | 52.8% |
Percentage of people born in another U.S. state:
| East Garrett Park: | 35.7% |
| Dallas: | 22.0% |
Percentage of native residents but born outside the U.S.:
| Here: | 0.7% |
| city: | 1.3% |
Percentage of foreign born residents:
| Here: | 9.7% |
| Dallas: | 23.9% |
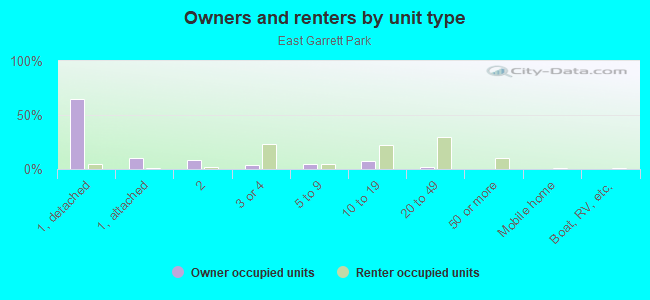
Owner-occupied
Renter-occupied

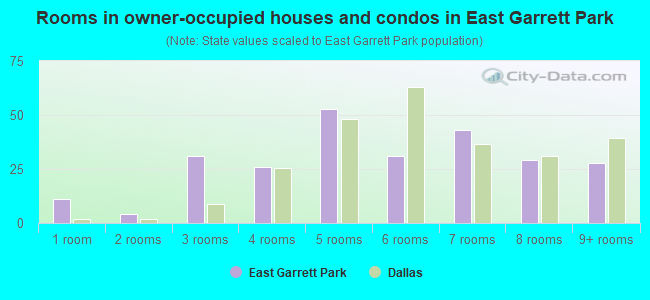
- Rooms in owner-occupied houses and condos in East Garrett Park
- 111 room
- 42 rooms
- 313 rooms
- 264 rooms
- 535 rooms
- 316 rooms
- 437 rooms
- 298 rooms
- 289+ rooms
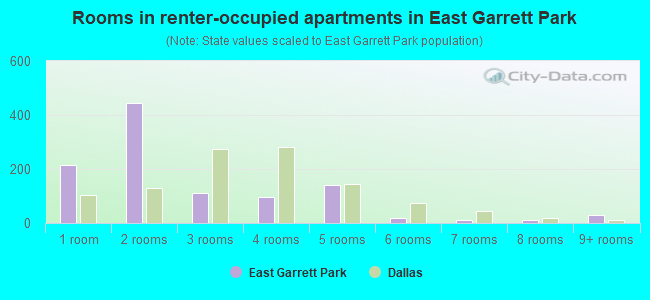
- Rooms in renter-occupied apartments in East Garrett Park
- 2151 room
- 4432 rooms
- 1123 rooms
- 974 rooms
- 1395 rooms
- 176 rooms
- 117 rooms
- 118 rooms
- 289+ rooms
Owner-occupied
Renter-occupied
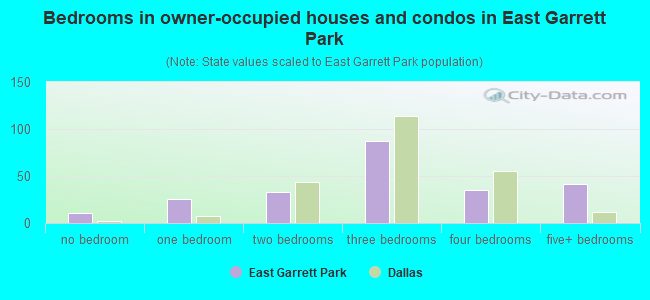
- Bedrooms in owner-occupied houses and condos in East Garrett Park
- 11no bedroom
- 261 bedroom
- 332 bedrooms
- 873 bedrooms
- 354 bedrooms
- 425+ bedrooms
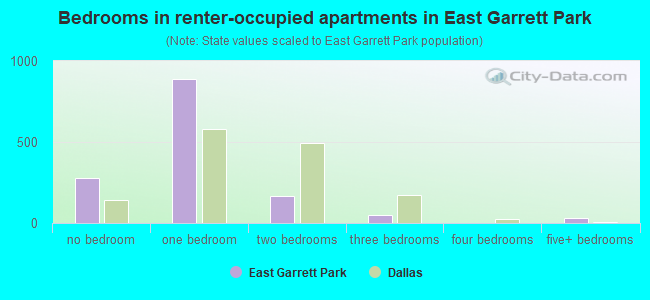
- Bedrooms in renter-occupied apartments in East Garrett Park
- 279no bedroom
- 8881 bedroom
- 1692 bedrooms
- 473 bedrooms
- 34 bedrooms
- 285+ bedrooms
Average number of cars or other vehicles available in houses/condos:
Average number of cars or other vehicles available in apartments:
| This neighborhood: | 2.0 |
| Dallas: | 2.1 |
Average number of cars or other vehicles available in apartments:
| Here: | 1.4 |
| city: | 1.3 |
Percentage of units with a mortgage:
| East Garrett Park: | 72.9% |
| Dallas: | 53.9% |
Housing prices:
- Average estimated value of detached houses in 2022 (26.0% of all units):
East Garrett Park: $1,296,454 Dallas: $423,859
- Average estimated value of townhouses or other attached units in 2022 (4.3% of all units):
This neighborhood: $2,166,258 city: $359,487
- Average estimated value of housing units in 2-unit structures in 2022 (6.0% of all units):
This neighborhood: $510,838 Dallas: $446,051
- Average estimated '22 value of housing units in 3-to-4-unit structures (15.4% of all units):
East Garrett Park: $589,263 city: $213,989
- Average estimated '22 value of housing units in 5-or-more-unit structures (19.1% of all units):
East Garrett Park: $366,383 Dallas: $398,482
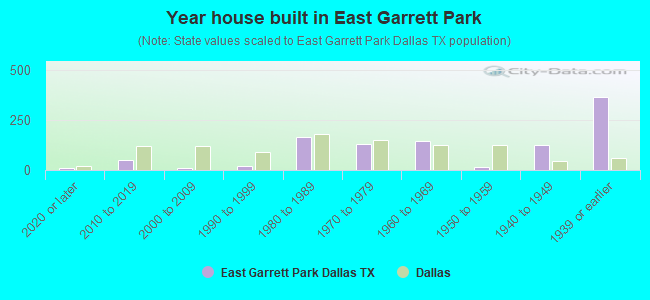
- Year house built in East Garrett Park
- 112020 or later
- 512010 to 2019
- 82000 to 2009
- 181990 to 1999
- 1661980 to 1989
- 1281970 to 1979
- 1441960 to 1969
- 141950 to 1959
- 1271940 to 1949
- 3621939 or earlier
City-data.com crime index for city in 2020 (higher means more crime):
| City: | 439.5 |
| U.S. average: | 219.5 |
Travel time to work (commute)
![Travel time to work (commute)]()
- 3Less than 5 minutes
- 195 to 9 minutes
- 5510 to 14 minutes
- 14015 to 19 minutes
- 4820 to 24 minutes
- 4925 to 29 minutes
- 4630 to 34 minutes
- 1635 to 39 minutes
- 1940 to 44 minutes
- 10445 to 59 minutes
- 1860 to 89 minutes
- 590 or more minutes

Means of transportation to work
![Means of transportation to work]()
- 55.6%581Drove a car alone
- 12.2%127Carpooled
- 8.4%88Bus
- 0.3%3Subway or elevated rail
- 0.4%4Motorcycle
- 1.6%17Bicycle
- 13.5%141Walked
- 13.9%145Other means
- 21.8%228Worked at home

Time leaving home to go to work
![Time leaving home to go to work]()
- 812:00 a.m. to 4:59 a.m.
- 25:00 a.m. to 5:29 a.m.
- 65:30 a.m. to 5:59 a.m.
- 146:00 a.m. to 6:29 a.m.
- 226:30 a.m. to 6:59 a.m.
- 827:00 a.m. to 7:29 a.m.
- 717:30 a.m. to 7:59 a.m.
- 798:00 a.m. to 8:29 a.m.
- 528:30 a.m. to 8:59 a.m.
- 479:00 a.m. to 9:59 a.m.
- 910:00 a.m. to 10:59 a.m.
- 1411:00 a.m. to 11:59 a.m.
- 2412:00 p.m. to 3:59 p.m.
- 274:00 p.m. to 11:59 p.m.

Occupations of males:
- Percentage of males in management occupations (except farmers):
Here: 11.5% city: 10.9%
- Percentage of males in business and financial operations occupations:
Here: 8.0% city: 7.3%
- Percentage of males in computer and mathematical occupations:
Here: 6.2% city: 4.7%
- Percentage of males in architecture and engineering occupations:
Here: 4.5% city: 2.8%
- Percentage of males in community and social services occupations:
Here: 2.2% city: 0.8%
- Percentage of males in legal occupations:
Here: 1.3% city: 1.8%
- Percentage of males in education, training, and library occupations:
Here: 4.7% city: 2.3%
- Percentage of males in arts, design, entertainment, sports, and media occupations:
Here: 1.5% city: 2.2%
- Percentage of males in healthcare practitioners and technical occupations:
Here: 1.7% city: 2.7%
- Percentage of males in service occupations:
Here: 18.5% city: 12.3%
- Percentage of males in sales and office occupations:
Here: 21.8% city: 14.9%
- Percentage of males in construction, extraction, and maintenance occupations:
Here: 1.8% city: 15.2%
- Percentage of males in transportation occupations:
Here: 3.0% city: 5.9%
- Percentage of males in material moving occupations:
Here: 13.5% city: 6.2%
Occupations of females:
- Percentage of females in management occupations (except farmers):
Here: 9.9% city: 9.6%
- Percentage of females in business and financial operations occupations:
Here: 6.6% city: 8.4%
- Percentage of females in architecture and engineering occupations:
Here: 1.7% city: 0.6%
- Percentage of females in community and social services occupations:
Here: 1.5% city: 1.8%
- Percentage of females in legal occupations:
Here: 3.7% city: 1.8%
- Percentage of females in education, training, and library occupations:
Here: 5.7% city: 7.1%
- Percentage of females in arts, design, entertainment, sports, and media occupations:
Here: 4.9% city: 2.9%
- Percentage of females in healthcare practitioners and technical occupations:
Here: 16.8% city: 7.7%
- Percentage of females in service occupations:
Here: 16.5% city: 20.5%
- Percentage of females in sales and office occupations:
Here: 31.4% city: 27.7%
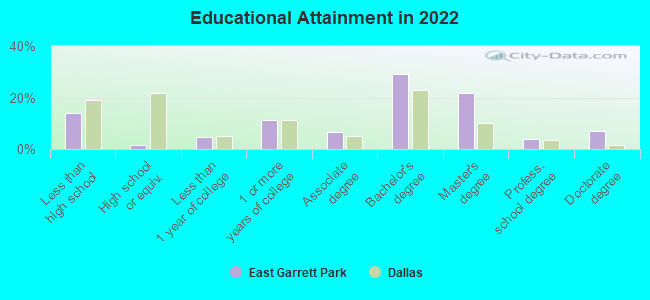
Education in this neighborhood (subdivision or community):
- Percentage of people 3 years and older in K-12 schools:
East Garrett Park: 14.6% Dallas: 17.3%
- Percentage of people 3 years and older in undergraduate colleges:
East Garrett Park: 13.2% Dallas: 4.1%
- Percentage of people 3 years and older in grad. or professional schools:
East Garrett Park: 2.2% Dallas: 1.7%
- Percentage of students K-12 enrolled in private schools:
East Garrett Park: 4.0% Dallas: 10.8%
Percentage of population below poverty level:
| East Garrett Park: | 10.8% |
| Dallas: | 17.8% |
Median year owner moved in (as recorded in 2022):
Median year renter moved in (as recorded in 2022):
| East Garrett Park: | 2012 |
| Dallas: | 2010 |
Median year renter moved in (as recorded in 2022):
| East Garrett Park: | 2016 |
| Dallas: | 2020 |
Percentage of married-couple families with both working:
| East Garrett Park: | 323.0% |
| Dallas: | 58.3% |
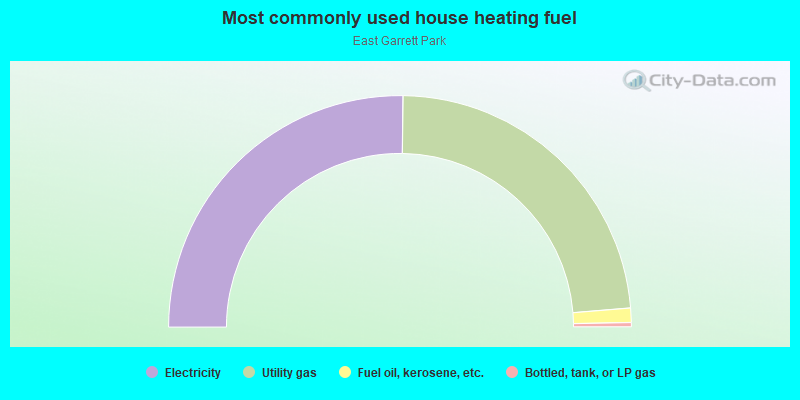
- 50.5%Electricity
- 47.0%Utility gas
- 2.0%Fuel oil, kerosene, etc.
- 0.6%Bottled, tank, or LP gas
Roads and streets:
Hudson St
Length: 0.42 miles
Directions: E-W, SE-NW, SW-NE
Address range: 5601 to 6199
Directions: E-W, SE-NW, SW-NE
Address range: 5601 to 6199
Live Oak St
Length: 0.42 miles
Direction: SW-NE
Address range: 5401 to 5748
Direction: SW-NE
Address range: 5401 to 5748
Lindell Ave
Length: 0.22 miles
Direction: E-W
Address range: 5700 to 5999
Direction: E-W
Address range: 5700 to 5999
Matilda St
Length: 0.22 miles
Direction: N-S
Address range: 1400 to 1599
Direction: N-S
Address range: 1400 to 1599
Hubert St
Length: 0.19 miles
Direction: N-S
Address range: 1350 to 1599
Direction: N-S
Address range: 1350 to 1599
Bryan St
Length: 0.16 miles
Direction: E-W
Address range: 5200 to 5399
Direction: E-W
Address range: 5200 to 5399
Bryan Pkwy
Length: 0.15 miles
Direction: E-W
Address range: 5700 to 5953
Direction: E-W
Address range: 5700 to 5953
Hope St
Length: 0.04 miles
Direction: N-S
Address range: 1500 to 1599
Direction: N-S
Address range: 1500 to 1599
Mary St
Length: 0.04 miles
Direction: N-S
Address range: 1500 to 1599
Direction: N-S
Address range: 1500 to 1599