East Dobern neighborhood in San Jose, California (CA), 95116 detailed profile
Settings
X

Business Search - 14 Million verified businesses
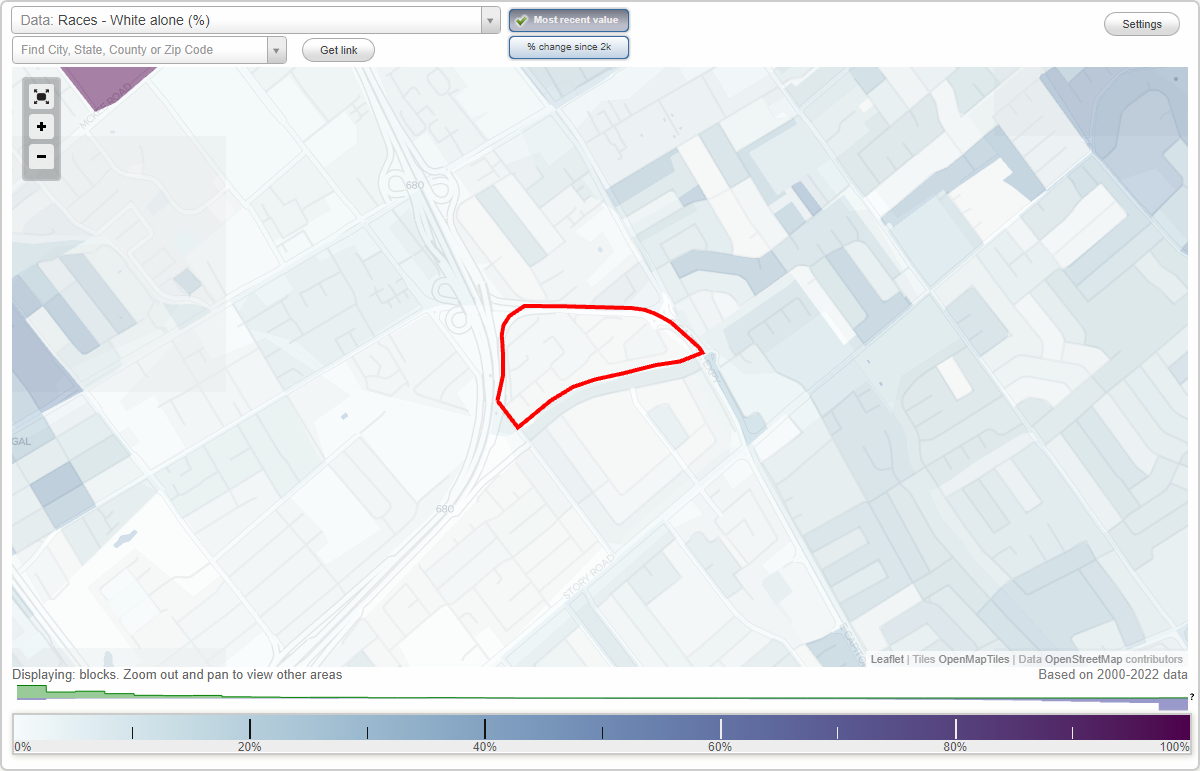
Area: 0.078 square miles
Population: 391
Population density:
| East Dobern: | 5,009 people per square mile |
| San Jose: | 5,554 people per square mile |

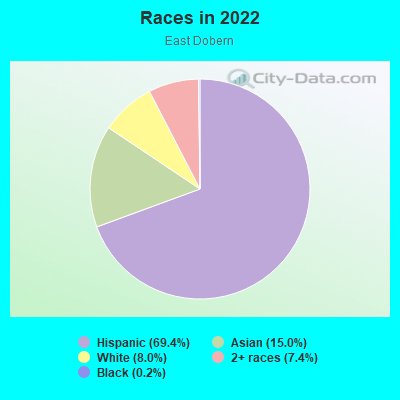
- 32069.4%Hispanic or Latino
- 6915.0%Asian
- 378.0%White
- 347.4%Two or more races
- 10.2%Black
Distribution of median household income
![Distribution of median household income]()
- 4Less than $10,000
- 41$10,000 to $19,999
- 9$20,000 to $29,999
- 11$30,000 to $39,999
- 24$40,000 to $49,999
- 6$50,000 to $59,999
- 32$60,000 to $74,999
- 11$75,000 to $99,999
- 9$100,000 to $124,999
- 42$125,000 to $149,999
- 10$150,000 to $199,999
- 21$200,000 or more

Distribution of owner-occupied house/condo value
![Distribution of owner-occupied house/condo value]()
- 18Less than $50,000
- 8$50,000 to $99,999
- 4$300,000 to $399,999
- 5$400,000 to $499,999
- 17$500,000 to $749,999
- 14$750,000 to $999,999
- 41$1,000,000 or more

Distribution of rent paid by renters
![Distribution of rent paid by renters]()
- 3Less than $100
- 6$200 to $299
- 9$300 to $399
- 5$400 to $499
- 6$800 to $899
- 25$900 to $999
- 7$1,000 to $1,249
- 6$1,250 to $1,499
- 8$1,500 to $1,999
- 50$2,000 or more

Median rent in 2022:
| East Dobern: | $2,357 |
| San Jose: | $2,001 |
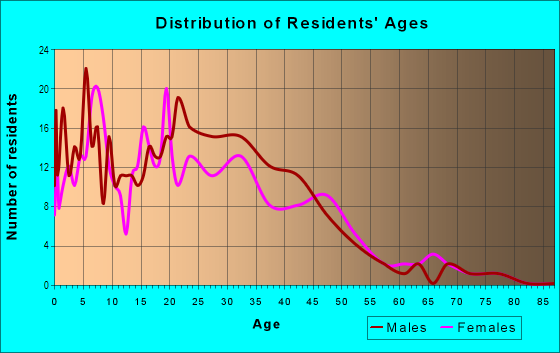
| Males: | 208 |
| Females: | 182 |
Males:
| This neighborhood: | 33.4 years |
| Whole city: | 37.6 years |
| This neighborhood: | 42.4 years |
| Whole city: | 39.1 years |
Average household size:
| East Dobern: | 4.4 people |
| San Jose: | 2.9 people |
Percentage of family households:
| East Dobern: | 56.7% |
| San Jose: | 49.9% |
| Here: | 50.5% |
| San Jose: | 53.0% |
Percentage of married-couple families with children (among all households):
| East Dobern: | 13.1% |
| San Jose: | 25.8% |
Percentage of single-mother households (among all households):
| East Dobern: | 5.4% |
| San Jose: | 5.2% |
Percentage of never married males 15 years old and over:
Percentage of never married females 15 years old and over:
| East Dobern: | 16.9% |
| San Jose: | 20.9% |
Percentage of never married females 15 years old and over:
| East Dobern: | 19.8% |
| city: | 16.7% |
Percentage of people that speak English not well or not at all:
| East Dobern: | 29.8% |
| San Jose: | 11.4% |
Percentage of people born in this state:
Percentage of people born in another U.S. state:
Percentage of native residents but born outside the U.S.:
Percentage of foreign born residents:
| Here: | 46.5% |
| San Jose: | 46.1% |
Percentage of people born in another U.S. state:
| East Dobern: | 1.5% |
| San Jose: | 10.4% |
Percentage of native residents but born outside the U.S.:
| Here: | 1.6% |
| city: | 1.7% |
Percentage of foreign born residents:
| Here: | 50.5% |
| San Jose: | 41.8% |
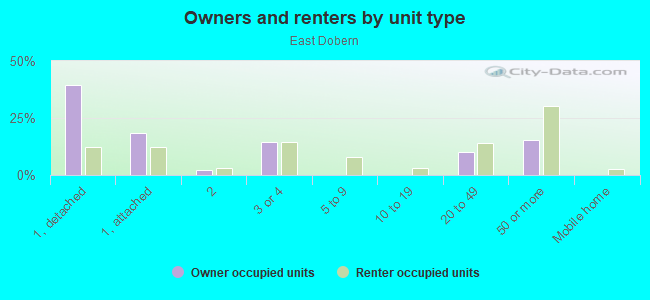
Owner-occupied
Renter-occupied

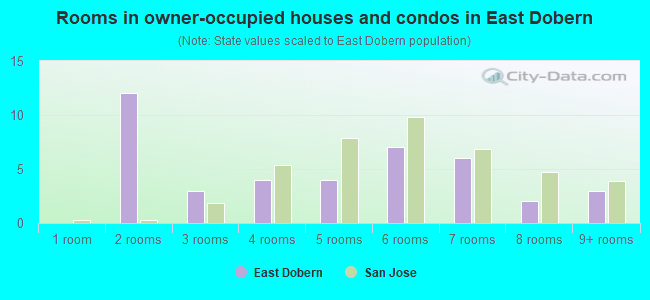
- Rooms in owner-occupied houses and condos in East Dobern
- 01 room
- 122 rooms
- 33 rooms
- 44 rooms
- 45 rooms
- 76 rooms
- 67 rooms
- 28 rooms
- 39+ rooms
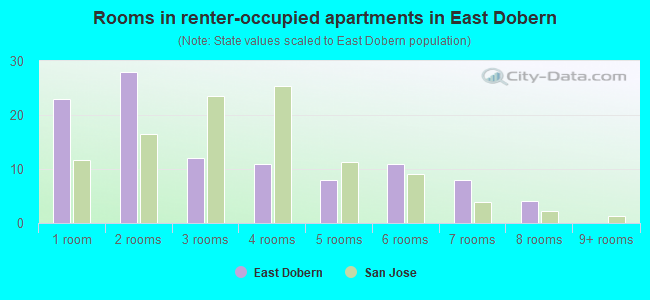
- Rooms in renter-occupied apartments in East Dobern
- 231 room
- 282 rooms
- 123 rooms
- 114 rooms
- 85 rooms
- 116 rooms
- 87 rooms
- 48 rooms
- 09+ rooms
Owner-occupied
Renter-occupied
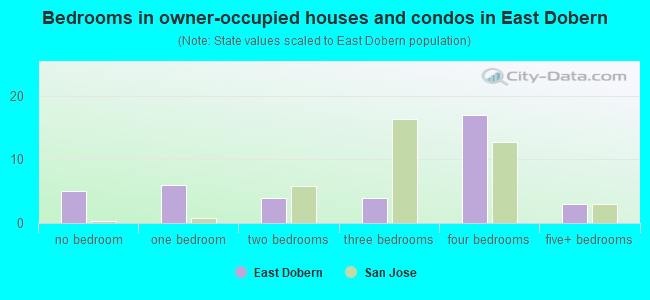
- Bedrooms in owner-occupied houses and condos in East Dobern
- 5no bedroom
- 61 bedroom
- 42 bedrooms
- 43 bedrooms
- 174 bedrooms
- 35+ bedrooms
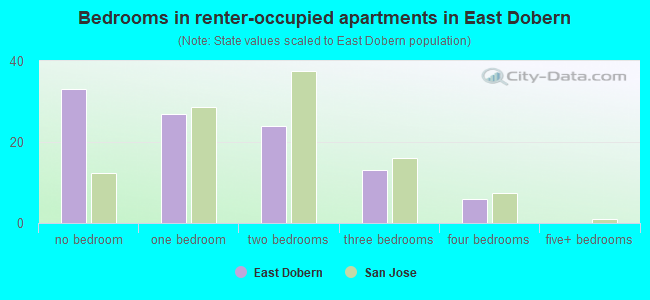
- Bedrooms in renter-occupied apartments in East Dobern
- 33no bedroom
- 271 bedroom
- 242 bedrooms
- 133 bedrooms
- 64 bedrooms
- 05+ bedrooms
Average number of cars or other vehicles available in houses/condos:
Average number of cars or other vehicles available in apartments:
| This neighborhood: | 3.4 |
| San Jose: | 2.3 |
Average number of cars or other vehicles available in apartments:
| Here: | 2.5 |
| city: | 1.6 |
Percentage of units with a mortgage:
| East Dobern: | 56.7% |
| San Jose: | 66.9% |
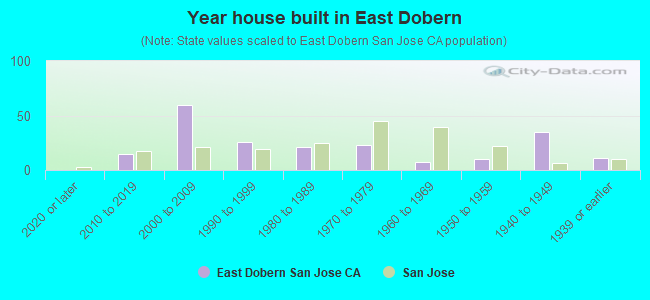
- Year house built in East Dobern
- 02020 or later
- 152010 to 2019
- 602000 to 2009
- 261990 to 1999
- 211980 to 1989
- 231970 to 1979
- 71960 to 1969
- 101950 to 1959
- 351940 to 1949
- 111939 or earlier
City-data.com crime index for city in 2020 (higher means more crime):
| City: | 268.4 |
| U.S. average: | 219.5 |
Travel time to work (commute)
![Travel time to work (commute)]()
- 27Less than 5 minutes
- 145 to 9 minutes
- 6210 to 14 minutes
- 8115 to 19 minutes
- 15620 to 24 minutes
- 2825 to 29 minutes
- 7130 to 34 minutes
- 735 to 39 minutes
- 2740 to 44 minutes
- 1745 to 59 minutes
- 3260 to 89 minutes
- 990 or more minutes

Means of transportation to work
![Means of transportation to work]()
- 70.8%125Drove a car alone
- 27.8%49Carpooled
- 4.0%7Bus
- 3.4%6Long-distance train or commuter rail
- 2.3%4Walked
- 22.1%39Other means
- 23.8%42Worked at home

Time leaving home to go to work
![Time leaving home to go to work]()
- 6812:00 a.m. to 4:59 a.m.
- 405:00 a.m. to 5:29 a.m.
- 205:30 a.m. to 5:59 a.m.
- 676:00 a.m. to 6:29 a.m.
- 366:30 a.m. to 6:59 a.m.
- 327:00 a.m. to 7:29 a.m.
- 657:30 a.m. to 7:59 a.m.
- 888:00 a.m. to 8:29 a.m.
- 208:30 a.m. to 8:59 a.m.
- 509:00 a.m. to 9:59 a.m.
- 310:00 a.m. to 10:59 a.m.
- 511:00 a.m. to 11:59 a.m.
- 4312:00 p.m. to 3:59 p.m.
- 464:00 p.m. to 11:59 p.m.

Occupations of males:
- Percentage of males in management occupations (except farmers):
Here: 11.5% city: 13.0%
- Percentage of males in computer and mathematical occupations:
Here: 1.3% city: 13.6%
- Percentage of males in service occupations:
Here: 27.3% city: 12.7%
- Percentage of males in sales and office occupations:
Here: 15.8% city: 12.8%
- Percentage of males in farming, fishing, and forestry occupations:
Here: 2.2% city: 0.4%
- Percentage of males in construction, extraction, and maintenance occupations:
Here: 19.7% city: 7.8%
- Percentage of males in material moving occupations:
Here: 10.2% city: 3.1%
Occupations of females:
- Percentage of females in management occupations (except farmers):
Here: 4.7% city: 11.0%
- Percentage of females in business and financial operations occupations:
Here: 4.9% city: 8.6%
- Percentage of females in computer and mathematical occupations:
Here: 2.9% city: 5.4%
- Percentage of females in education, training, and library occupations:
Here: 16.8% city: 8.1%
- Percentage of females in healthcare practitioners and technical occupations:
Here: 6.4% city: 6.8%
- Percentage of females in service occupations:
Here: 21.6% city: 21.7%
- Percentage of females in sales and office occupations:
Here: 20.1% city: 22.0%
- Percentage of females in construction, extraction, and maintenance occupations:
Here: 4.9% city: 0.2%
- Percentage of females in production occupations:
Here: 20.8% city: 4.0%
- Percentage of females in transportation occupations:
Here: 3.8% city: 0.7%
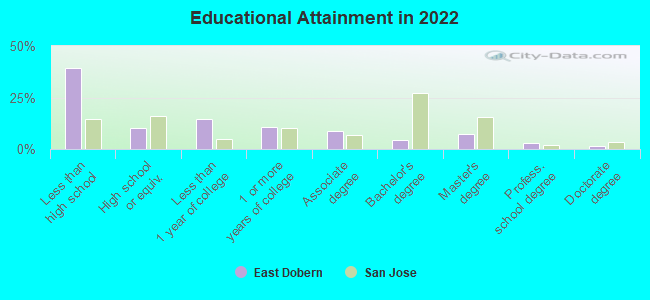
Education in this neighborhood (subdivision or community):
- Percentage of people 3 years and older in K-12 schools:
East Dobern: 33.2% San Jose: 16.1%
- Percentage of people 3 years and older in undergraduate colleges:
East Dobern: 10.9% San Jose: 6.5%
- Percentage of people 3 years and older in grad. or professional schools:
East Dobern: 5.3% San Jose: 2.0%
- Percentage of students K-12 enrolled in private schools:
East Dobern: 4.8% San Jose: 14.9%
Percentage of population below poverty level:
| East Dobern: | 9.6% |
| San Jose: | 9.0% |
Median year owner moved in (as recorded in 2022):
Median year renter moved in (as recorded in 2022):
| East Dobern: | 1994 |
| San Jose: | 2008 |
Median year renter moved in (as recorded in 2022):
| East Dobern: | 2012 |
| San Jose: | 2020 |
Percentage of married-couple families with both working:
| East Dobern: | 126.0% |
| San Jose: | 72.5% |
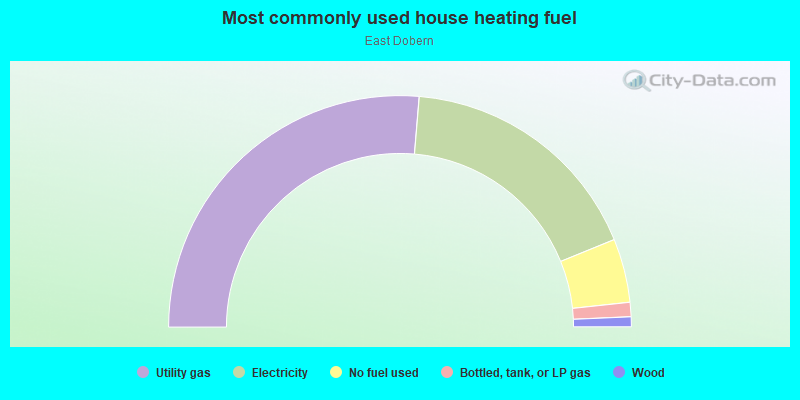
- 52.6%Utility gas
- 35.0%Electricity
- 8.9%No fuel used
- 2.0%Bottled, tank, or LP gas
- 1.4%Wood
Limited-access highways (interstate or state) in this neighborhood:
Capitol Expy (E Capitol Expy)
Length: 0.29 miles
Directions: E-W, SE-NW
Directions: E-W, SE-NW
Roads and streets:
Dobern Ave
Length: 0.25 miles
Directions: E-W, N-S, SE-NW, SW-NE
Address range: 2300 to 2599
Directions: E-W, N-S, SE-NW, SW-NE
Address range: 2300 to 2599
Summer St
Length: 0.25 miles
Directions: N-S, SW-NE
Address range: 2300 to 2499
Directions: N-S, SW-NE
Address range: 2300 to 2499
Pendragon Ln
Length: 0.17 miles
Directions: E-W, SW-NE
Address range: 2300 to 2699
Directions: E-W, SW-NE
Address range: 2300 to 2699
Highwood Dr
Length: 0.16 miles
Directions: N-S, SE-NW, SW-NE
Address range: 2600 to 2699
Directions: N-S, SE-NW, SW-NE
Address range: 2600 to 2699
Massar Ave
Length: 0.13 miles
Direction: SE-NW
Address range: 400 to 599
Direction: SE-NW
Address range: 400 to 599
Clyda Dr
Length: 0.13 miles
Directions: E-W, N-S, SE-NW, SW-NE
Address range: 2400 to 2499
Directions: E-W, N-S, SE-NW, SW-NE
Address range: 2400 to 2499
Abed Ct
Length: 0.12 miles
Directions: N-S, SW-NE
Address range: 2500 to 2599
Directions: N-S, SW-NE
Address range: 2500 to 2599
S Capitol Ave
Length: 0.10 miles
Directions: E-W, SE-NW
Address range: 700 to 781
Directions: E-W, SE-NW
Address range: 700 to 781
Summer Ct
Length: 0.07 miles
Directions: E-W, N-S, SE-NW, SW-NE
Address range: 2300 to 2399
Directions: E-W, N-S, SE-NW, SW-NE
Address range: 2300 to 2399
Excalibur Dr
Length: 0.06 miles
Directions: N-S, SE-NW, SW-NE
Address range: 600 to 799
Directions: N-S, SE-NW, SW-NE
Address range: 600 to 799
Rivermont Ct
Length: 0.05 miles
Directions: E-W, SE-NW
Directions: E-W, SE-NW
Penrod Pl
Length: 0.05 miles
Direction: SE-NW
Address range: 600 to 699
Direction: SE-NW
Address range: 600 to 699
Georginia Ave
Length: 0.04 miles
Direction: SW-NE
Address range: 2500 to 2630
Direction: SW-NE
Address range: 2500 to 2630
Gittle Ct
Length: 0.04 miles
Direction: SE-NW
Address range: 600 to 699
Direction: SE-NW
Address range: 600 to 699
Soni Ct
Length: 0.04 miles
Direction: SE-NW
Address range: 600 to 699
Direction: SE-NW
Address range: 600 to 699
Lombard Ave
Length: 0.03 miles
Direction: SW-NE
Direction: SW-NE
Other features:
Silver Crk
Length: 0.02 miles
Directions: E-W, SW-NE
Directions: E-W, SW-NE