East Campus neighborhood in San Jose, California (CA), 95112 detailed profile
Settings
X

Business Search - 14 Million verified businesses
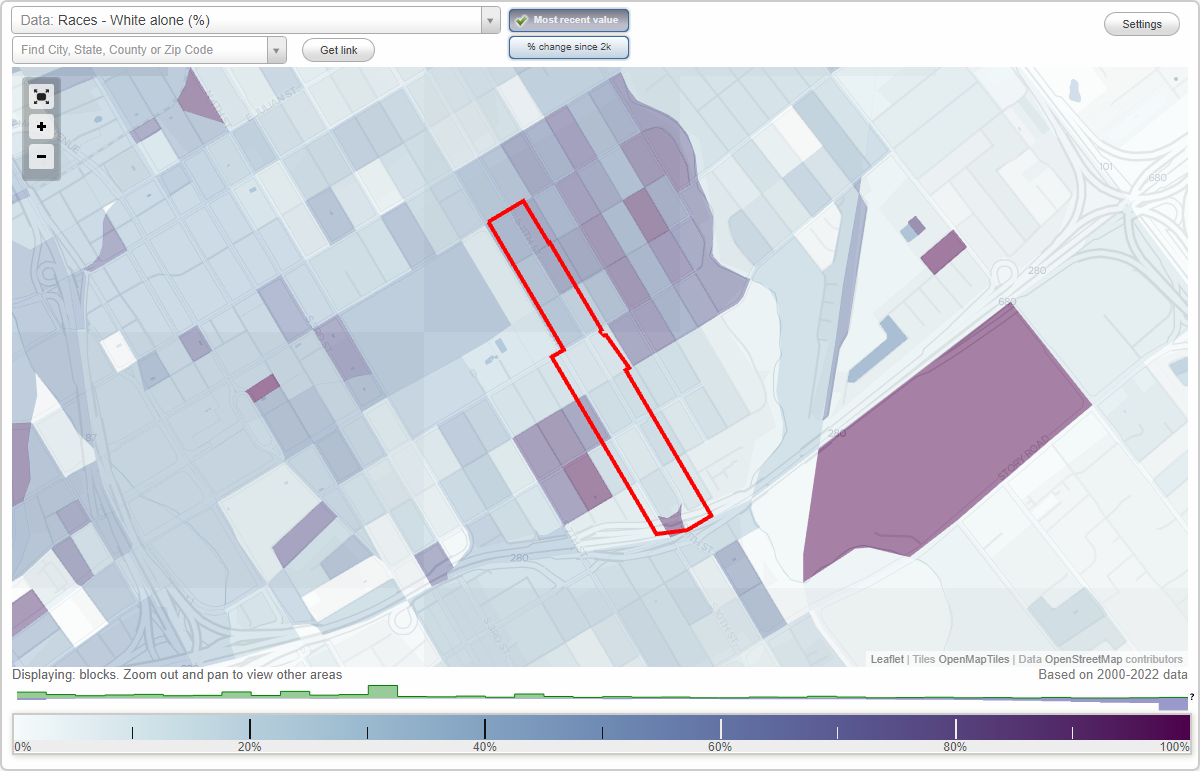
Area: 0.103 square miles
Population: 1,288
Population density:
| East Campus: | 12,496 people per square mile |
| San Jose: | 5,554 people per square mile |

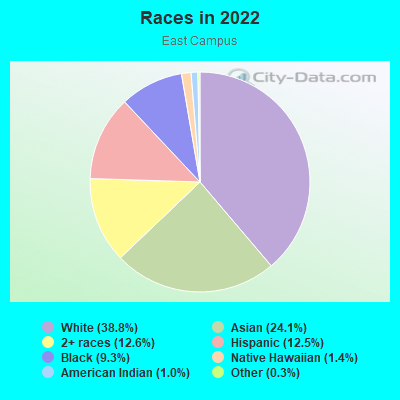
- 51238.8%White
- 31824.1%Asian
- 16712.6%Two or more races
- 16512.5%Hispanic or Latino
- 1239.3%Black
- 191.4%Native Hawaiian and Other
Pacific Islander - 131.0%American Indian
- 40.3%Some other race
Median household income in 2022:
| East Campus: | $202,782 |
| San Jose: | $133,835 |
Distribution of median household income
![Distribution of median household income]()
- 12Less than $10,000
- 21$10,000 to $19,999
- 24$20,000 to $29,999
- 51$30,000 to $39,999
- 34$40,000 to $49,999
- 27$50,000 to $59,999
- 17$60,000 to $74,999
- 46$75,000 to $99,999
- 30$100,000 to $124,999
- 21$125,000 to $149,999
- 35$150,000 to $199,999
- 244$200,000 or more

Distribution of owner-occupied house/condo value
![Distribution of owner-occupied house/condo value]()
- 23$400,000 to $499,999
- 9$500,000 to $749,999
- 42$750,000 to $999,999
- 329$1,000,000 or more

Distribution of rent paid by renters
![Distribution of rent paid by renters]()
- 30$500 to $599
- 22$600 to $699
- 6$800 to $899
- 19$900 to $999
- 7$1,000 to $1,249
- 12$1,250 to $1,499
- 18$1,500 to $1,999
- 133$2,000 or more

Median rent in 2022:
| East Campus: | $3,286 |
| San Jose: | $2,001 |
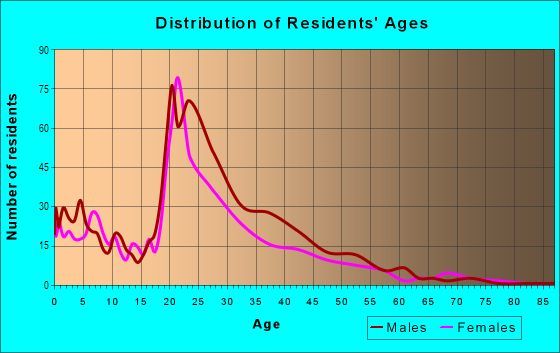
| Males: | 686 |
| Females: | 602 |
Males:
| This neighborhood: | 41.6 years |
| Whole city: | 37.6 years |
| This neighborhood: | 41.7 years |
| Whole city: | 39.1 years |
Average household size:
| East Campus: | 2.9 people |
| San Jose: | 2.9 people |
Percentage of family households:
| East Campus: | 53.1% |
| San Jose: | 49.9% |
| Here: | 64.6% |
| San Jose: | 53.0% |
Percentage of married-couple families with children (among all households):
| East Campus: | 29.5% |
| San Jose: | 25.8% |
Percentage of single-mother households (among all households):
| East Campus: | 5.3% |
| San Jose: | 5.2% |
Percentage of never married males 15 years old and over:
Percentage of never married females 15 years old and over:
| East Campus: | 16.8% |
| San Jose: | 20.9% |
Percentage of never married females 15 years old and over:
| East Campus: | 15.3% |
| city: | 16.7% |
Percentage of people that speak English not well or not at all:
| East Campus: | 1.3% |
| San Jose: | 11.4% |
Percentage of people born in this state:
Percentage of people born in another U.S. state:
Percentage of native residents but born outside the U.S.:
Percentage of foreign born residents:
| Here: | 54.5% |
| San Jose: | 46.1% |
Percentage of people born in another U.S. state:
| East Campus: | 20.0% |
| San Jose: | 10.4% |
Percentage of native residents but born outside the U.S.:
| Here: | 5.4% |
| city: | 1.7% |
Percentage of foreign born residents:
| Here: | 20.1% |
| San Jose: | 41.8% |
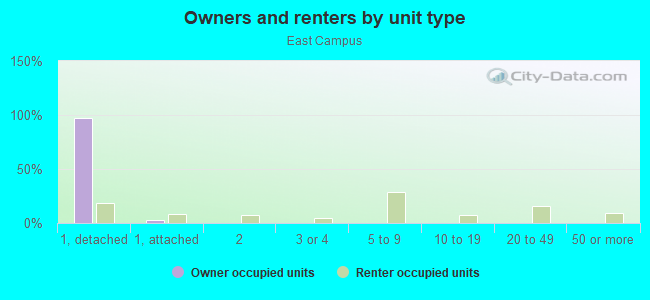
Owner-occupied
Renter-occupied

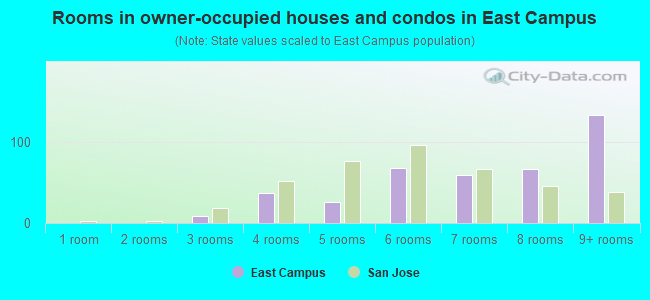
- Rooms in owner-occupied houses and condos in East Campus
- 01 room
- 02 rooms
- 93 rooms
- 374 rooms
- 265 rooms
- 686 rooms
- 597 rooms
- 668 rooms
- 1339+ rooms
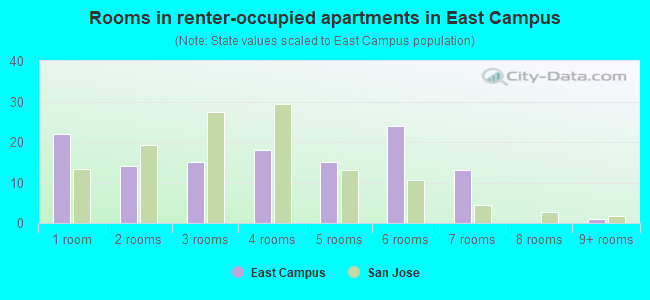
- Rooms in renter-occupied apartments in East Campus
- 221 room
- 142 rooms
- 153 rooms
- 184 rooms
- 155 rooms
- 246 rooms
- 137 rooms
- 08 rooms
- 19+ rooms
Owner-occupied
Renter-occupied
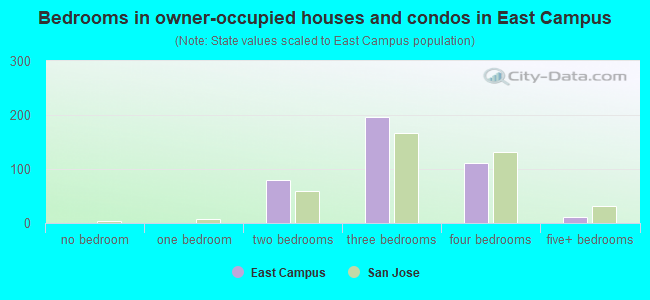
- Bedrooms in owner-occupied houses and condos in East Campus
- 0no bedroom
- 01 bedroom
- 792 bedrooms
- 1973 bedrooms
- 1124 bedrooms
- 115+ bedrooms
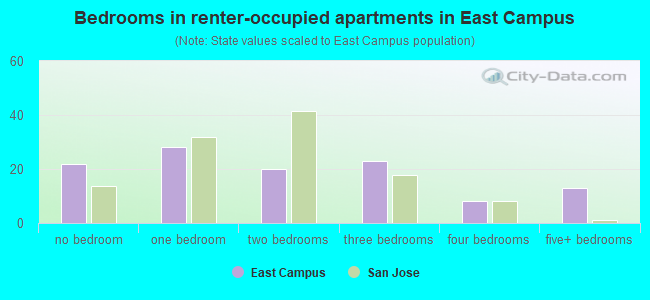
- Bedrooms in renter-occupied apartments in East Campus
- 22no bedroom
- 281 bedroom
- 202 bedrooms
- 233 bedrooms
- 84 bedrooms
- 135+ bedrooms
Average number of cars or other vehicles available in houses/condos:
Average number of cars or other vehicles available in apartments:
| This neighborhood: | |
| San Jose: |
Average number of cars or other vehicles available in apartments:
| Here: | 1.8 |
| city: | 1.6 |
Percentage of units with a mortgage:
| East Campus: | 83.5% |
| San Jose: | 66.9% |
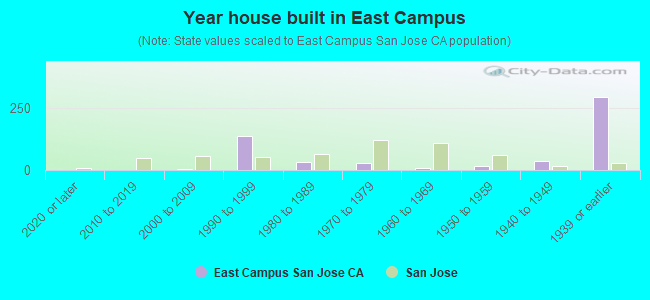
- Year house built in East Campus
- 02020 or later
- 02010 to 2019
- 52000 to 2009
- 1371990 to 1999
- 311980 to 1989
- 301970 to 1979
- 101960 to 1969
- 171950 to 1959
- 381940 to 1949
- 2911939 or earlier
City-data.com crime index for city in 2020 (higher means more crime):
| City: | 268.4 |
| U.S. average: | 219.5 |
Travel time to work (commute)
![Travel time to work (commute)]()
- 8Less than 5 minutes
- 795 to 9 minutes
- 13710 to 14 minutes
- 11415 to 19 minutes
- 8720 to 24 minutes
- 5225 to 29 minutes
- 6430 to 34 minutes
- 3535 to 39 minutes
- 1240 to 44 minutes
- 2045 to 59 minutes
- 3960 to 89 minutes
- 390 or more minutes

Means of transportation to work
![Means of transportation to work]()
- 38.3%249Drove a car alone
- 8.6%56Carpooled
- 3.1%20Bus
- 1.5%10Subway or elevated rail
- 5.1%33Long-distance train or commuter rail
- 2.3%15Light rail, streetcar or trolley
- 0.5%3Taxi
- 1.4%9Bicycle
- 15.7%102Walked
- 1.7%11Other means
- 38.9%253Worked at home

Time leaving home to go to work
![Time leaving home to go to work]()
- 512:00 a.m. to 4:59 a.m.
- 125:00 a.m. to 5:29 a.m.
- 335:30 a.m. to 5:59 a.m.
- 86:00 a.m. to 6:29 a.m.
- 386:30 a.m. to 6:59 a.m.
- 637:00 a.m. to 7:29 a.m.
- 1087:30 a.m. to 7:59 a.m.
- 1008:00 a.m. to 8:29 a.m.
- 738:30 a.m. to 8:59 a.m.
- 759:00 a.m. to 9:59 a.m.
- 5010:00 a.m. to 10:59 a.m.
- 1511:00 a.m. to 11:59 a.m.
- 6712:00 p.m. to 3:59 p.m.
- 164:00 p.m. to 11:59 p.m.

Occupations of males:
- Percentage of males in management occupations (except farmers):
Here: 16.2% city: 13.0%
- Percentage of males in business and financial operations occupations:
Here: 12.5% city: 4.6%
- Percentage of males in computer and mathematical occupations:
Here: 26.3% city: 13.6%
- Percentage of males in architecture and engineering occupations:
Here: 3.1% city: 10.2%
- Percentage of males in life, physical, and social science occupations:
Here: 6.3% city: 1.1%
- Percentage of males in community and social services occupations:
Here: 3.0% city: 0.8%
- Percentage of males in education, training, and library occupations:
Here: 7.2% city: 2.8%
- Percentage of males in service occupations:
Here: 14.0% city: 12.7%
- Percentage of males in sales and office occupations:
Here: 9.3% city: 12.8%
- Percentage of males in production occupations:
Here: 1.5% city: 5.5%
- Percentage of males in transportation occupations:
Here: 4.7% city: 3.6%
Occupations of females:
- Percentage of females in management occupations (except farmers):
Here: 16.1% city: 11.0%
- Percentage of females in business and financial operations occupations:
Here: 9.3% city: 8.6%
- Percentage of females in computer and mathematical occupations:
Here: 10.1% city: 5.4%
- Percentage of females in architecture and engineering occupations:
Here: 7.7% city: 2.8%
- Percentage of females in life, physical, and social science occupations:
Here: 5.2% city: 1.7%
- Percentage of females in legal occupations:
Here: 6.6% city: 1.3%
- Percentage of females in education, training, and library occupations:
Here: 15.6% city: 8.1%
- Percentage of females in arts, design, entertainment, sports, and media occupations:
Here: 5.5% city: 2.0%
- Percentage of females in healthcare practitioners and technical occupations:
Here: 7.5% city: 6.8%
- Percentage of females in service occupations:
Here: 12.5% city: 21.7%
- Percentage of females in sales and office occupations:
Here: 14.3% city: 22.0%
- Percentage of females in production occupations:
Here: 2.6% city: 4.0%
- Percentage of females in material moving occupations:
Here: 1.7% city: 1.5%
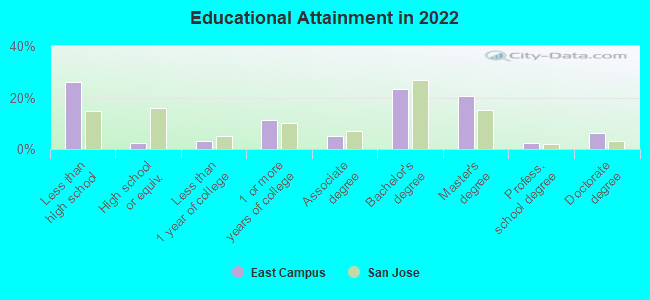
Education in this neighborhood (subdivision or community):
- Percentage of people 3 years and older in K-12 schools:
East Campus: 19.9% San Jose: 16.1%
- Percentage of people 3 years and older in undergraduate colleges:
East Campus: 5.9% San Jose: 6.5%
- Percentage of people 3 years and older in grad. or professional schools:
East Campus: 3.2% San Jose: 2.0%
- Percentage of students K-12 enrolled in private schools:
East Campus: 25.3% San Jose: 14.9%
Percentage of population below poverty level:
| East Campus: | 23.1% |
| San Jose: | 9.0% |
Median year renter moved in (as recorded in 2022):
| East Campus: | 2012 |
| San Jose: | 2020 |
Percentage of married-couple families with both working:
| East Campus: | 90.8% |
| San Jose: | 72.5% |
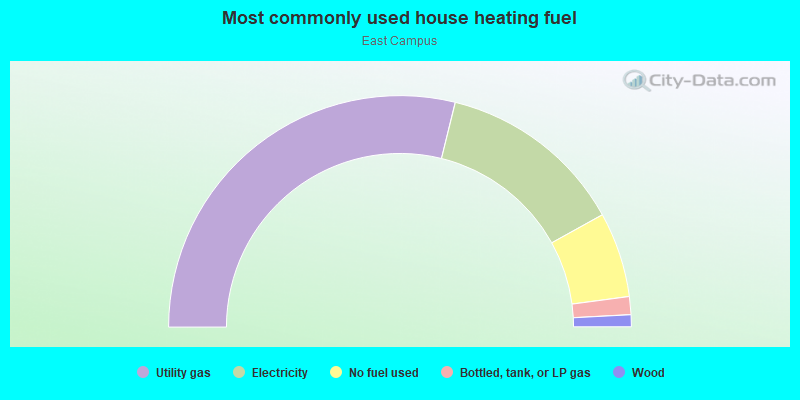
- 57.7%Utility gas
- 26.2%Electricity
- 11.9%No fuel used
- 2.5%Bottled, tank, or LP gas
- 1.7%Wood
Limited-access highways (interstate or state) in this neighborhood:
Sinclair Fwy (I- 280)
Length: 0.05 miles
Direction: E-W
Direction: E-W
Roads and streets:
S 11th St
Length: 0.80 miles
Directions: N-S, SE-NW, SW-NE
Address range: 200 to 799
Directions: N-S, SE-NW, SW-NE
Address range: 200 to 799
S 10th St
Length: 0.41 miles
Direction: SE-NW
Address range: 500 to 799
Direction: SE-NW
Address range: 500 to 799
E Virginia St
Length: 0.08 miles
Directions: E-W, SW-NE
Directions: E-W, SW-NE
Margaret St
Length: 0.08 miles
Direction: SW-NE
Address range: 452 to 499
Direction: SW-NE
Address range: 452 to 499
E William St
Length: 0.08 miles
Direction: SW-NE
Address range: 450 to 499
Direction: SW-NE
Address range: 450 to 499
E Reed St
Length: 0.08 miles
Direction: SW-NE
Address range: 450 to 499
Direction: SW-NE
Address range: 450 to 499