East Bay neighborhood in Albany, California (CA), 94706, 94710 detailed profile
Settings
X


Business Search - 14 Million verified businesses
Area: 0.375 square miles
Population: 1,662
Population density:
| East Bay: | 4,434 people per square mile |
| Albany: | 11,771 people per square mile |

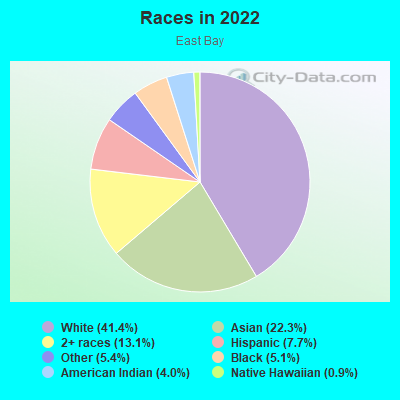
- 71741.4%White
- 38622.3%Asian
- 22713.1%Two or more races
- 1337.7%Hispanic or Latino
- 935.4%Some other race
- 885.1%Black
- 704.0%American Indian
- 160.9%Native Hawaiian and Other
Pacific Islander
Median household income in 2022:
| East Bay: | $137,670 |
| Albany: | $124,469 |
Distribution of median household income
![Distribution of median household income]()
- 24Less than $10,000
- 33$10,000 to $19,999
- 38$20,000 to $29,999
- 18$30,000 to $39,999
- 32$40,000 to $49,999
- 18$50,000 to $59,999
- 46$60,000 to $74,999
- 99$75,000 to $99,999
- 134$100,000 to $124,999
- 113$125,000 to $149,999
- 91$150,000 to $199,999
- 241$200,000 or more

Distribution of owner-occupied house/condo value
![Distribution of owner-occupied house/condo value]()
- 20$50,000 to $99,999
- 38$100,000 to $149,999
- 18$200,000 to $249,999
- 70$400,000 to $499,999
- 33$500,000 to $749,999
- 23$750,000 to $999,999
- 235$1,000,000 or more

Distribution of rent paid by renters
![Distribution of rent paid by renters]()
- 9$200 to $299
- 83$300 to $399
- 16$500 to $599
- 120$600 to $699
- 2$700 to $799
- 32$800 to $899
- 6$900 to $999
- 31$1,000 to $1,249
- 46$1,250 to $1,499
- 33$1,500 to $1,999
- 603$2,000 or more

Median rent in 2022:
| East Bay: | $2,965 |
| Albany: | $2,001 |
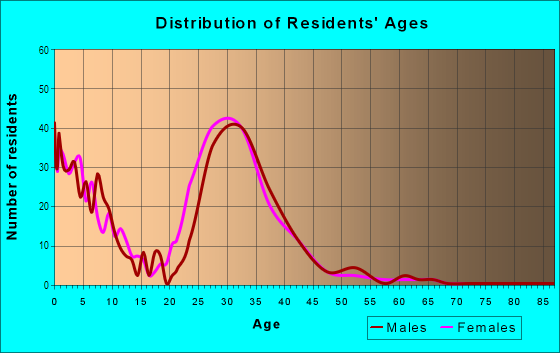
| Males: | 788 |
| Females: | 874 |
Males:
| This neighborhood: | 33.5 years |
| Whole city: | 36.7 years |
| This neighborhood: | 39.9 years |
| Whole city: | 37.8 years |
Average household size:
| East Bay: | 2.5 people |
| Albany: | 2.5 people |
Percentage of family households:
| East Bay: | 35.4% |
| Albany: | 53.9% |
| Here: | 29.1% |
| Albany: | 52.7% |
Percentage of married-couple families with children (among all households):
| East Bay: | 23.5% |
| Albany: | 30.7% |
Percentage of single-mother households (among all households):
| East Bay: | 27.4% |
| Albany: | 6.2% |
Percentage of never married males 15 years old and over:
Percentage of never married females 15 years old and over:
| East Bay: | 22.9% |
| Albany: | 15.4% |
Percentage of never married females 15 years old and over:
| East Bay: | 21.7% |
| city: | 16.2% |
Percentage of people that speak English not well or not at all:
| East Bay: | 0.9% |
| Albany: | 3.4% |
Percentage of people born in this state:
Percentage of people born in another U.S. state:
Percentage of native residents but born outside the U.S.:
Percentage of foreign born residents:
| Here: | 47.3% |
| Albany: | 46.0% |
Percentage of people born in another U.S. state:
| East Bay: | 30.1% |
| Albany: | 25.0% |
Percentage of native residents but born outside the U.S.:
| Here: | 2.1% |
| city: | 2.0% |
Percentage of foreign born residents:
| Here: | 20.5% |
| Albany: | 27.0% |
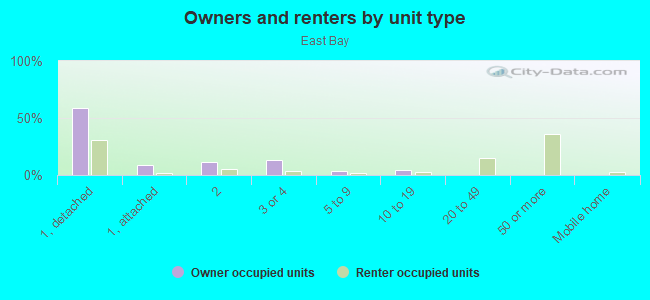
Owner-occupied
Renter-occupied

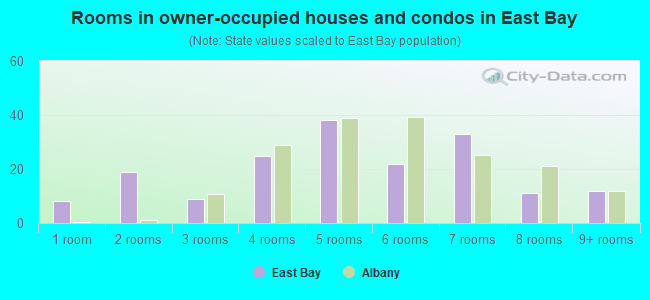
- Rooms in owner-occupied houses and condos in East Bay
- 81 room
- 192 rooms
- 93 rooms
- 254 rooms
- 385 rooms
- 226 rooms
- 337 rooms
- 118 rooms
- 129+ rooms
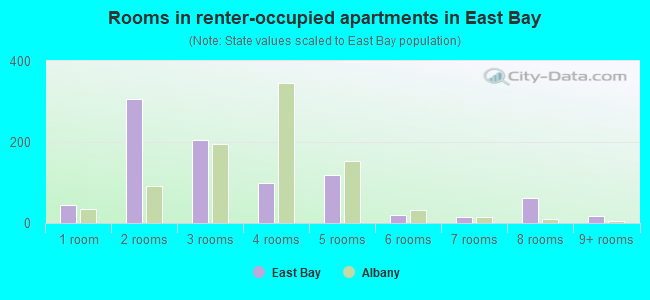
- Rooms in renter-occupied apartments in East Bay
- 451 room
- 3052 rooms
- 2043 rooms
- 984 rooms
- 1195 rooms
- 206 rooms
- 147 rooms
- 628 rooms
- 179+ rooms
Owner-occupied
Renter-occupied
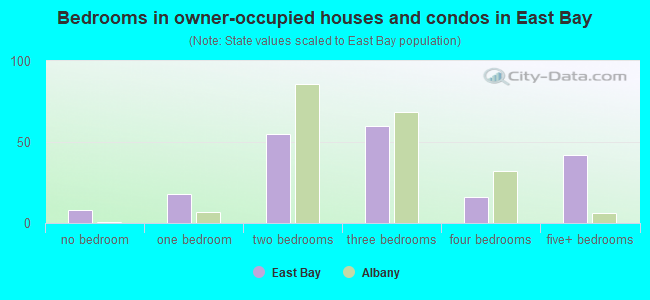
- Bedrooms in owner-occupied houses and condos in East Bay
- 8no bedroom
- 181 bedroom
- 552 bedrooms
- 603 bedrooms
- 164 bedrooms
- 425+ bedrooms
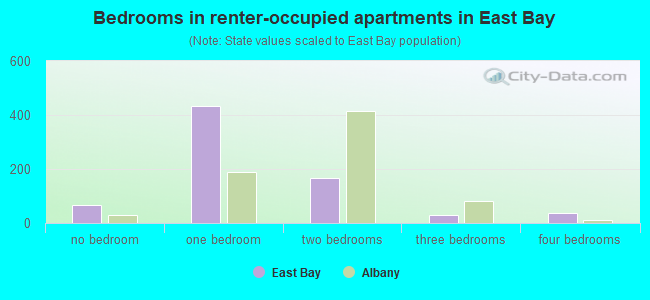
- Bedrooms in renter-occupied apartments in East Bay
- 65no bedroom
- 4331 bedroom
- 1672 bedrooms
- 283 bedrooms
- 364 bedrooms
- 05+ bedrooms
Average number of cars or other vehicles available in houses/condos:
Average number of cars or other vehicles available in apartments:
| This neighborhood: | 1.4 |
| Albany: | 1.7 |
Average number of cars or other vehicles available in apartments:
| Here: | 1.1 |
| city: | 1.2 |
Percentage of units with a mortgage:
| East Bay: | 65.2% |
| Albany: | 63.1% |
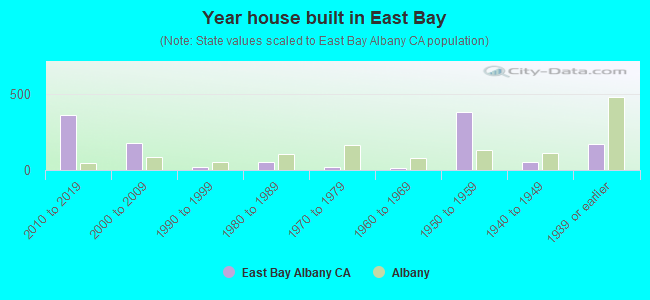
- Year house built in East Bay
- 02020 or later
- 3632010 to 2019
- 1812000 to 2009
- 231990 to 1999
- 521980 to 1989
- 171970 to 1979
- 121960 to 1969
- 3841950 to 1959
- 521940 to 1949
- 1731939 or earlier
City-data.com crime index for city in 2020 (higher means more crime):
| City: | 155.8 |
| U.S. average: | 219.5 |
Travel time to work (commute)
![Travel time to work (commute)]()
- 5Less than 5 minutes
- 325 to 9 minutes
- 2410 to 14 minutes
- 5215 to 19 minutes
- 3920 to 24 minutes
- 925 to 29 minutes
- 3830 to 34 minutes
- 1035 to 39 minutes
- 1640 to 44 minutes
- 7045 to 59 minutes
- 3260 to 89 minutes
- 1690 or more minutes

Means of transportation to work
![Means of transportation to work]()
- 30.6%364Drove a car alone
- 8.5%101Carpooled
- 12.3%146Bus
- 4.6%55Subway or elevated rail
- 1.3%15Long-distance train or commuter rail
- 2.0%24Light rail, streetcar or trolley
- 0.5%6Ferryboat
- 4.4%52Taxi
- 3.7%44Motorcycle
- 1.0%12Bicycle
- 13.3%158Walked
- 1.1%13Other means
- 26.5%316Worked at home

Time leaving home to go to work
![Time leaving home to go to work]()
- 2912:00 a.m. to 4:59 a.m.
- 15:00 a.m. to 5:29 a.m.
- 145:30 a.m. to 5:59 a.m.
- 86:00 a.m. to 6:29 a.m.
- 246:30 a.m. to 6:59 a.m.
- 187:00 a.m. to 7:29 a.m.
- 417:30 a.m. to 7:59 a.m.
- 508:00 a.m. to 8:29 a.m.
- 388:30 a.m. to 8:59 a.m.
- 489:00 a.m. to 9:59 a.m.
- 1710:00 a.m. to 10:59 a.m.
- 711:00 a.m. to 11:59 a.m.
- 1712:00 p.m. to 3:59 p.m.
- 114:00 p.m. to 11:59 p.m.

Occupations of males:
- Percentage of males in management occupations (except farmers):
Here: 19.1% city: 14.2%
- Percentage of males in business and financial operations occupations:
Here: 7.7% city: 5.6%
- Percentage of males in computer and mathematical occupations:
Here: 24.5% city: 9.7%
- Percentage of males in architecture and engineering occupations:
Here: 3.2% city: 7.5%
- Percentage of males in life, physical, and social science occupations:
Here: 9.7% city: 7.6%
- Percentage of males in education, training, and library occupations:
Here: 7.2% city: 12.0%
- Percentage of males in arts, design, entertainment, sports, and media occupations:
Here: 6.1% city: 6.3%
- Percentage of males in healthcare practitioners and technical occupations:
Here: 2.0% city: 2.3%
- Percentage of males in service occupations:
Here: 6.1% city: 6.5%
- Percentage of males in sales and office occupations:
Here: 7.7% city: 14.4%
- Percentage of males in transportation occupations:
Here: 4.8% city: 1.5%
Occupations of females:
- Percentage of females in management occupations (except farmers):
Here: 8.7% city: 10.5%
- Percentage of females in business and financial operations occupations:
Here: 9.9% city: 13.0%
- Percentage of females in computer and mathematical occupations:
Here: 5.4% city: 4.3%
- Percentage of females in architecture and engineering occupations:
Here: 4.7% city: 3.7%
- Percentage of females in life, physical, and social science occupations:
Here: 3.6% city: 5.6%
- Percentage of females in education, training, and library occupations:
Here: 16.2% city: 15.8%
- Percentage of females in arts, design, entertainment, sports, and media occupations:
Here: 11.2% city: 5.8%
- Percentage of females in healthcare practitioners and technical occupations:
Here: 5.7% city: 7.9%
- Percentage of females in service occupations:
Here: 9.8% city: 12.1%
- Percentage of females in sales and office occupations:
Here: 21.3% city: 13.8%
- Percentage of females in production occupations:
Here: 1.2% city: 0.5%
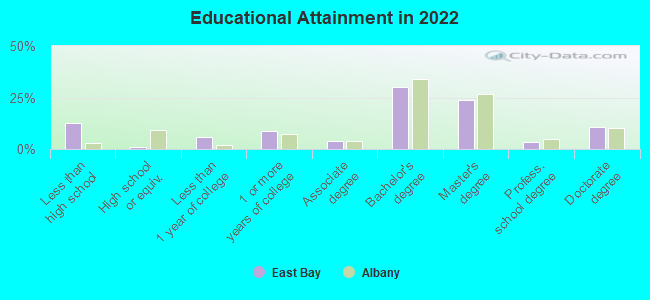
Education in this neighborhood (subdivision or community):
- Percentage of people 3 years and older in K-12 schools:
East Bay: 21.9% Albany: 18.5%
- Percentage of people 3 years and older in undergraduate colleges:
East Bay: 3.0% Albany: 6.9%
- Percentage of people 3 years and older in grad. or professional schools:
East Bay: 5.8% Albany: 5.0%
- Percentage of students K-12 enrolled in private schools:
East Bay: 89.2% Albany: 7.7%
Percentage of population below poverty level:
| East Bay: | 6.5% |
| Albany: | 9.1% |
Median year owner moved in (as recorded in 2022):
Median year renter moved in (as recorded in 2022):
| East Bay: | 2006 |
| Albany: | 2002 |
Median year renter moved in (as recorded in 2022):
| East Bay: | 2015 |
| Albany: | 2018 |
Percentage of married-couple families with both working:
| East Bay: | 218.9% |
| Albany: | 74.0% |
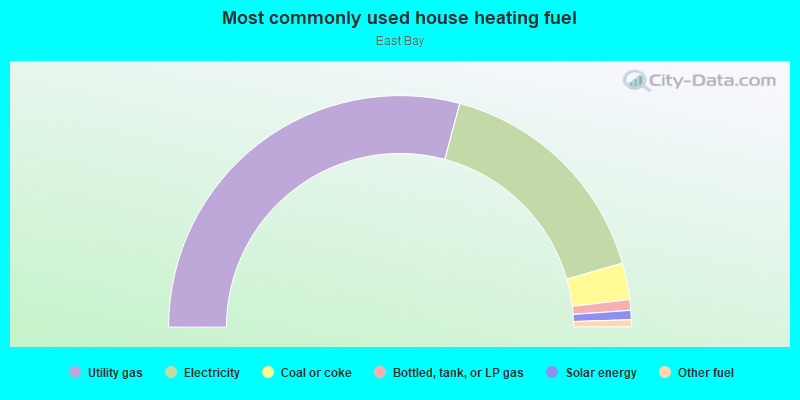
- 58.4%Utility gas
- 32.8%Electricity
- 5.1%Coal or coke
- 1.5%Bottled, tank, or LP gas
- 1.3%Solar energy
- 1.0%Other fuel
Highways in this neighborhood:
State Hwy 123 (San Pablo Ave)
Length: 0.99 miles
Direction: N-S
Address range: 967 to 1299
Direction: N-S
Address range: 967 to 1299
Roads and streets:
Gilman St
Length: 1.37 miles
Direction: E-W
Address range: 700 to 1103
Direction: E-W
Address range: 700 to 1103
Buchanan St
Length: 1.03 miles
Directions: E-W, SW-NE
Address range: 480 to 1099
Directions: E-W, SW-NE
Address range: 480 to 1099
Harrison St
Length: 0.80 miles
Directions: E-W, N-S, SE-NW
Address range: 516 to 1103
Directions: E-W, N-S, SE-NW
Address range: 516 to 1103
Eastshore Hwy (Eastshore Frontage Rd)
Length: 0.63 miles
Directions: N-S, SE-NW
Address range: 1000 to 1295
Directions: N-S, SE-NW
Address range: 1000 to 1295
6th St
Length: 0.55 miles
Directions: N-S, SE-NW
Address range: 1112 to 1299
Directions: N-S, SE-NW
Address range: 1112 to 1299
Red Oak Ave
Length: 0.46 miles
Directions: E-W, N-S, SW-NE
Directions: E-W, N-S, SW-NE
8th St
Length: 0.38 miles
Direction: N-S
Address range: 1101 to 1299
Direction: N-S
Address range: 1101 to 1299
2nd St
Length: 0.37 miles
Directions: N-S, SE-NW
Address range: 1000 to 1295
Directions: N-S, SE-NW
Address range: 1000 to 1295
9th St
Length: 0.33 miles
Directions: N-S, SE-NW
Address range: 1160 to 1299
Directions: N-S, SE-NW
Address range: 1160 to 1299
10th St
Length: 0.30 miles
Directions: N-S, SE-NW
Address range: 1100 to 1299
Directions: N-S, SE-NW
Address range: 1100 to 1299
I- 80 E
Length: 0.30 miles
Direction: N-S
Direction: N-S
Ohlone Ave
Length: 0.28 miles
Direction: E-W
Direction: E-W
Marin Ave
Length: 0.23 miles
Directions: E-W, SE-NW
Address range: 1000 to 1103
Directions: E-W, SE-NW
Address range: 1000 to 1103
5th St
Length: 0.23 miles
Direction: N-S
Address range: 1100 to 1299
Direction: N-S
Address range: 1100 to 1299
Monroe St
Length: 0.20 miles
Direction: E-W
Address range: 1000 to 1099
Direction: E-W
Address range: 1000 to 1099
I- 80
Length: 0.18 miles
Directions: N-S, SW-NE
Directions: N-S, SW-NE
4th St
Length: 0.17 miles
Direction: N-S
Address range: 1100 to 1299
Direction: N-S
Address range: 1100 to 1299
Liberty Ship Way
Length: 0.16 miles
Direction: N-S
Direction: N-S
Kinkhead Way
Length: 0.15 miles
Direction: N-S
Direction: N-S
Kwat Gulf Way
Length: 0.15 miles
Directions: E-W, N-S
Directions: E-W, N-S
Gooding Dr
Length: 0.14 miles
Direction: N-S
Direction: N-S
7th St
Length: 0.13 miles
Directions: N-S, SE-NW
Address range: 1200 to 1299
Directions: N-S, SE-NW
Address range: 1200 to 1299
Jackson St
Length: 0.12 miles
Direction: N-S
Address range: 1000 to 1199
Direction: N-S
Address range: 1000 to 1199
Park Way
Length: 0.08 miles
Direction: E-W
Address range: 600 to 799
Direction: E-W
Address range: 600 to 799
8th
Length: 0.07 miles
Direction: SE-NW
Direction: SE-NW
Cedarwood Ln
Length: 0.07 miles
Direction: N-S
Address range: 1200 to 1299
Direction: N-S
Address range: 1200 to 1299
3rd St (Union Pacific RR, Union Pacific RR, 3rd Street)
Length: 0.06 miles
Direction: N-S
Direction: N-S
Railroad features:
Union Pacific RR
Length: 0.55 miles
Direction: N-S
Direction: N-S
Other features:
Codornices Crk
Length: 0.80 miles
Directions: E-W, SW-NE
Directions: E-W, SW-NE