Dunbar-Broadway neighborhood in Baltimore, Maryland (MD), 21231, 21205 detailed profile
Settings
X

Business Search - 14 Million verified businesses
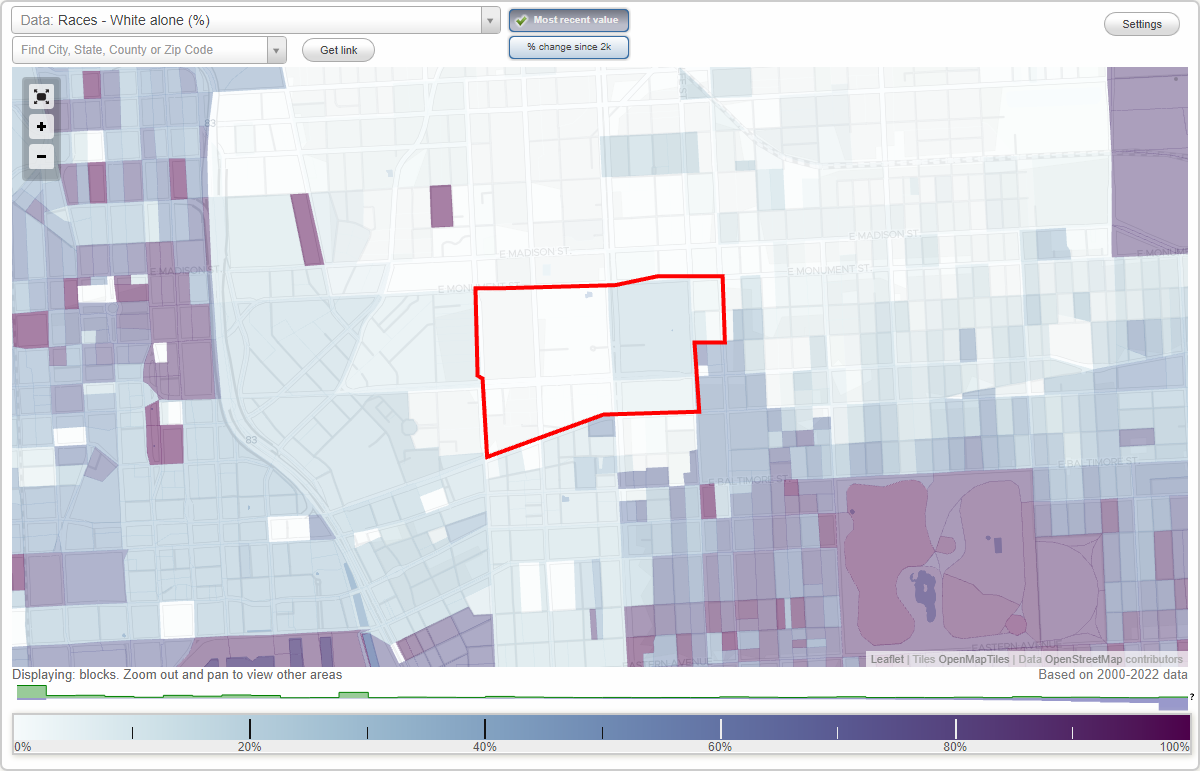
Area: 0.172 square miles
Population: 2,751
Population density:
| Dunbar-Broadway: | 15,970 people per square mile |
| Baltimore: | 7,053 people per square mile |

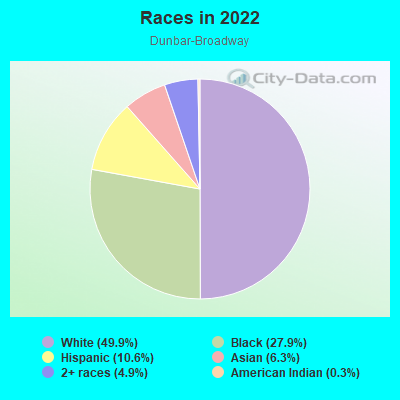
- 1,53349.9%White
- 85727.9%Black
- 32610.6%Hispanic or Latino
- 1956.3%Asian
- 1524.9%Two or more races
- 80.3%American Indian
Distribution of median household income
![Distribution of median household income]()
- 83Less than $10,000
- 96$10,000 to $19,999
- 75$20,000 to $29,999
- 139$30,000 to $39,999
- 171$40,000 to $49,999
- 88$50,000 to $59,999
- 102$60,000 to $74,999
- 85$75,000 to $99,999
- 191$100,000 to $124,999
- 158$125,000 to $149,999
- 90$150,000 to $199,999
- 62$200,000 or more

Distribution of owner-occupied house/condo value
![Distribution of owner-occupied house/condo value]()
- 16Less than $50,000
- 30$50,000 to $99,999
- 69$100,000 to $149,999
- 191$150,000 to $199,999
- 338$200,000 to $249,999
- 125$250,000 to $299,999
- 98$300,000 to $399,999
- 51$400,000 to $499,999

Distribution of rent paid by renters
![Distribution of rent paid by renters]()
- 107Less than $100
- 59$100 to $199
- 213$200 to $299
- 73$300 to $399
- 72$400 to $499
- 137$500 to $599
- 109$600 to $699
- 149$700 to $799
- 85$800 to $899
- 132$900 to $999
- 83$1,000 to $1,249
- 67$1,250 to $1,499
- 420$1,500 to $1,999
- 132$2,000 or more

Median rent in 2022:
| Dunbar-Broadway: | $831 |
| Baltimore: | $1,043 |
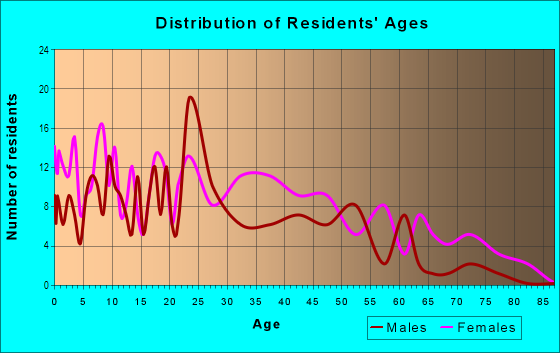
| Males: | 1,015 |
| Females: | 1,736 |
Males:
| This neighborhood: | 50.0 years |
| Whole city: | 35.0 years |
| This neighborhood: | 44.3 years |
| Whole city: | 38.2 years |
Average household size:
| Dunbar-Broadway: | 2.0 people |
| Baltimore: | 2.2 people |
Percentage of family households:
| Dunbar-Broadway: | 22.6% |
| Baltimore: | 34.2% |
| Here: | 27.0% |
| Baltimore: | 23.3% |
Percentage of married-couple families with children (among all households):
| Dunbar-Broadway: | 43.5% |
| Baltimore: | 22.4% |
Percentage of single-mother households (among all households):
| Dunbar-Broadway: | 77.0% |
| Baltimore: | 18.7% |
Percentage of never married males 15 years old and over:
Percentage of never married females 15 years old and over:
| Dunbar-Broadway: | 17.0% |
| Baltimore: | 25.1% |
Percentage of never married females 15 years old and over:
| Dunbar-Broadway: | 28.8% |
| city: | 27.5% |
Percentage of people that speak English not well or not at all:
| Dunbar-Broadway: | 5.1% |
| Baltimore: | 2.3% |
Percentage of people born in this state:
Percentage of people born in another U.S. state:
Percentage of native residents but born outside the U.S.:
Percentage of foreign born residents:
| Here: | 43.9% |
| Baltimore: | 64.4% |
Percentage of people born in another U.S. state:
| Dunbar-Broadway: | 36.6% |
| Baltimore: | 25.0% |
Percentage of native residents but born outside the U.S.:
| Here: | 2.6% |
| city: | 0.9% |
Percentage of foreign born residents:
| Here: | 16.9% |
| Baltimore: | 9.7% |
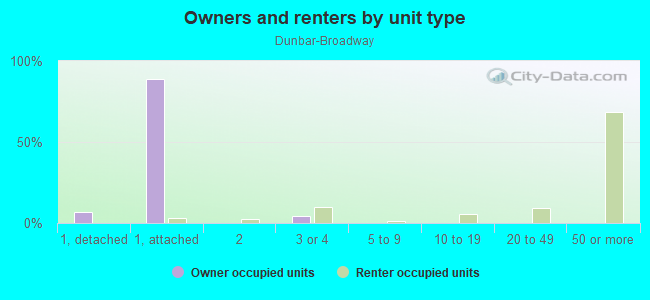
Owner-occupied
Renter-occupied

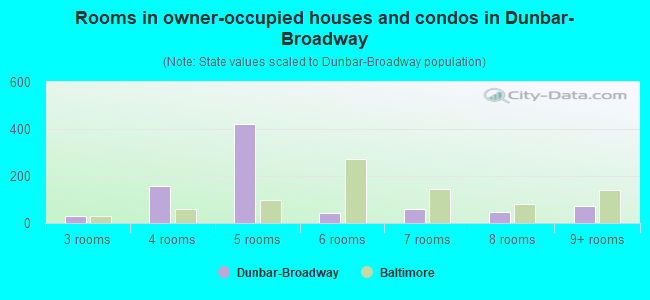
- Rooms in owner-occupied houses and condos in Dunbar-Broadway
- 01 room
- 02 rooms
- 313 rooms
- 1594 rooms
- 4225 rooms
- 426 rooms
- 587 rooms
- 468 rooms
- 739+ rooms
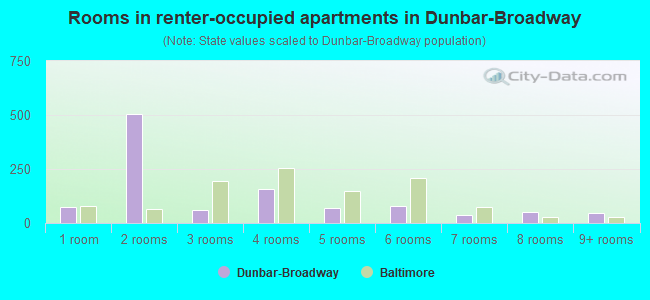
- Rooms in renter-occupied apartments in Dunbar-Broadway
- 731 room
- 5042 rooms
- 603 rooms
- 1594 rooms
- 715 rooms
- 816 rooms
- 387 rooms
- 528 rooms
- 469+ rooms
Owner-occupied
Renter-occupied
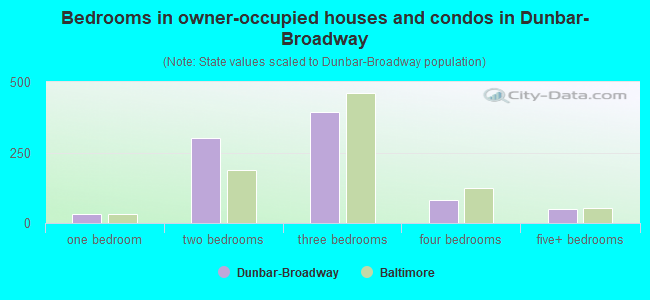
- Bedrooms in owner-occupied houses and condos in Dunbar-Broadway
- 0no bedroom
- 311 bedroom
- 3022 bedrooms
- 3943 bedrooms
- 804 bedrooms
- 505+ bedrooms
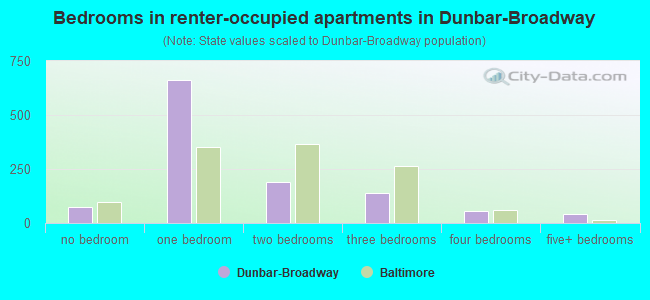
- Bedrooms in renter-occupied apartments in Dunbar-Broadway
- 73no bedroom
- 6621 bedroom
- 1892 bedrooms
- 1383 bedrooms
- 554 bedrooms
- 415+ bedrooms
Average number of cars or other vehicles available in houses/condos:
Average number of cars or other vehicles available in apartments:
| This neighborhood: | |
| Baltimore: |
Average number of cars or other vehicles available in apartments:
| Here: | |
| city: |
Percentage of units with a mortgage:
| Dunbar-Broadway: | 57.2% |
| Baltimore: | 64.3% |
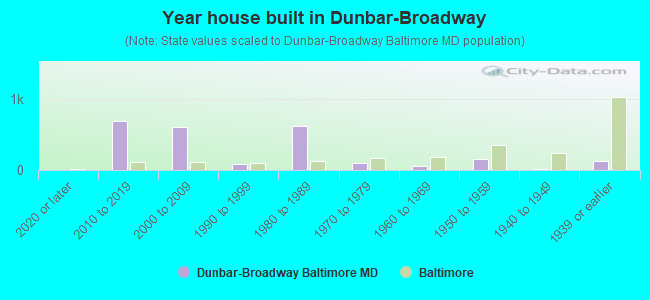
- Year house built in Dunbar-Broadway
- 02020 or later
- 6832010 to 2019
- 5982000 to 2009
- 781990 to 1999
- 6191980 to 1989
- 981970 to 1979
- 591960 to 1969
- 1471950 to 1959
- 161940 to 1949
- 1231939 or earlier
Travel time to work (commute)
![Travel time to work (commute)]()
- 16Less than 5 minutes
- 665 to 9 minutes
- 13110 to 14 minutes
- 13615 to 19 minutes
- 11620 to 24 minutes
- 1325 to 29 minutes
- 3630 to 34 minutes
- 635 to 39 minutes
- 1640 to 44 minutes
- 15345 to 59 minutes
- 1760 to 89 minutes
- 890 or more minutes

Means of transportation to work
![Means of transportation to work]()
- 50.2%691Drove a car alone
- 11.3%155Carpooled
- 6.0%82Bus
- 5.8%80Subway or elevated rail
- 1.4%19Long-distance train or commuter rail
- 20.4%281Walked
- 1.4%19Other means
- 21.6%297Worked at home

Time leaving home to go to work
![Time leaving home to go to work]()
- 7312:00 a.m. to 4:59 a.m.
- 235:00 a.m. to 5:29 a.m.
- 345:30 a.m. to 5:59 a.m.
- 316:00 a.m. to 6:29 a.m.
- 336:30 a.m. to 6:59 a.m.
- 437:00 a.m. to 7:29 a.m.
- 1247:30 a.m. to 7:59 a.m.
- 1248:00 a.m. to 8:29 a.m.
- 378:30 a.m. to 8:59 a.m.
- 229:00 a.m. to 9:59 a.m.
- 2110:00 a.m. to 10:59 a.m.
- 2511:00 a.m. to 11:59 a.m.
- 7212:00 p.m. to 3:59 p.m.
- 144:00 p.m. to 11:59 p.m.

Occupations of males:
- Percentage of males in management occupations (except farmers):
Here: 16.1% city: 10.7%
- Percentage of males in business and financial operations occupations:
Here: 3.6% city: 5.9%
- Percentage of males in architecture and engineering occupations:
Here: 8.4% city: 2.9%
- Percentage of males in life, physical, and social science occupations:
Here: 1.5% city: 2.3%
- Percentage of males in legal occupations:
Here: 5.4% city: 1.8%
- Percentage of males in education, training, and library occupations:
Here: 11.0% city: 5.4%
- Percentage of males in arts, design, entertainment, sports, and media occupations:
Here: 4.0% city: 2.8%
- Percentage of males in healthcare practitioners and technical occupations:
Here: 30.2% city: 4.0%
- Percentage of males in service occupations:
Here: 2.4% city: 14.7%
- Percentage of males in sales and office occupations:
Here: 11.4% city: 14.2%
- Percentage of males in construction, extraction, and maintenance occupations:
Here: 6.0% city: 5.6%
- Percentage of males in production occupations:
Here: 3.7% city: 4.2%
- Percentage of males in material moving occupations:
Here: 2.1% city: 7.0%
Occupations of females:
- Percentage of females in management occupations (except farmers):
Here: 4.5% city: 10.1%
- Percentage of females in business and financial operations occupations:
Here: 13.7% city: 6.6%
- Percentage of females in architecture and engineering occupations:
Here: 42.6% city: 0.9%
- Percentage of females in life, physical, and social science occupations:
Here: 10.4% city: 2.5%
- Percentage of females in community and social services occupations:
Here: 6.4% city: 3.6%
- Percentage of females in legal occupations:
Here: 9.0% city: 1.8%
- Percentage of females in education, training, and library occupations:
Here: 11.6% city: 10.7%
- Percentage of females in healthcare practitioners and technical occupations:
Here: 36.1% city: 9.8%
- Percentage of females in service occupations:
Here: 3.7% city: 20.4%
- Percentage of females in sales and office occupations:
Here: 4.6% city: 22.3%
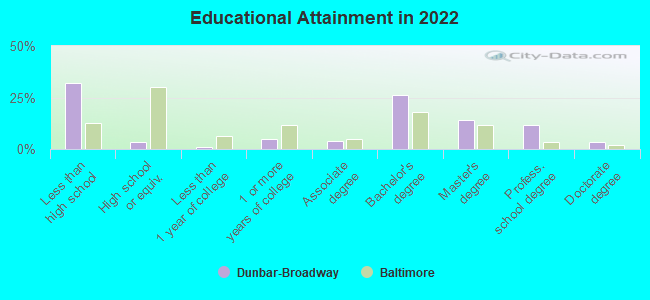
Education in this neighborhood (subdivision or community):
- Percentage of people 3 years and older in K-12 schools:
Dunbar-Broadway: 34.5% Baltimore: 14.7%
- Percentage of people 3 years and older in undergraduate colleges:
Dunbar-Broadway: 5.9% Baltimore: 6.0%
- Percentage of people 3 years and older in grad. or professional schools:
Dunbar-Broadway: 15.1% Baltimore: 2.8%
- Percentage of students K-12 enrolled in private schools:
Dunbar-Broadway: 3.3% Baltimore: 12.7%
Percentage of population below poverty level:
| Dunbar-Broadway: | 26.6% |
| Baltimore: | 18.5% |
Median year renter moved in (as recorded in 2022):
| Dunbar-Broadway: | 2014 |
| Baltimore: | 2019 |
Percentage of married-couple families with both working:
| Dunbar-Broadway: | 40.0% |
| Baltimore: | 79.2% |
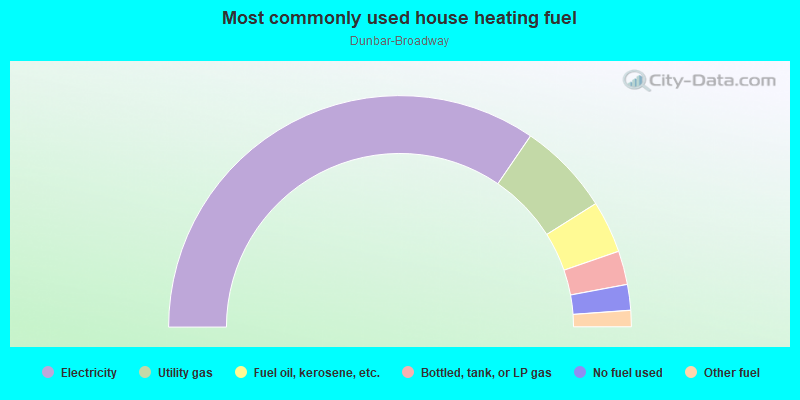
- 69.1%Electricity
- 13.0%Utility gas
- 7.3%Fuel oil, kerosene, etc.
- 4.7%Bottled, tank, or LP gas
- 3.6%No fuel used
- 2.3%Other fuel
Highways in this neighborhood:
US Hwy 40 (Orleans St)
Length: 0.57 miles
Direction: E-W
Address range: 1320 to 1899
Direction: E-W
Address range: 1320 to 1899
Roads and streets:
Jefferson St
Length: 0.43 miles
Direction: E-W
Address range: 1500 to 1999
Direction: E-W
Address range: 1500 to 1999
E Fayette St
Length: 0.41 miles
Direction: E-W
Address range: 1328 to 1844
Direction: E-W
Address range: 1328 to 1844
Low St
Length: 0.39 miles
Directions: E-W, SE-NW
Directions: E-W, SE-NW
N Wolfe St
Length: 0.31 miles
Direction: N-S
Address range: 200 to 699
Direction: N-S
Address range: 200 to 699
N Caroline St
Length: 0.27 miles
Direction: N-S
Address range: 100 to 601
Direction: N-S
Address range: 100 to 601
Mc Elderry St
Length: 0.21 miles
Direction: E-W
Address range: 1500 to 1999
Direction: E-W
Address range: 1500 to 1999
May Ct
Length: 0.20 miles
Direction: E-W
Address range: 1400 to 1699
Direction: E-W
Address range: 1400 to 1699
Mullikin Ct
Length: 0.20 miles
Direction: E-W
Address range: 1400 to 1699
Direction: E-W
Address range: 1400 to 1699
N Bond St
Length: 0.18 miles
Direction: N-S
Address range: 200 to 699
Direction: N-S
Address range: 200 to 699
N Broadway
Length: 0.18 miles
Direction: N-S
Address range: 203 to 599
Direction: N-S
Address range: 203 to 599
E Lexington St
Length: 0.16 miles
Directions: E-W, SE-NW
Address range: 1400 to 1599
Directions: E-W, SE-NW
Address range: 1400 to 1599
E Monument St
Length: 0.15 miles
Direction: E-W
Address range: 1767 to 1913
Direction: E-W
Address range: 1767 to 1913
Mullikin St
Length: 0.13 miles
Directions: E-W, N-S
Address range: 1600 to 1699
Directions: E-W, N-S
Address range: 1600 to 1699
New Jefferson St
Length: 0.12 miles
Directions: E-W, N-S, SW-NE
Directions: E-W, N-S, SW-NE
N Central Ave
Length: 0.11 miles
Direction: N-S
Address range: 466 to 574
Direction: N-S
Address range: 466 to 574
N Eden St
Length: 0.10 miles
Direction: N-S
Address range: 100 to 399
Direction: N-S
Address range: 100 to 399
Beale Ct
Length: 0.09 miles
Direction: N-S
Address range: 200 to 299
Direction: N-S
Address range: 200 to 299
N Dallas Ct
Length: 0.08 miles
Direction: N-S
Address range: 200 to 399
Direction: N-S
Address range: 200 to 399
N Washington St
Length: 0.07 miles
Direction: N-S
Address range: 500 to 599
Direction: N-S
Address range: 500 to 599
Silver Ct
Length: 0.07 miles
Direction: N-S
Address range: 200 to 299
Direction: N-S
Address range: 200 to 299
N Spring Ct
Length: 0.07 miles
Direction: N-S
Address range: 200 to 299
Direction: N-S
Address range: 200 to 299
N Chapel St
Length: 0.07 miles
Direction: N-S
Address range: 500 to 599
Direction: N-S
Address range: 500 to 599
Douglas Ct
Length: 0.07 miles
Direction: N-S
Address range: 200 to 299
Direction: N-S
Address range: 200 to 299
Bethel Ct
Length: 0.06 miles
Directions: E-W, N-S
Address range: 200 to 299
Directions: E-W, N-S
Address range: 200 to 299