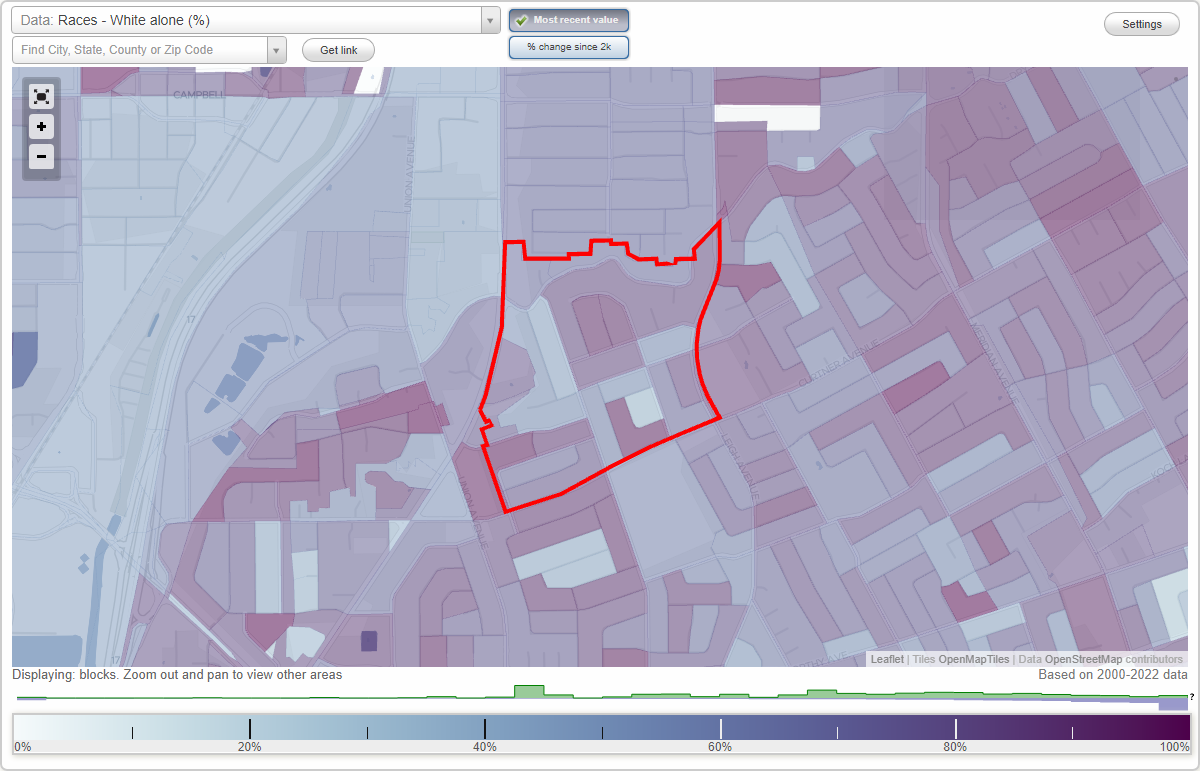
Dry Creek neighborhood in San Jose, California (CA), 95008, 95124 detailed profile
Settings
X

Business Search - 14 Million verified businesses
Area: 0.260 square miles
Population: 2,446
Population density:
| Dry Creek: | 9,415 people per square mile |
| San Jose: | 5,554 people per square mile |

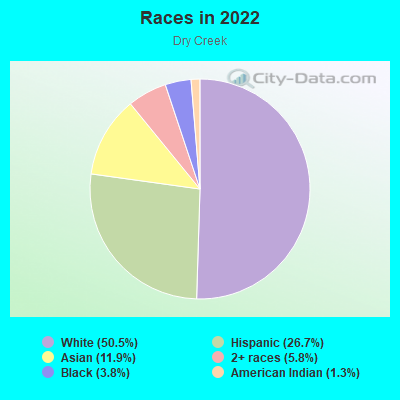
- 1,27250.5%White
- 67326.7%Hispanic or Latino
- 30011.9%Asian
- 1475.8%Two or more races
- 963.8%Black
- 331.3%American Indian
Median household income in 2022:
| Dry Creek: | $168,701 |
| San Jose: | $133,835 |
Distribution of median household income
![Distribution of median household income]()
- 59Less than $10,000
- 107$10,000 to $19,999
- 120$20,000 to $29,999
- 43$30,000 to $39,999
- 15$40,000 to $49,999
- 64$50,000 to $59,999
- 42$60,000 to $74,999
- 132$75,000 to $99,999
- 106$100,000 to $124,999
- 66$125,000 to $149,999
- 95$150,000 to $199,999
- 268$200,000 or more

Distribution of owner-occupied house/condo value
![Distribution of owner-occupied house/condo value]()
- 11Less than $50,000
- 16$500,000 to $749,999
- 17$750,000 to $999,999
- 452$1,000,000 or more

Distribution of rent paid by renters
![Distribution of rent paid by renters]()
- 11$700 to $799
- 5$900 to $999
- 72$1,000 to $1,249
- 105$1,500 to $1,999
- 411$2,000 or more

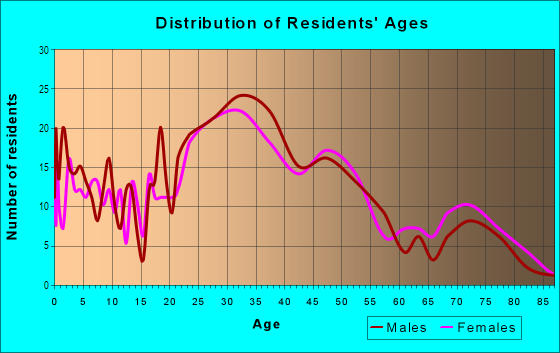
| Males: | 1,076 |
| Females: | 1,370 |
Males:
| This neighborhood: | 42.6 years |
| Whole city: | 37.6 years |
| This neighborhood: | 37.9 years |
| Whole city: | 39.1 years |
Average household size:
| Dry Creek: | 16.4 people |
| San Jose: | 2.9 people |
Percentage of family households:
| Dry Creek: | 56.7% |
| San Jose: | 49.9% |
| Here: | 52.4% |
| San Jose: | 53.0% |
Percentage of married-couple families with children (among all households):
| Dry Creek: | 31.5% |
| San Jose: | 25.8% |
Percentage of single-mother households (among all households):
| Dry Creek: | 5.1% |
| San Jose: | 5.2% |
Percentage of never married males 15 years old and over:
Percentage of never married females 15 years old and over:
| Dry Creek: | 6.6% |
| San Jose: | 20.9% |
Percentage of never married females 15 years old and over:
| Dry Creek: | 22.6% |
| city: | 16.7% |
Percentage of people that speak English not well or not at all:
| Dry Creek: | 8.3% |
| San Jose: | 11.4% |
Percentage of people born in this state:
Percentage of people born in another U.S. state:
Percentage of native residents but born outside the U.S.:
Percentage of foreign born residents:
| Here: | 56.4% |
| San Jose: | 46.1% |
Percentage of people born in another U.S. state:
| Dry Creek: | 13.5% |
| San Jose: | 10.4% |
Percentage of native residents but born outside the U.S.:
| Here: | 0.4% |
| city: | 1.7% |
Percentage of foreign born residents:
| Here: | 29.6% |
| San Jose: | 41.8% |
Owner-occupied
Renter-occupied

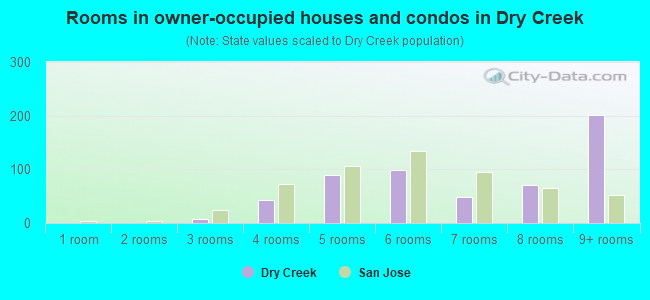
- Rooms in owner-occupied houses and condos in Dry Creek
- 01 room
- 02 rooms
- 83 rooms
- 434 rooms
- 895 rooms
- 996 rooms
- 497 rooms
- 708 rooms
- 2019+ rooms
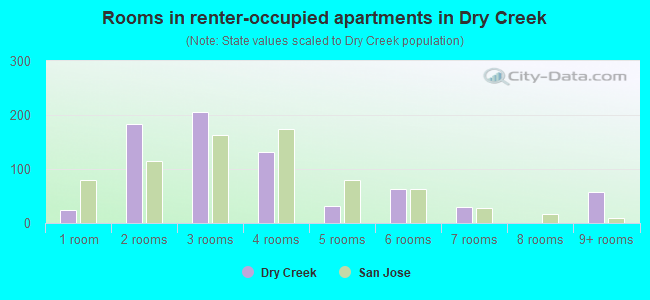
- Rooms in renter-occupied apartments in Dry Creek
- 241 room
- 1832 rooms
- 2063 rooms
- 1324 rooms
- 325 rooms
- 636 rooms
- 307 rooms
- 08 rooms
- 579+ rooms
Owner-occupied
Renter-occupied
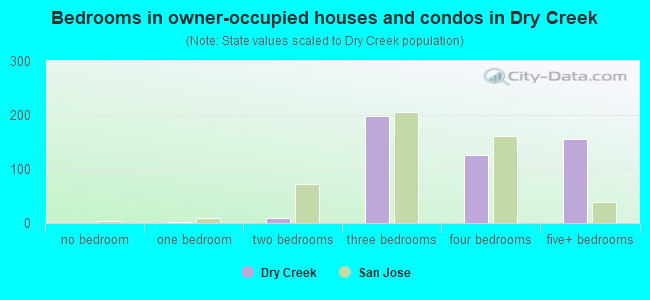
- Bedrooms in owner-occupied houses and condos in Dry Creek
- 0no bedroom
- 21 bedroom
- 92 bedrooms
- 1983 bedrooms
- 1264 bedrooms
- 1555+ bedrooms
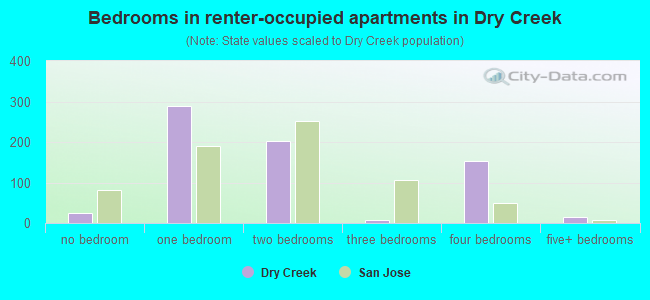
- Bedrooms in renter-occupied apartments in Dry Creek
- 24no bedroom
- 2881 bedroom
- 2022 bedrooms
- 83 bedrooms
- 1524 bedrooms
- 145+ bedrooms
Average number of cars or other vehicles available in houses/condos:
Average number of cars or other vehicles available in apartments:
| This neighborhood: | 2.3 |
| San Jose: | 2.3 |
Average number of cars or other vehicles available in apartments:
| Here: | 2.3 |
| city: | 1.6 |
Percentage of units with a mortgage:
| Dry Creek: | 86.4% |
| San Jose: | 66.9% |
Average estimated value of detached houses in 2022 (62.4% of all units):
| Dry Creek: | $1,496,000 |
| San Jose: | $1,532,815 |
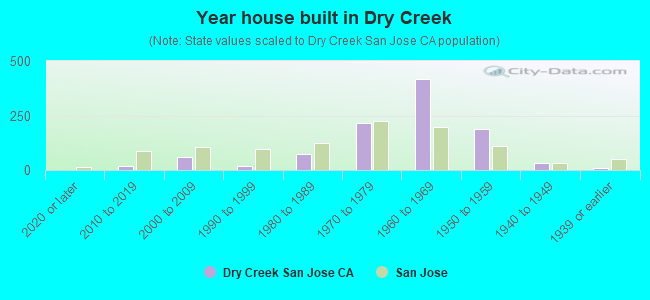
- Year house built in Dry Creek
- 02020 or later
- 202010 to 2019
- 612000 to 2009
- 181990 to 1999
- 751980 to 1989
- 2171970 to 1979
- 4181960 to 1969
- 1881950 to 1959
- 311940 to 1949
- 71939 or earlier
City-data.com crime index for city in 2020 (higher means more crime):
| City: | 268.4 |
| U.S. average: | 219.5 |
Travel time to work (commute)
![Travel time to work (commute)]()
- 13Less than 5 minutes
- 545 to 9 minutes
- 7610 to 14 minutes
- 17615 to 19 minutes
- 14720 to 24 minutes
- 10025 to 29 minutes
- 12330 to 34 minutes
- 235 to 39 minutes
- 5540 to 44 minutes
- 15945 to 59 minutes
- 1860 to 89 minutes
- 3290 or more minutes

Means of transportation to work
![Means of transportation to work]()
- 57.4%776Drove a car alone
- 10.1%137Carpooled
- 13.5%182Bus
- 2.0%27Long-distance train or commuter rail
- 0.8%11Light rail, streetcar or trolley
- 0.5%7Bicycle
- 10.1%137Walked
- 0.2%3Other means
- 21.1%286Worked at home

Time leaving home to go to work
![Time leaving home to go to work]()
- 4412:00 a.m. to 4:59 a.m.
- 365:00 a.m. to 5:29 a.m.
- 245:30 a.m. to 5:59 a.m.
- 216:00 a.m. to 6:29 a.m.
- 856:30 a.m. to 6:59 a.m.
- 797:00 a.m. to 7:29 a.m.
- 1717:30 a.m. to 7:59 a.m.
- 1068:00 a.m. to 8:29 a.m.
- 418:30 a.m. to 8:59 a.m.
- 1699:00 a.m. to 9:59 a.m.
- 7910:00 a.m. to 10:59 a.m.
- 1111:00 a.m. to 11:59 a.m.
- 8212:00 p.m. to 3:59 p.m.
- 244:00 p.m. to 11:59 p.m.

Occupations of males:
- Percentage of males in management occupations (except farmers):
Here: 38.9% city: 13.0%
- Percentage of males in business and financial operations occupations:
Here: 4.3% city: 4.6%
- Percentage of males in computer and mathematical occupations:
Here: 6.8% city: 13.6%
- Percentage of males in architecture and engineering occupations:
Here: 3.3% city: 10.2%
- Percentage of males in education, training, and library occupations:
Here: 3.9% city: 2.8%
- Percentage of males in arts, design, entertainment, sports, and media occupations:
Here: 1.6% city: 1.8%
- Percentage of males in healthcare practitioners and technical occupations:
Here: 9.1% city: 2.0%
- Percentage of males in service occupations:
Here: 7.2% city: 12.7%
- Percentage of males in sales and office occupations:
Here: 7.4% city: 12.8%
- Percentage of males in construction, extraction, and maintenance occupations:
Here: 9.4% city: 7.8%
- Percentage of males in production occupations:
Here: 5.7% city: 5.5%
- Percentage of males in transportation occupations:
Here: 2.0% city: 3.6%
- Percentage of males in material moving occupations:
Here: 1.8% city: 3.1%
Occupations of females:
- Percentage of females in management occupations (except farmers):
Here: 6.1% city: 11.0%
- Percentage of females in business and financial operations occupations:
Here: 4.1% city: 8.6%
- Percentage of females in computer and mathematical occupations:
Here: 1.4% city: 5.4%
- Percentage of females in architecture and engineering occupations:
Here: 1.7% city: 2.8%
- Percentage of females in community and social services occupations:
Here: 1.1% city: 1.8%
- Percentage of females in legal occupations:
Here: 4.3% city: 1.3%
- Percentage of females in education, training, and library occupations:
Here: 8.9% city: 8.1%
- Percentage of females in arts, design, entertainment, sports, and media occupations:
Here: 5.4% city: 2.0%
- Percentage of females in healthcare practitioners and technical occupations:
Here: 16.0% city: 6.8%
- Percentage of females in service occupations:
Here: 11.8% city: 21.7%
- Percentage of females in sales and office occupations:
Here: 29.4% city: 22.0%
- Percentage of females in production occupations:
Here: 6.4% city: 4.0%
- Percentage of females in material moving occupations:
Here: 3.4% city: 1.5%
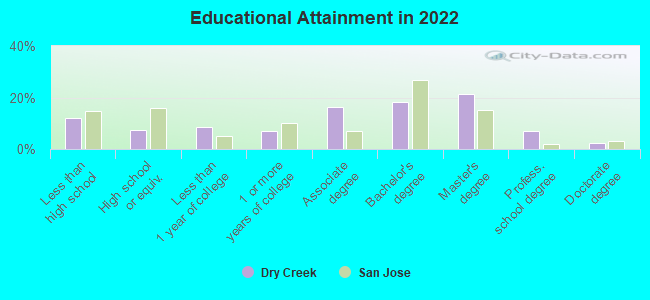
Education in this neighborhood (subdivision or community):
- Percentage of people 3 years and older in K-12 schools:
Dry Creek: 23.6% San Jose: 16.1%
- Percentage of people 3 years and older in undergraduate colleges:
Dry Creek: 9.1% San Jose: 6.5%
- Percentage of people 3 years and older in grad. or professional schools:
Dry Creek: 1.4% San Jose: 2.0%
- Percentage of students K-12 enrolled in private schools:
Dry Creek: 41.8% San Jose: 14.9%
Percentage of population below poverty level:
| Dry Creek: | 7.3% |
| San Jose: | 9.0% |
Median year owner moved in (as recorded in 2022):
| Dry Creek: | 2007 |
| San Jose: | 2008 |
Percentage of married-couple families with both working:
| Dry Creek: | 90.8% |
| San Jose: | 72.5% |
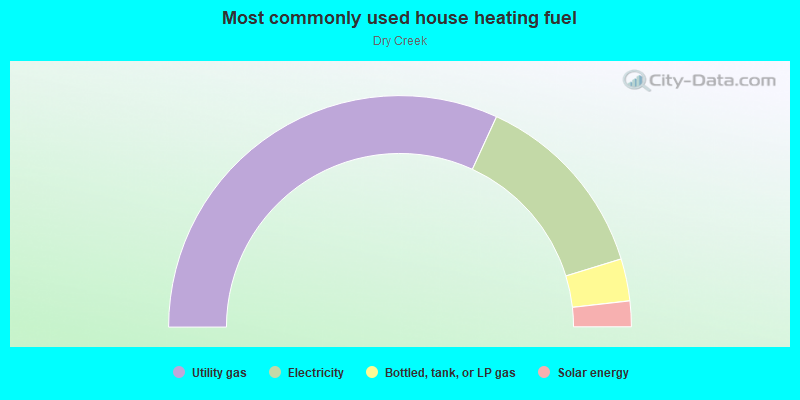
- 63.7%Utility gas
- 26.8%Electricity
- 5.9%Bottled, tank, or LP gas
- 3.6%Solar energy
Roads and streets:
Dry Creek Rd
Length: 0.57 miles
Directions: E-W, N-S, SE-NW, SW-NE
Address range: 1124 to 1998
Directions: E-W, N-S, SE-NW, SW-NE
Address range: 1124 to 1998
Harris Ave
Length: 0.51 miles
Directions: E-W, N-S, SW-NE
Address range: 1850 to 1999
Directions: E-W, N-S, SW-NE
Address range: 1850 to 1999
Gunar Dr
Length: 0.51 miles
Directions: E-W, N-S, SE-NW, SW-NE
Address range: 2200 to 2599
Directions: E-W, N-S, SE-NW, SW-NE
Address range: 2200 to 2599
New Jersey Ave
Length: 0.46 miles
Directions: N-S, SE-NW
Address range: 2300 to 2599
Directions: N-S, SE-NW
Address range: 2300 to 2599
Shulman Ave
Length: 0.39 miles
Direction: E-W
Address range: 1800 to 1999
Direction: E-W
Address range: 1800 to 1999
Leigh Ave
Length: 0.34 miles
Directions: N-S, SE-NW, SW-NE
Address range: 2234 to 2499
Directions: N-S, SE-NW, SW-NE
Address range: 2234 to 2499
Schrader Dr
Length: 0.30 miles
Directions: E-W, N-S, SW-NE
Address range: 1900 to 1999
Directions: E-W, N-S, SW-NE
Address range: 1900 to 1999
Kirby Way
Length: 0.28 miles
Directions: E-W, N-S, SE-NW, SW-NE
Address range: 1900 to 1999
Directions: E-W, N-S, SE-NW, SW-NE
Address range: 1900 to 1999
Pauline Dr
Length: 0.23 miles
Directions: N-S, SE-NW
Address range: 2300 to 2399
Directions: N-S, SE-NW
Address range: 2300 to 2399
Curtner Ave
Length: 0.21 miles
Directions: E-W, SW-NE
Address range: 1900 to 1949
Directions: E-W, SW-NE
Address range: 1900 to 1949
St Lawrence Dr
Length: 0.20 miles
Directions: N-S, SE-NW
Address range: 2400 to 2599
Directions: N-S, SE-NW
Address range: 2400 to 2599
Elden Dr
Length: 0.17 miles
Direction: E-W
Address range: 1900 to 1978
Direction: E-W
Address range: 1900 to 1978
Somersworth Dr
Length: 0.15 miles
Direction: E-W
Address range: 1900 to 1999
Direction: E-W
Address range: 1900 to 1999
Price Way
Length: 0.14 miles
Directions: N-S, SE-NW, SW-NE
Address range: 2300 to 2399
Directions: N-S, SE-NW, SW-NE
Address range: 2300 to 2399
Schubert Ave
Length: 0.12 miles
Direction: SE-NW
Address range: 2400 to 2499
Direction: SE-NW
Address range: 2400 to 2499
Hocking Way
Length: 0.10 miles
Directions: N-S, SE-NW
Address range: 2600 to 2699
Directions: N-S, SE-NW
Address range: 2600 to 2699
Quebec Way
Length: 0.08 miles
Direction: E-W
Address range: 1900 to 1999
Direction: E-W
Address range: 1900 to 1999
Ontario Dr
Length: 0.08 miles
Direction: SE-NW
Address range: 2400 to 2599
Direction: SE-NW
Address range: 2400 to 2599
Ben Hur Ct
Length: 0.07 miles
Directions: N-S, SE-NW
Address range: 2300 to 2399
Directions: N-S, SE-NW
Address range: 2300 to 2399
Gladys Way
Length: 0.06 miles
Direction: E-W
Address range: 1800 to 1899
Direction: E-W
Address range: 1800 to 1899
Horace Ave
Length: 0.06 miles
Directions: N-S, SE-NW
Address range: 2500 to 2599
Directions: N-S, SE-NW
Address range: 2500 to 2599
Kayla Ct
Length: 0.06 miles
Direction: SE-NW
Address range: 2300 to 2399
Direction: SE-NW
Address range: 2300 to 2399
Dry Creek Ct
Length: 0.04 miles
Directions: N-S, SE-NW
Address range: 2200 to 2299
Directions: N-S, SE-NW
Address range: 2200 to 2299
Cavalier Ct
Length: 0.04 miles
Direction: N-S
Address range: 1800 to 1899
Direction: N-S
Address range: 1800 to 1899
Dry Creek
Length: 0.03 miles
Directions: E-W, SW-NE
Directions: E-W, SW-NE