Drake (Fuller) neighborhood in San Jose, California (CA), 95125, 95126 detailed profile
Settings
X

Business Search - 14 Million verified businesses
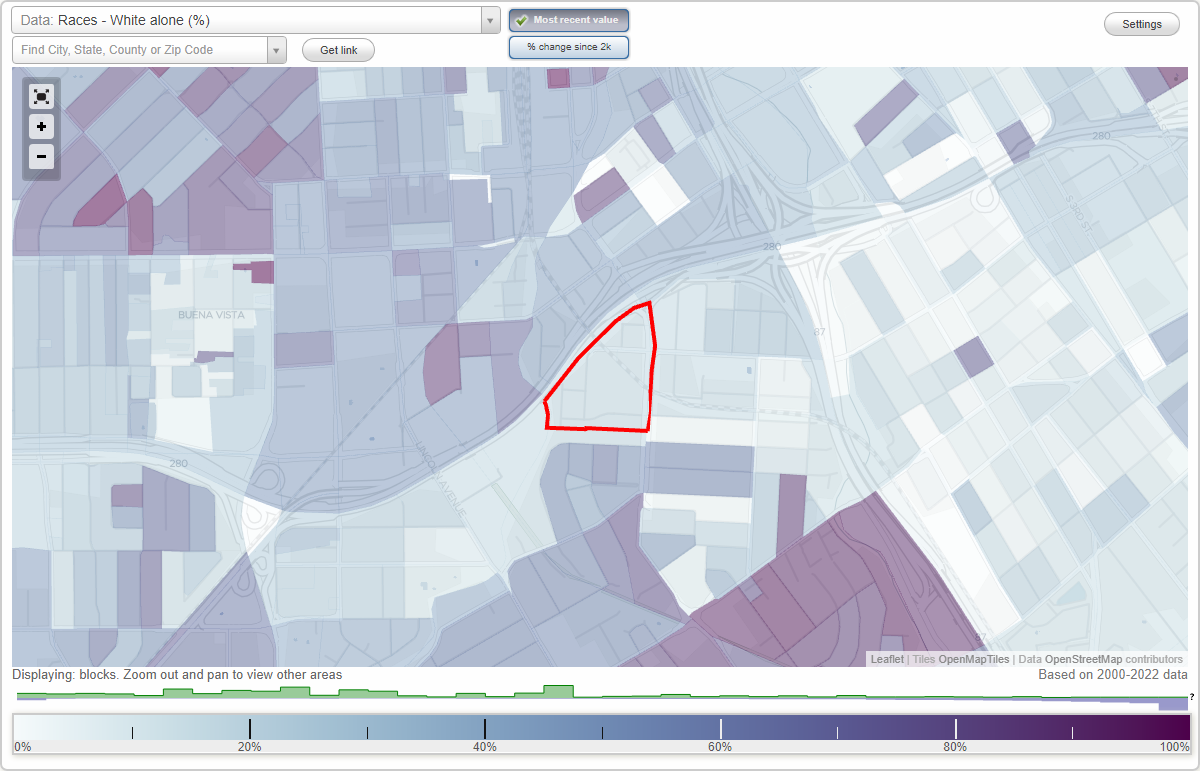
Area: 0.051 square miles
Population: 630
Population density:
| Drake (Fuller): | 12,305 people per square mile |
| San Jose: | 5,554 people per square mile |

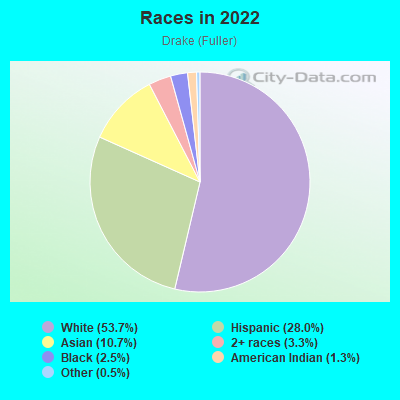
- 33853.7%White
- 17628.0%Hispanic or Latino
- 6710.7%Asian
- 213.3%Two or more races
- 162.5%Black
- 81.3%American Indian
- 30.5%Some other race
Median household income in 2022:
| Drake (Fuller): | $166,656 |
| San Jose: | $133,835 |
Distribution of median household income
![Distribution of median household income]()
- 8Less than $10,000
- 5$10,000 to $19,999
- 4$20,000 to $29,999
- 17$30,000 to $39,999
- 4$40,000 to $49,999
- 8$50,000 to $59,999
- 11$60,000 to $74,999
- 27$75,000 to $99,999
- 25$100,000 to $124,999
- 8$125,000 to $149,999
- 18$150,000 to $199,999
- 107$200,000 or more

Distribution of owner-occupied house/condo value
![Distribution of owner-occupied house/condo value]()
- 1$100,000 to $149,999
- 1$300,000 to $399,999
- 3$500,000 to $749,999
- 17$750,000 to $999,999
- 135$1,000,000 or more

Distribution of rent paid by renters
![Distribution of rent paid by renters]()
- 4$500 to $599
- 2$1,000 to $1,249
- 2$1,250 to $1,499
- 36$1,500 to $1,999
- 58$2,000 or more

Median rent in 2022:
| Drake (Fuller): | $2,055 |
| San Jose: | $2,001 |
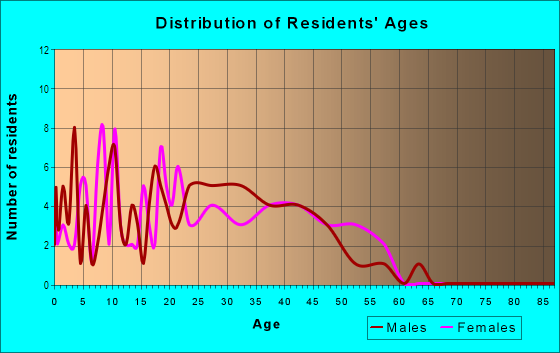
| Males: | 303 |
| Females: | 327 |
Males:
| This neighborhood: | 37.4 years |
| Whole city: | 37.6 years |
| This neighborhood: | 36.5 years |
| Whole city: | 39.1 years |
Average household size:
| Drake (Fuller): | 3.0 people |
| San Jose: | 2.9 people |
Percentage of family households:
| Drake (Fuller): | 60.8% |
| San Jose: | 49.9% |
| Here: | 50.0% |
| San Jose: | 53.0% |
Percentage of married-couple families with children (among all households):
| Drake (Fuller): | 25.5% |
| San Jose: | 25.8% |
Percentage of single-mother households (among all households):
| Drake (Fuller): | 10.6% |
| San Jose: | 5.2% |
Percentage of never married males 15 years old and over:
Percentage of never married females 15 years old and over:
| Drake (Fuller): | 14.4% |
| San Jose: | 20.9% |
Percentage of never married females 15 years old and over:
| Drake (Fuller): | 22.3% |
| city: | 16.7% |
Percentage of people that speak English not well or not at all:
| Drake (Fuller): | 500.0% |
| San Jose: | 11.4% |
Percentage of people born in this state:
Percentage of people born in another U.S. state:
Percentage of native residents but born outside the U.S.:
Percentage of foreign born residents:
| Here: | 60.7% |
| San Jose: | 46.1% |
Percentage of people born in another U.S. state:
| Drake (Fuller): | 14.1% |
| San Jose: | 10.4% |
Percentage of native residents but born outside the U.S.:
| Here: | 1.4% |
| city: | 1.7% |
Percentage of foreign born residents:
| Here: | 23.8% |
| San Jose: | 41.8% |
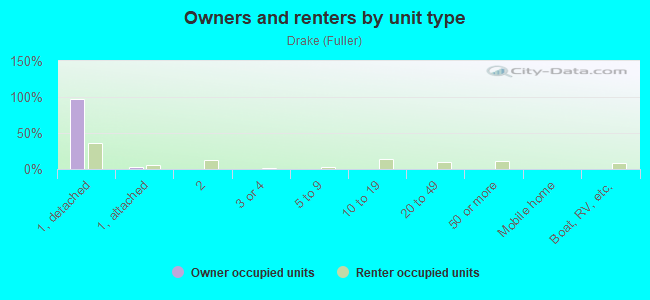
Owner-occupied
Renter-occupied

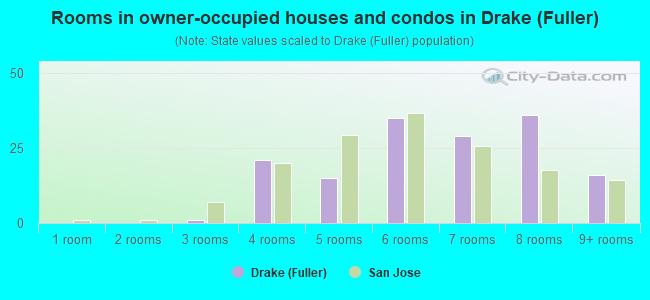
- Rooms in owner-occupied houses and condos in Drake <
> - 01 room
- 02 rooms
- 13 rooms
- 214 rooms
- 155 rooms
- 356 rooms
- 297 rooms
- 368 rooms
- 169+ rooms
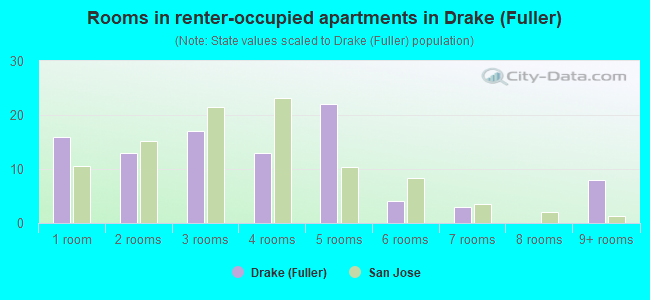
- Rooms in renter-occupied apartments in Drake <
> - 161 room
- 132 rooms
- 173 rooms
- 134 rooms
- 225 rooms
- 46 rooms
- 37 rooms
- 08 rooms
- 89+ rooms
Owner-occupied
Renter-occupied
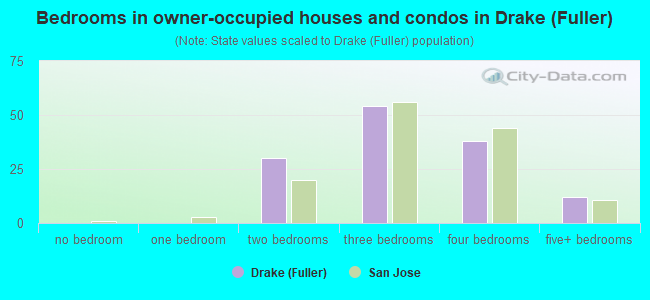
- Bedrooms in owner-occupied houses and condos in Drake <
> - 0no bedroom
- 01 bedroom
- 302 bedrooms
- 543 bedrooms
- 384 bedrooms
- 125+ bedrooms
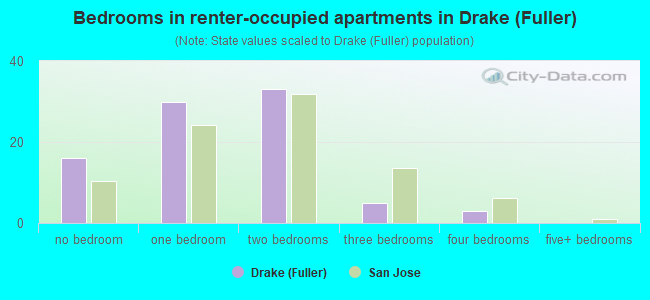
- Bedrooms in renter-occupied apartments in Drake <
> - 16no bedroom
- 301 bedroom
- 332 bedrooms
- 53 bedrooms
- 34 bedrooms
- 05+ bedrooms
Average number of cars or other vehicles available in houses/condos:
Average number of cars or other vehicles available in apartments:
| This neighborhood: | 2.5 |
| San Jose: | 2.3 |
Average number of cars or other vehicles available in apartments:
| Here: | 1.6 |
| city: | 1.6 |
Percentage of units with a mortgage:
| Drake (Fuller): | 84.7% |
| San Jose: | 66.9% |
Housing prices:
- Average estimated value of detached houses in 2022 (70.2% of all units):
Drake (Fuller): $1,194,056 San Jose: $1,532,815
- Average estimated value of townhouses or other attached units in 2022 (1.2% of all units):
This neighborhood: $889,543 city: $1,024,857
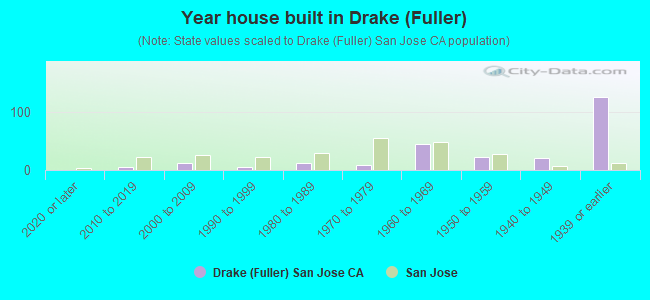
- Year house built in Drake <
> - 02020 or later
- 52010 to 2019
- 132000 to 2009
- 51990 to 1999
- 121980 to 1989
- 81970 to 1979
- 451960 to 1969
- 221950 to 1959
- 201940 to 1949
- 1261939 or earlier
City-data.com crime index for city in 2020 (higher means more crime):
| City: | 268.4 |
| U.S. average: | 219.5 |
Travel time to work (commute)
![Travel time to work (commute)]()
- 95 to 9 minutes
- 1510 to 14 minutes
- 1715 to 19 minutes
- 3020 to 24 minutes
- 325 to 29 minutes
- 1330 to 34 minutes
- 735 to 39 minutes
- 540 to 44 minutes
- 745 to 59 minutes
- 560 to 89 minutes

Means of transportation to work
![Means of transportation to work]()
- 61.1%186Drove a car alone
- 5.3%16Carpooled
- 0.3%1Bicycle
- 33.2%101Worked at home

Time leaving home to go to work
![Time leaving home to go to work]()
- 112:00 a.m. to 4:59 a.m.
- 35:00 a.m. to 5:29 a.m.
- 15:30 a.m. to 5:59 a.m.
- 86:00 a.m. to 6:29 a.m.
- 136:30 a.m. to 6:59 a.m.
- 187:00 a.m. to 7:29 a.m.
- 107:30 a.m. to 7:59 a.m.
- 198:00 a.m. to 8:29 a.m.
- 178:30 a.m. to 8:59 a.m.
- 89:00 a.m. to 9:59 a.m.
- 410:00 a.m. to 10:59 a.m.
- 612:00 p.m. to 3:59 p.m.
- 14:00 p.m. to 11:59 p.m.

Occupations of males:
- Percentage of males in management occupations (except farmers):
Here: 16.7% city: 13.0%
- Percentage of males in business and financial operations occupations:
Here: 4.7% city: 4.6%
- Percentage of males in computer and mathematical occupations:
Here: 5.2% city: 13.6%
- Percentage of males in architecture and engineering occupations:
Here: 18.0% city: 10.2%
- Percentage of males in life, physical, and social science occupations:
Here: 2.7% city: 1.1%
- Percentage of males in community and social services occupations:
Here: 1.6% city: 0.8%
- Percentage of males in arts, design, entertainment, sports, and media occupations:
Here: 9.5% city: 1.8%
- Percentage of males in healthcare practitioners and technical occupations:
Here: 4.5% city: 2.0%
- Percentage of males in service occupations:
Here: 8.4% city: 12.7%
- Percentage of males in sales and office occupations:
Here: 16.8% city: 12.8%
- Percentage of males in construction, extraction, and maintenance occupations:
Here: 8.7% city: 7.8%
- Percentage of males in material moving occupations:
Here: 1.1% city: 3.1%
Occupations of females:
- Percentage of females in management occupations (except farmers):
Here: 20.3% city: 11.0%
- Percentage of females in business and financial operations occupations:
Here: 7.3% city: 8.6%
- Percentage of females in computer and mathematical occupations:
Here: 2.2% city: 5.4%
- Percentage of females in life, physical, and social science occupations:
Here: 2.0% city: 1.7%
- Percentage of females in legal occupations:
Here: 706.5% city: 1.3%
- Percentage of females in education, training, and library occupations:
Here: 11.9% city: 8.1%
- Percentage of females in arts, design, entertainment, sports, and media occupations:
Here: 370.1% city: 2.0%
- Percentage of females in healthcare practitioners and technical occupations:
Here: 19.9% city: 6.8%
- Percentage of females in service occupations:
Here: 2.6% city: 21.7%
- Percentage of females in sales and office occupations:
Here: 25.5% city: 22.0%
- Percentage of females in material moving occupations:
Here: 7.0% city: 1.5%
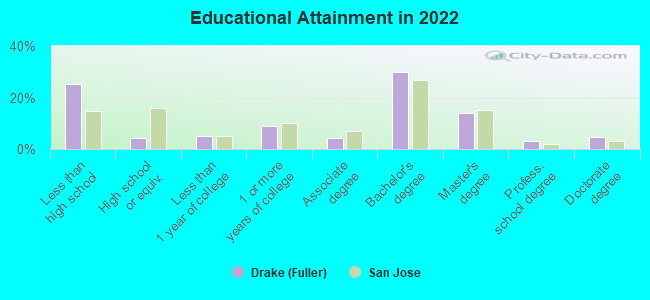
Education in this neighborhood (subdivision or community):
- Percentage of people 3 years and older in K-12 schools:
Drake (Fuller): 17.4% San Jose: 16.1%
- Percentage of people 3 years and older in undergraduate colleges:
Drake (Fuller): 9.7% San Jose: 6.5%
- Percentage of people 3 years and older in grad. or professional schools:
Drake (Fuller): 2.4% San Jose: 2.0%
- Percentage of students K-12 enrolled in private schools:
Drake (Fuller): 23.5% San Jose: 14.9%
Percentage of population below poverty level:
| Drake (Fuller): | 2.1% |
| San Jose: | 9.0% |
Median year owner moved in (as recorded in 2022):
Median year renter moved in (as recorded in 2022):
| Drake (Fuller): | 2005 |
| San Jose: | 2008 |
Median year renter moved in (as recorded in 2022):
| Drake (Fuller): | 2017 |
| San Jose: | 2020 |
Percentage of married-couple families with both working:
| Drake (Fuller): | 104.4% |
| San Jose: | 72.5% |
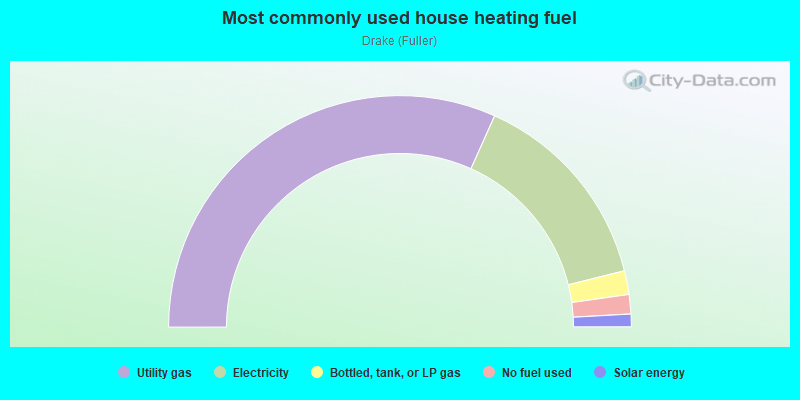
- 63.5%Utility gas
- 28.8%Electricity
- 3.3%Bottled, tank, or LP gas
- 2.7%No fuel used
- 1.8%Solar energy
Roads and streets:
Fuller Ave
Length: 0.26 miles
Directions: E-W, SW-NE
Address range: 600 to 799
Directions: E-W, SW-NE
Address range: 600 to 799
Bird Ave
Length: 0.21 miles
Direction: N-S
Address range: 501 to 749
Direction: N-S
Address range: 501 to 749
West Virginia St
Length: 0.18 miles
Directions: E-W, SW-NE
Address range: 600 to 698
Directions: E-W, SW-NE
Address range: 600 to 698
Harrison St
Length: 0.17 miles
Directions: N-S, SW-NE
Address range: 500 to 799
Directions: N-S, SW-NE
Address range: 500 to 799
Drake St
Length: 0.16 miles
Directions: N-S, SW-NE
Address range: 600 to 799
Directions: N-S, SW-NE
Address range: 600 to 799
Gregory St
Length: 0.10 miles
Direction: N-S
Address range: 500 to 799
Direction: N-S
Address range: 500 to 799
Hulet St
Length: 0.08 miles
Directions: E-W, SW-NE
Address range: 500 to 699
Directions: E-W, SW-NE
Address range: 500 to 699
Helen St
Length: 0.07 miles
Direction: E-W
Address range: 700 to 799
Direction: E-W
Address range: 700 to 799
Railroad features:
Union Pacific RR
Length: 0.16 miles
Direction: SE-NW
Direction: SE-NW