Downtown neighborhood in Tempe, Arizona (AZ), 85281 detailed profile
Settings
X


Business Search - 14 Million verified businesses
Area: 0.360 square miles
Population: 2,437
Population density:
| Downtown: | 6,778 people per square mile |
| Tempe: | 4,641 people per square mile |

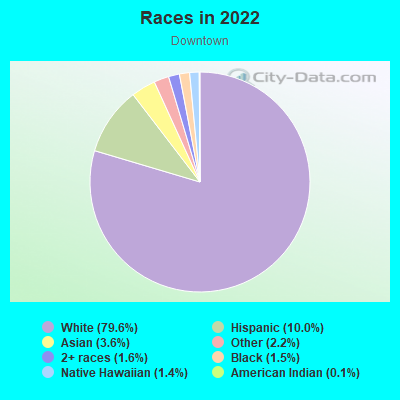
- 1,44759.1%White
- 39716.2%Asian
- 39015.9%Hispanic or Latino
- 1435.8%Black
- 281.1%Two or more races
- 190.8%Native Hawaiian and Other
Pacific Islander - 160.7%American Indian
- 100.4%Some other race
Median household income in 2022:
| Downtown: | $71,108 |
| Tempe: | $76,007 |
Distribution of median household income
![Distribution of median household income]()
- 307Less than $10,000
- 140$10,000 to $19,999
- 109$20,000 to $29,999
- 116$30,000 to $39,999
- 50$40,000 to $49,999
- 34$50,000 to $59,999
- 118$60,000 to $74,999
- 90$75,000 to $99,999
- 92$100,000 to $124,999
- 80$125,000 to $149,999
- 41$150,000 to $199,999
- 55$200,000 or more

Distribution of owner-occupied house/condo value
![Distribution of owner-occupied house/condo value]()
- 132Less than $50,000
- 4$50,000 to $99,999
- 16$100,000 to $149,999
- 30$150,000 to $199,999
- 15$200,000 to $249,999
- 9$250,000 to $299,999
- 40$300,000 to $399,999
- 20$400,000 to $499,999
- 44$500,000 to $749,999
- 55$750,000 to $999,999
- 10$1,000,000 or more

Distribution of rent paid by renters
![Distribution of rent paid by renters]()
- 15Less than $100
- 32$600 to $699
- 101$700 to $799
- 18$800 to $899
- 29$900 to $999
- 40$1,000 to $1,249
- 91$1,250 to $1,499
- 542$1,500 to $1,999
- 256$2,000 or more

Median rent in 2022:
| Downtown: | $1,753 |
| Tempe: | $1,566 |
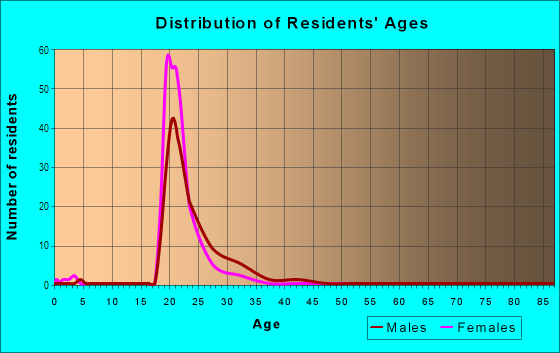
| Males: | 1,469 |
| Females: | 968 |
Males:
| This neighborhood: | 23.9 years |
| Whole city: | 28.9 years |
| This neighborhood: | 24.0 years |
| Whole city: | 30.5 years |
Average household size:
| Downtown: | 1.7 people |
| Tempe: | 2.3 people |
Percentage of family households:
| Downtown: | 14.1% |
| Tempe: | 36.3% |
| Here: | 12.4% |
| Tempe: | 32.6% |
Percentage of married-couple families with children (among all households):
| Downtown: | 41.8% |
| Tempe: | 26.9% |
Percentage of single-mother households (among all households):
| Downtown: | 9.9% |
| Tempe: | 8.3% |
Percentage of never married males 15 years old and over:
Percentage of never married females 15 years old and over:
| Downtown: | 48.9% |
| Tempe: | 32.9% |
Percentage of never married females 15 years old and over:
| Downtown: | 32.5% |
| city: | 21.7% |
Percentage of people that speak English not well or not at all:
| Downtown: | 1.0% |
| Tempe: | 2.0% |
Percentage of people born in this state:
Percentage of people born in another U.S. state:
Percentage of native residents but born outside the U.S.:
Percentage of foreign born residents:
| Here: | 30.1% |
| Tempe: | 39.3% |
Percentage of people born in another U.S. state:
| Downtown: | 50.4% |
| Tempe: | 46.0% |
Percentage of native residents but born outside the U.S.:
| Here: | 1.1% |
| city: | 1.8% |
Percentage of foreign born residents:
| Here: | 18.3% |
| Tempe: | 12.9% |
Owner-occupied
Renter-occupied

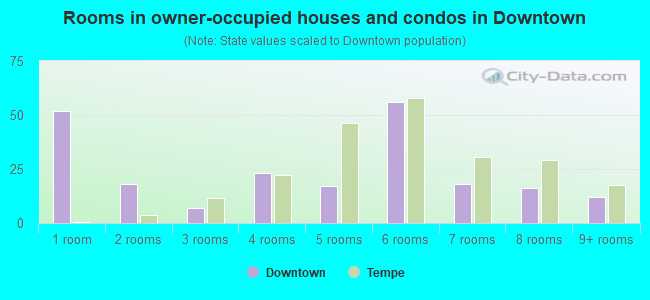
- Rooms in owner-occupied houses and condos in Downtown
- 521 room
- 182 rooms
- 73 rooms
- 234 rooms
- 175 rooms
- 566 rooms
- 187 rooms
- 168 rooms
- 129+ rooms
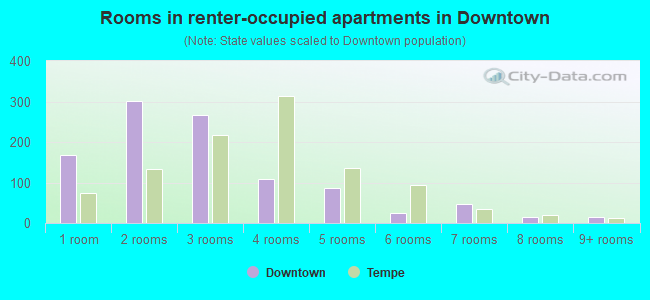
- Rooms in renter-occupied apartments in Downtown
- 1671 room
- 3002 rooms
- 2673 rooms
- 1094 rooms
- 875 rooms
- 246 rooms
- 487 rooms
- 148 rooms
- 169+ rooms
Owner-occupied
Renter-occupied
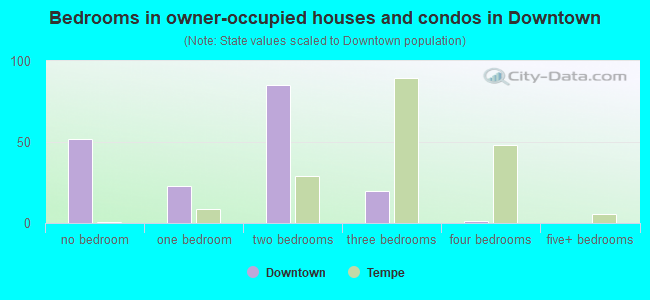
- Bedrooms in owner-occupied houses and condos in Downtown
- 52no bedroom
- 231 bedroom
- 852 bedrooms
- 203 bedrooms
- 14 bedrooms
- 05+ bedrooms
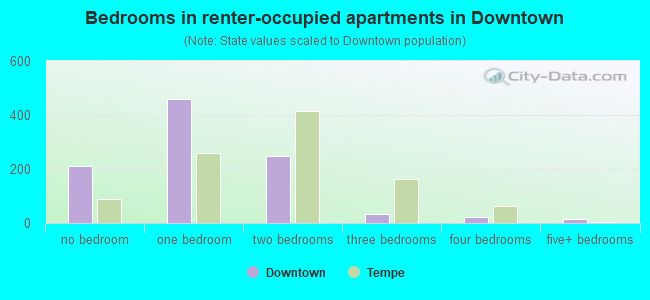
- Bedrooms in renter-occupied apartments in Downtown
- 212no bedroom
- 4591 bedroom
- 2502 bedrooms
- 353 bedrooms
- 244 bedrooms
- 165+ bedrooms
Average number of cars or other vehicles available in houses/condos:
Average number of cars or other vehicles available in apartments:
| This neighborhood: | 1.4 |
| Tempe: | 2.0 |
Average number of cars or other vehicles available in apartments:
| Here: | 1.1 |
| city: | 1.6 |
Percentage of units with a mortgage:
| Downtown: | 52.5% |
| Tempe: | 69.2% |
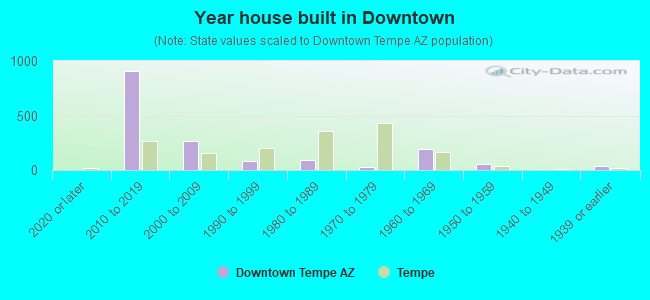
- Year house built in Downtown
- 42020 or later
- 9122010 to 2019
- 2662000 to 2009
- 821990 to 1999
- 921980 to 1989
- 291970 to 1979
- 1911960 to 1969
- 521950 to 1959
- 01940 to 1949
- 341939 or earlier
City-data.com crime index for city in 2020 (higher means more crime):
| City: | 347.1 |
| U.S. average: | 219.5 |
Travel time to work (commute)
![Travel time to work (commute)]()
- 37Less than 5 minutes
- 1305 to 9 minutes
- 16410 to 14 minutes
- 25515 to 19 minutes
- 8420 to 24 minutes
- 6625 to 29 minutes
- 8730 to 34 minutes
- 17735 to 39 minutes
- 540 to 44 minutes
- 945 to 59 minutes
- 360 to 89 minutes
- 3090 or more minutes

Means of transportation to work
![Means of transportation to work]()
- 40.4%442Drove a car alone
- 5.2%57Carpooled
- 0.8%9Bus
- 0.2%2Subway or elevated rail
- 0.6%7Light rail, streetcar or trolley
- 0.4%4Taxi
- 4.8%52Motorcycle
- 5.9%65Bicycle
- 25.4%278Walked
- 0.4%4Other means
- 22.6%247Worked at home

Time leaving home to go to work
![Time leaving home to go to work]()
- 395:00 a.m. to 5:29 a.m.
- 535:30 a.m. to 5:59 a.m.
- 486:00 a.m. to 6:29 a.m.
- 426:30 a.m. to 6:59 a.m.
- 747:00 a.m. to 7:29 a.m.
- 747:30 a.m. to 7:59 a.m.
- 1638:00 a.m. to 8:29 a.m.
- 948:30 a.m. to 8:59 a.m.
- 689:00 a.m. to 9:59 a.m.
- 14810:00 a.m. to 10:59 a.m.
- 4811:00 a.m. to 11:59 a.m.
- 12412:00 p.m. to 3:59 p.m.
- 934:00 p.m. to 11:59 p.m.

Occupations of males:
- Percentage of males in management occupations (except farmers):
Here: 18.5% city: 10.2%
- Percentage of males in business and financial operations occupations:
Here: 7.5% city: 6.5%
- Percentage of males in computer and mathematical occupations:
Here: 12.5% city: 8.4%
- Percentage of males in architecture and engineering occupations:
Here: 8.8% city: 5.0%
- Percentage of males in life, physical, and social science occupations:
Here: 2.9% city: 1.9%
- Percentage of males in legal occupations:
Here: 1.3% city: 1.1%
- Percentage of males in education, training, and library occupations:
Here: 13.6% city: 6.1%
- Percentage of males in arts, design, entertainment, sports, and media occupations:
Here: 2.3% city: 2.8%
- Percentage of males in healthcare practitioners and technical occupations:
Here: 2.8% city: 2.8%
- Percentage of males in service occupations:
Here: 10.7% city: 14.4%
- Percentage of males in sales and office occupations:
Here: 10.7% city: 19.0%
- Percentage of males in production occupations:
Here: 3.3% city: 4.4%
- Percentage of males in material moving occupations:
Here: 2.0% city: 3.5%
Occupations of females:
- Percentage of females in management occupations (except farmers):
Here: 16.4% city: 7.5%
- Percentage of females in business and financial operations occupations:
Here: 6.2% city: 9.3%
- Percentage of females in computer and mathematical occupations:
Here: 3.3% city: 3.3%
- Percentage of females in community and social services occupations:
Here: 6.9% city: 3.4%
- Percentage of females in education, training, and library occupations:
Here: 13.4% city: 12.0%
- Percentage of females in arts, design, entertainment, sports, and media occupations:
Here: 3.2% city: 3.1%
- Percentage of females in healthcare practitioners and technical occupations:
Here: 2.9% city: 7.4%
- Percentage of females in service occupations:
Here: 17.6% city: 18.9%
- Percentage of females in sales and office occupations:
Here: 26.8% city: 26.9%
- Percentage of females in construction, extraction, and maintenance occupations:
Here: 2.7% city: 0.3%
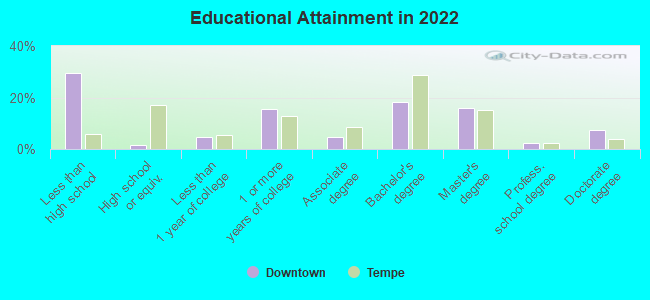
Education in this neighborhood (subdivision or community):
- Percentage of people 3 years and older in K-12 schools:
Downtown: 15.5% Tempe: 12.5%
- Percentage of people 3 years and older in undergraduate colleges:
Downtown: 55.9% Tempe: 15.4%
- Percentage of people 3 years and older in grad. or professional schools:
Downtown: 10.5% Tempe: 6.3%
- Percentage of students K-12 enrolled in private schools:
Downtown: 3.2% Tempe: 9.2%
Percentage of population below poverty level:
| Downtown: | 30.9% |
| Tempe: | 15.0% |
Median year owner moved in (as recorded in 2022):
| Downtown: | 2015 |
| Tempe: | 2013 |
Percentage of married-couple families with both working:
| Downtown: | 100.0% |
| Tempe: | 77.6% |
- 78.9%Electricity
- 12.1%Utility gas
- 4.1%No fuel used
- 2.2%Wood
- 1.6%Bottled, tank, or LP gas
- 1.1%Fuel oil, kerosene, etc.
Highways in this neighborhood:
S Mill Ave (US Hwy 89)
Length: 0.53 miles
Direction: N-S
Address range: 100 to 799
Direction: N-S
Address range: 100 to 799
N Mill Ave (US Hwy 89)
Length: 0.33 miles
Directions: N-S, SE-NW
Address range: 27 to 69
Directions: N-S, SE-NW
Address range: 27 to 69
Roads and streets:
S Ash Ave
Length: 0.77 miles
Directions: N-S, SE-NW, SW-NE
Address range: 1 to 799
Directions: N-S, SE-NW, SW-NE
Address range: 1 to 799
E 5th St
Length: 0.35 miles
Directions: E-W, SE-NW
Address range: 1 to 299
Directions: E-W, SE-NW
Address range: 1 to 299
E 7th St
Length: 0.35 miles
Direction: E-W
Address range: 1 to 299
Direction: E-W
Address range: 1 to 299
E University Dr
Length: 0.35 miles
Direction: E-W
Address range: 1 to 299
Direction: E-W
Address range: 1 to 299
E 6th St
Length: 0.35 miles
Direction: E-W
Address range: 1 to 299
Direction: E-W
Address range: 1 to 299
S Myrtle Ave
Length: 0.28 miles
Directions: N-S, SE-NW
Address range: 600 to 799
Directions: N-S, SE-NW
Address range: 600 to 799
E Rio Salado Pkwy
Length: 0.26 miles
Directions: E-W, SE-NW, SW-NE
Address range: 1 to 298
Directions: E-W, SE-NW, SW-NE
Address range: 1 to 298
S Forest Ave
Length: 0.25 miles
Direction: N-S
Address range: 500 to 899
Direction: N-S
Address range: 500 to 899
S College Ave
Length: 0.24 miles
Direction: N-S
Address range: 500 to 799
Direction: N-S
Address range: 500 to 799
W 1st St
Length: 0.23 miles
Direction: E-W
Address range: 1 to 265
Direction: E-W
Address range: 1 to 265
W 5th St
Length: 0.23 miles
Direction: E-W
Address range: 1 to 299
Direction: E-W
Address range: 1 to 299
W University Dr
Length: 0.17 miles
Direction: E-W
Address range: 1 to 199
Direction: E-W
Address range: 1 to 199
S Maple Ave
Length: 0.16 miles
Directions: N-S, SW-NE
Address range: 400 to 498
Directions: N-S, SW-NE
Address range: 400 to 498
W 3rd St
Length: 0.15 miles
Direction: E-W
Address range: 1 to 199
Direction: E-W
Address range: 1 to 199
W 2nd St
Length: 0.09 miles
Direction: E-W
Direction: E-W
W 6th St
Length: 0.09 miles
Direction: E-W
Direction: E-W
3rd St
Length: 0.04 miles
Direction: E-W
Direction: E-W
W 4th St
Length: 0.03 miles
Direction: E-W
Address range: 1 to 99
Direction: E-W
Address range: 1 to 99
Railroad features:
Phoenix Eastern RR
Length: 0.56 miles
Directions: E-W, N-S, SE-NW
Directions: E-W, N-S, SE-NW
Other features:
Hayden Cnl
Length: 0.31 miles
Directions: E-W, N-S, SE-NW
Directions: E-W, N-S, SE-NW