Downtown Millbrae (Downtown) neighborhood in Millbrae, California (CA), 94030 detailed profile
Settings
X

Business Search - 14 Million verified businesses
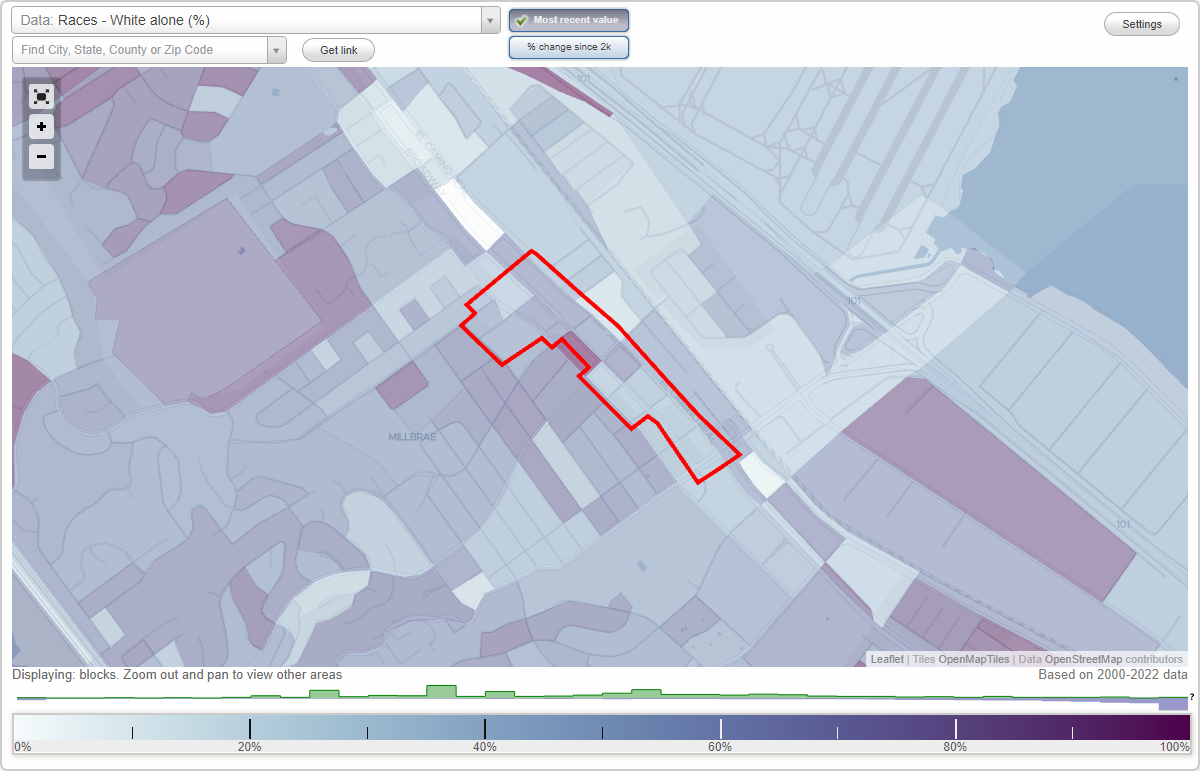
Area: 0.101 square miles
Population: 1,029
Population density:
| Downtown Millbrae (Downtown): | 10,181 people per square mile |
| Millbrae: | 7,102 people per square mile |

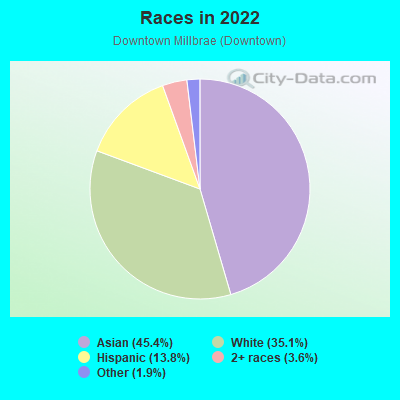
- 47645.4%Asian
- 36835.1%White
- 14513.8%Hispanic or Latino
- 383.6%Two or more races
- 201.9%Some other race
- 10.10%Native Hawaiian and Other
Pacific Islander
Median household income in 2022:
| Downtown Millbrae (Downtown): | $136,091 |
| Millbrae: | $146,649 |
Distribution of median household income
![Distribution of median household income]()
- 15Less than $10,000
- 10$10,000 to $19,999
- 32$20,000 to $29,999
- 141$30,000 to $39,999
- 13$40,000 to $49,999
- 16$50,000 to $59,999
- 15$60,000 to $74,999
- 29$75,000 to $99,999
- 51$100,000 to $124,999
- 16$125,000 to $149,999
- 44$150,000 to $199,999
- 124$200,000 or more

Distribution of owner-occupied house/condo value
![Distribution of owner-occupied house/condo value]()
- 5$100,000 to $149,999
- 6$400,000 to $499,999
- 9$500,000 to $749,999
- 16$750,000 to $999,999
- 100$1,000,000 or more

Distribution of rent paid by renters
![Distribution of rent paid by renters]()
- 7$1,250 to $1,499
- 35$1,500 to $1,999
- 210$2,000 or more

Median rent in 2022:
| Downtown Millbrae (Downtown): | $2,910 |
| Millbrae: | $2,001 |
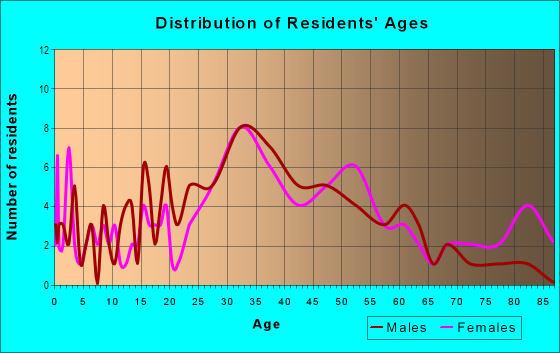
| Males: | 508 |
| Females: | 520 |
Males:
| This neighborhood: | 42.0 years |
| Whole city: | 41.7 years |
| This neighborhood: | 47.0 years |
| Whole city: | 49.5 years |
Average household size:
| Downtown Millbrae (Downtown): | 15.2 people |
| Millbrae: | 2.8 people |
Percentage of family households:
| Downtown Millbrae (Downtown): | 47.9% |
| Millbrae: | 46.1% |
| Here: | 45.8% |
| Millbrae: | 52.3% |
Percentage of married-couple families with children (among all households):
| Downtown Millbrae (Downtown): | 32.3% |
| Millbrae: | 31.0% |
Percentage of single-mother households (among all households):
| Downtown Millbrae (Downtown): | 1.7% |
| Millbrae: | 3.2% |
Percentage of never married males 15 years old and over:
Percentage of never married females 15 years old and over:
| Downtown Millbrae (Downtown): | 15.5% |
| Millbrae: | 16.8% |
Percentage of never married females 15 years old and over:
| Downtown Millbrae (Downtown): | 19.2% |
| city: | 13.7% |
Percentage of people that speak English not well or not at all:
| Downtown Millbrae (Downtown): | 8.1% |
| Millbrae: | 7.2% |
Percentage of people born in this state:
Percentage of people born in another U.S. state:
Percentage of native residents but born outside the U.S.:
Percentage of foreign born residents:
| Here: | 46.0% |
| Millbrae: | 47.9% |
Percentage of people born in another U.S. state:
| Downtown Millbrae (Downtown): | 10.4% |
| Millbrae: | 11.0% |
Percentage of native residents but born outside the U.S.:
| Here: | 1.3% |
| city: | 1.5% |
Percentage of foreign born residents:
| Here: | 42.4% |
| Millbrae: | 39.7% |
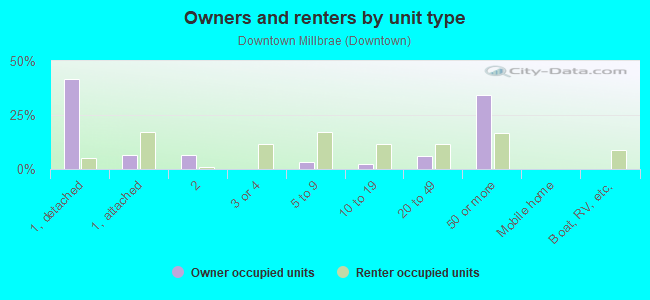
Owner-occupied
Renter-occupied

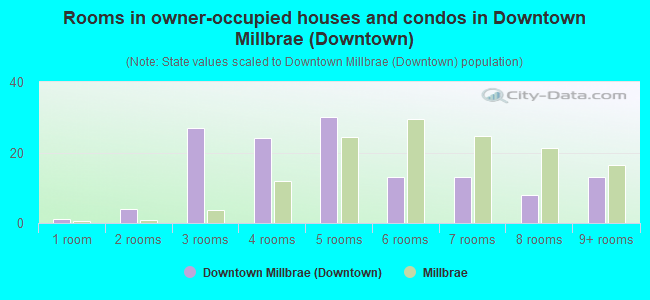
- Rooms in owner-occupied houses and condos in Downtown Millbrae <
> - 11 room
- 42 rooms
- 273 rooms
- 244 rooms
- 305 rooms
- 136 rooms
- 137 rooms
- 88 rooms
- 139+ rooms
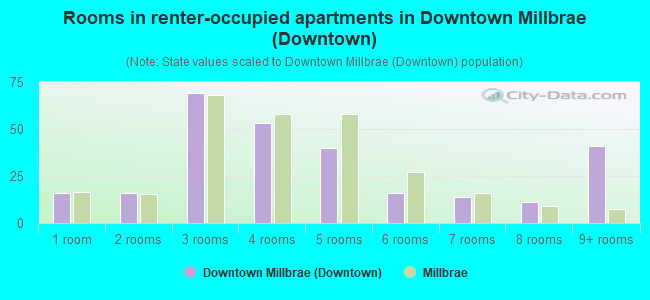
- Rooms in renter-occupied apartments in Downtown Millbrae <
> - 161 room
- 162 rooms
- 693 rooms
- 534 rooms
- 405 rooms
- 166 rooms
- 147 rooms
- 118 rooms
- 419+ rooms
Owner-occupied
Renter-occupied
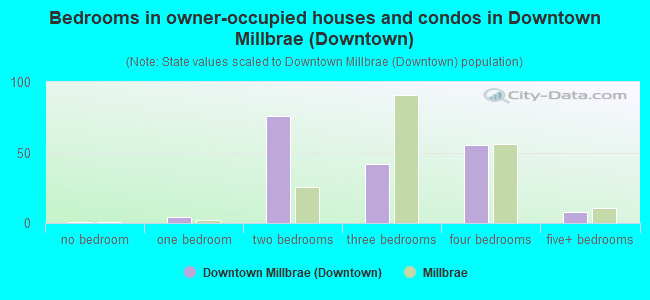
- Bedrooms in owner-occupied houses and condos in Downtown Millbrae <
> - 1no bedroom
- 41 bedroom
- 762 bedrooms
- 423 bedrooms
- 554 bedrooms
- 85+ bedrooms
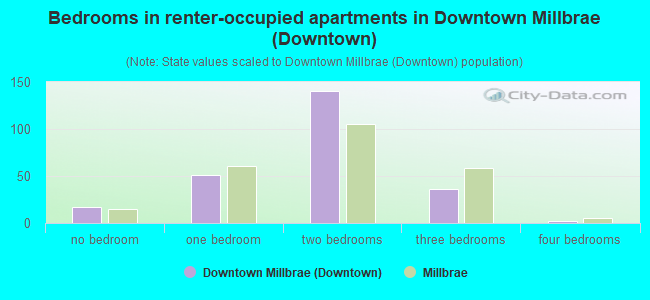
- Bedrooms in renter-occupied apartments in Downtown Millbrae <
> - 17no bedroom
- 511 bedroom
- 1402 bedrooms
- 363 bedrooms
- 24 bedrooms
- 05+ bedrooms
Average number of cars or other vehicles available in houses/condos:
Average number of cars or other vehicles available in apartments:
| This neighborhood: | 2.3 |
| Millbrae: | 2.3 |
Average number of cars or other vehicles available in apartments:
| Here: | 1.5 |
| city: | 1.6 |
Percentage of units with a mortgage:
| Downtown Millbrae (Downtown): | 72.6% |
| Millbrae: | 60.7% |
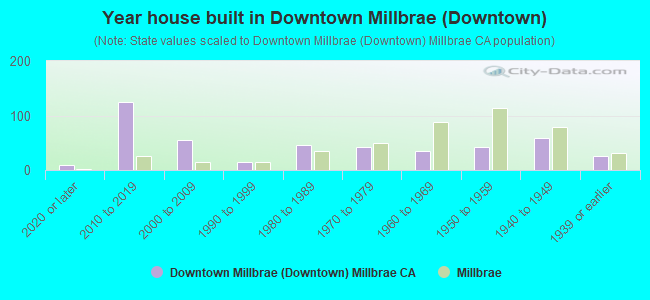
- Year house built in Downtown Millbrae <
> - 92020 or later
- 1242010 to 2019
- 552000 to 2009
- 151990 to 1999
- 451980 to 1989
- 431970 to 1979
- 351960 to 1969
- 421950 to 1959
- 591940 to 1949
- 251939 or earlier
Travel time to work (commute)
![Travel time to work (commute)]()
- 12Less than 5 minutes
- 265 to 9 minutes
- 3010 to 14 minutes
- 8615 to 19 minutes
- 5520 to 24 minutes
- 1225 to 29 minutes
- 6230 to 34 minutes
- 2835 to 39 minutes
- 2440 to 44 minutes
- 6345 to 59 minutes
- 2760 to 89 minutes
- 1190 or more minutes

Means of transportation to work
![Means of transportation to work]()
- 53.0%265Drove a car alone
- 5.2%26Carpooled
- 3.6%18Bus
- 14.2%71Subway or elevated rail
- 1.8%9Long-distance train or commuter rail
- 1.8%9Taxi
- 0.2%1Motorcycle
- 5.6%28Bicycle
- 6.8%34Walked
- 0.6%3Other means
- 18.0%90Worked at home

Time leaving home to go to work
![Time leaving home to go to work]()
- 812:00 a.m. to 4:59 a.m.
- 25:00 a.m. to 5:29 a.m.
- 65:30 a.m. to 5:59 a.m.
- 226:00 a.m. to 6:29 a.m.
- 286:30 a.m. to 6:59 a.m.
- 657:00 a.m. to 7:29 a.m.
- 297:30 a.m. to 7:59 a.m.
- 778:00 a.m. to 8:29 a.m.
- 328:30 a.m. to 8:59 a.m.
- 899:00 a.m. to 9:59 a.m.
- 1910:00 a.m. to 10:59 a.m.
- 411:00 a.m. to 11:59 a.m.
- 2012:00 p.m. to 3:59 p.m.
- 274:00 p.m. to 11:59 p.m.

Occupations of males:
- Percentage of males in management occupations (except farmers):
Here: 14.6% city: 17.8%
- Percentage of males in business and financial operations occupations:
Here: 7.1% city: 7.0%
- Percentage of males in computer and mathematical occupations:
Here: 13.5% city: 11.2%
- Percentage of males in architecture and engineering occupations:
Here: 4.0% city: 4.5%
- Percentage of males in education, training, and library occupations:
Here: 6.9% city: 3.2%
- Percentage of males in arts, design, entertainment, sports, and media occupations:
Here: 1.2% city: 1.5%
- Percentage of males in healthcare practitioners and technical occupations:
Here: 4.1% city: 4.6%
- Percentage of males in service occupations:
Here: 22.0% city: 11.4%
- Percentage of males in sales and office occupations:
Here: 9.6% city: 15.9%
- Percentage of males in construction, extraction, and maintenance occupations:
Here: 3.7% city: 5.1%
- Percentage of males in production occupations:
Here: 1.0% city: 3.6%
- Percentage of males in transportation occupations:
Here: 1.9% city: 4.4%
- Percentage of males in material moving occupations:
Here: 2.8% city: 2.3%
Occupations of females:
- Percentage of females in management occupations (except farmers):
Here: 8.7% city: 13.9%
- Percentage of females in business and financial operations occupations:
Here: 10.7% city: 11.4%
- Percentage of females in computer and mathematical occupations:
Here: 7.4% city: 4.8%
- Percentage of females in life, physical, and social science occupations:
Here: 1.5% city: 3.0%
- Percentage of females in education, training, and library occupations:
Here: 6.5% city: 6.9%
- Percentage of females in arts, design, entertainment, sports, and media occupations:
Here: 4.7% city: 2.2%
- Percentage of females in healthcare practitioners and technical occupations:
Here: 13.7% city: 8.6%
- Percentage of females in service occupations:
Here: 6.6% city: 14.9%
- Percentage of females in sales and office occupations:
Here: 25.6% city: 23.9%
- Percentage of females in production occupations:
Here: 1.1% city: 1.0%
- Percentage of females in transportation occupations:
Here: 13.6% city: 6.3%
- Percentage of females in material moving occupations:
Here: 1.9% city: 1.1%
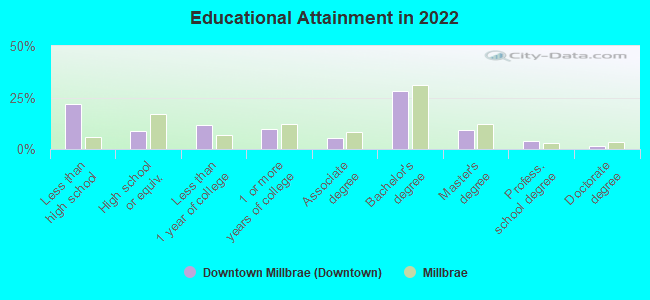
Education in this neighborhood (subdivision or community):
- Percentage of people 3 years and older in K-12 schools:
Downtown Millbrae (Downtown): 14.1% Millbrae: 14.1%
- Percentage of people 3 years and older in undergraduate colleges:
Downtown Millbrae (Downtown): 7.1% Millbrae: 4.7%
- Percentage of people 3 years and older in grad. or professional schools:
Downtown Millbrae (Downtown): 3.5% Millbrae: 1.5%
- Percentage of students K-12 enrolled in private schools:
Downtown Millbrae (Downtown): 41.3% Millbrae: 13.0%
Percentage of population below poverty level:
| Downtown Millbrae (Downtown): | 7.8% |
| Millbrae: | 6.4% |
Median year owner moved in (as recorded in 2022):
Median year renter moved in (as recorded in 2022):
| Downtown Millbrae (Downtown): | 2004 |
| Millbrae: | 2001 |
Median year renter moved in (as recorded in 2022):
| Downtown Millbrae (Downtown): | 2018 |
| Millbrae: | 2017 |
Percentage of married-couple families with both working:
| Downtown Millbrae (Downtown): | 59.5% |
| Millbrae: | 76.6% |
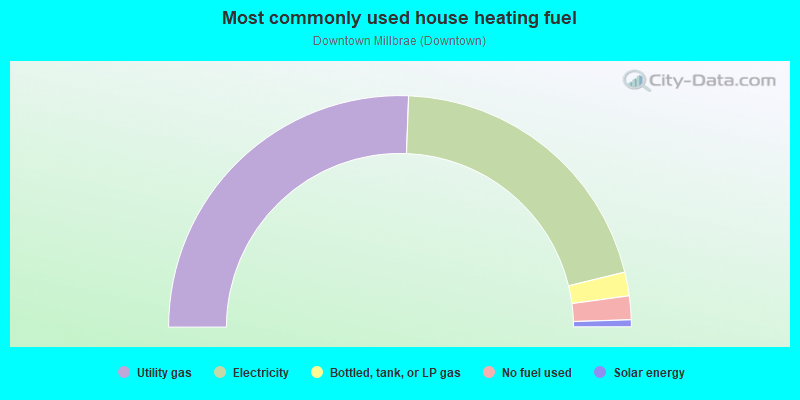
- 51.2%Utility gas
- 41.2%Electricity
- 3.3%Bottled, tank, or LP gas
- 3.3%No fuel used
- 1.0%Solar energy
Highways in this neighborhood:
Mission St (el Camino Real, State Hwy 82)
Length: 0.67 miles
Direction: SE-NW
Address range: 2 to 798
Direction: SE-NW
Address range: 2 to 798
Roads and streets:
Broadway
Length: 0.63 miles
Direction: SE-NW
Address range: 2 to 621
Direction: SE-NW
Address range: 2 to 621
Magnolia Ave
Length: 0.39 miles
Directions: E-W, SE-NW
Address range: 200 to 950
Directions: E-W, SE-NW
Address range: 200 to 950
Taylor Blvd
Length: 0.14 miles
Direction: SW-NE
Address range: 1 to 199
Direction: SW-NE
Address range: 1 to 199
Victoria Ave
Length: 0.14 miles
Direction: SW-NE
Address range: 1 to 199
Direction: SW-NE
Address range: 1 to 199
la Cruz Ave
Length: 0.13 miles
Direction: SW-NE
Address range: 1 to 199
Direction: SW-NE
Address range: 1 to 199
Hillcrest Blvd
Length: 0.13 miles
Directions: N-S, SW-NE
Address range: 25 to 199
Directions: N-S, SW-NE
Address range: 25 to 199
Library Ave
Length: 0.12 miles
Direction: SW-NE
Address range: 1 to 299
Direction: SW-NE
Address range: 1 to 299
Civic Center Ln
Length: 0.11 miles
Directions: E-W, N-S
Address range: 1 to 99
Directions: E-W, N-S
Address range: 1 to 99
Millbrae Ave
Length: 0.09 miles
Direction: SW-NE
Address range: 1 to 99
Direction: SW-NE
Address range: 1 to 99
Chadbourne Ave
Length: 0.08 miles
Direction: SW-NE
Address range: 1 to 99
Direction: SW-NE
Address range: 1 to 99
Poplar Ave
Length: 0.07 miles
Direction: SE-NW
Address range: 500 to 548
Direction: SE-NW
Address range: 500 to 548