Downtown Chandler Historic District neighborhood in Chandler, Arizona (AZ), 85225 detailed profile
Settings
X

Business Search - 14 Million verified businesses
Area: 0.026 square miles
Population: 432
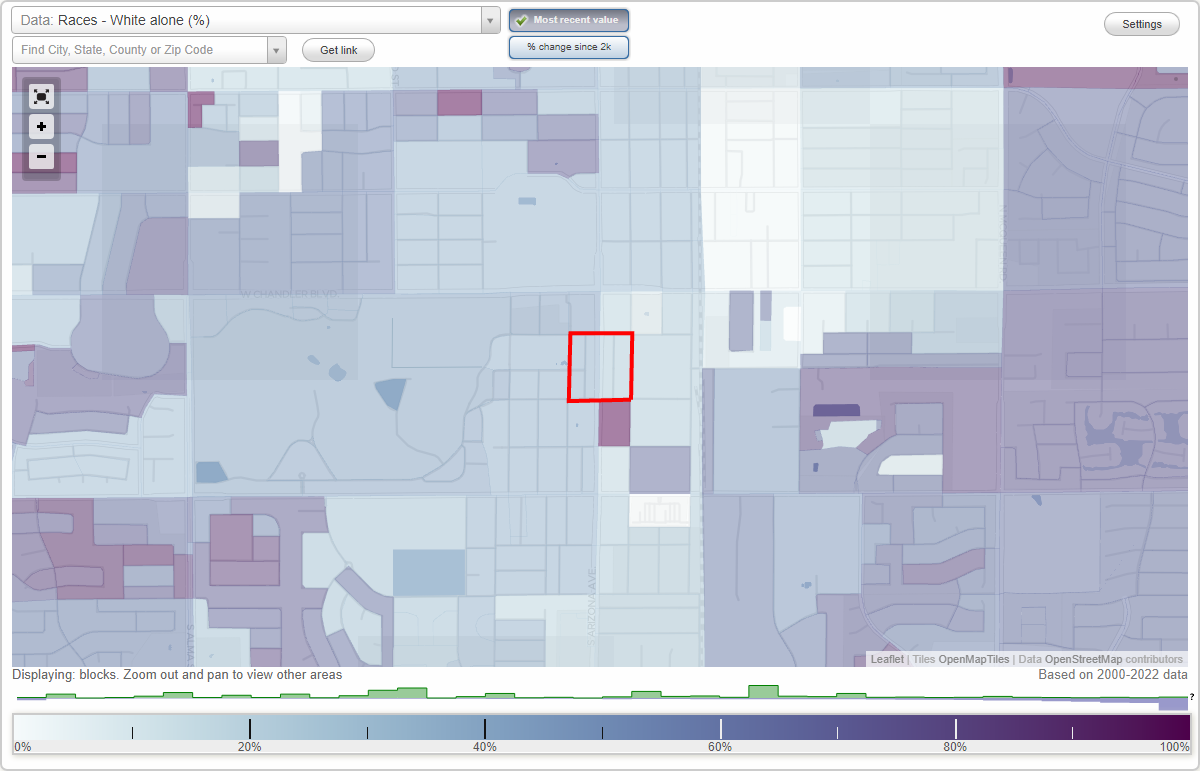
Population density:
| Downtown Chandler Historic District: | 16,888 people per square mile |
| Chandler: | 4,849 people per square mile |

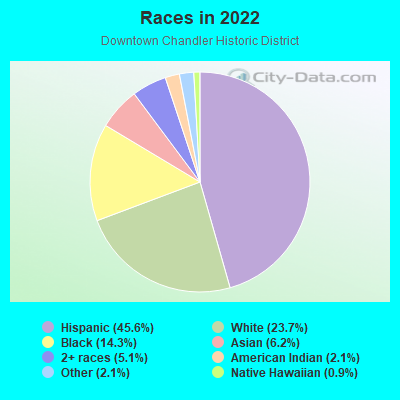
- 19845.6%Hispanic or Latino
- 10323.7%White
- 6214.3%Black
- 276.2%Asian
- 225.1%Two or more races
- 92.1%American Indian
- 92.1%Some other race
- 40.9%Native Hawaiian and Other
Pacific Islander
Median household income in 2022:
| Downtown Chandler Historic District: | $61,652 |
| Chandler: | $98,664 |
Distribution of median household income
![Distribution of median household income]()
- 3Less than $10,000
- 22$10,000 to $19,999
- 14$20,000 to $29,999
- 12$30,000 to $39,999
- 13$40,000 to $49,999
- 12$50,000 to $59,999
- 24$60,000 to $74,999
- 16$75,000 to $99,999
- 12$100,000 to $124,999
- 16$125,000 to $149,999
- 3$150,000 to $199,999
- 10$200,000 or more

Distribution of owner-occupied house/condo value
![Distribution of owner-occupied house/condo value]()
- 2Less than $50,000
- 1$50,000 to $99,999
- 7$150,000 to $199,999
- 15$200,000 to $249,999
- 10$250,000 to $299,999
- 18$300,000 to $399,999
- 2$400,000 to $499,999
- 7$500,000 to $749,999
- 3$750,000 to $999,999
- 1$1,000,000 or more

Distribution of rent paid by renters
![Distribution of rent paid by renters]()
- 4$100 to $199
- 1$200 to $299
- 1$400 to $499
- 1$500 to $599
- 6$600 to $699
- 8$700 to $799
- 3$800 to $899
- 11$900 to $999
- 17$1,000 to $1,249
- 25$1,250 to $1,499
- 22$1,500 to $1,999
- 3$2,000 or more

Median rent in 2022:
| Downtown Chandler Historic District: | $1,274 |
| Chandler: | $1,692 |
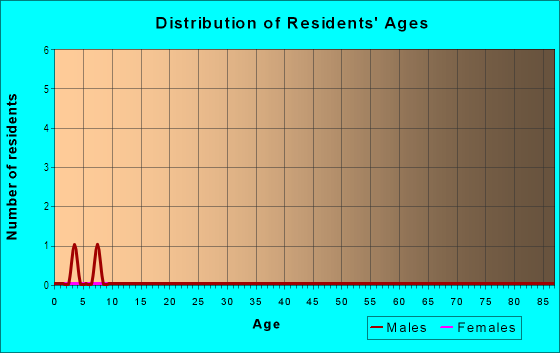
| Males: | 199 |
| Females: | 233 |
Males:
| This neighborhood: | 27.6 years |
| Whole city: | 35.8 years |
| This neighborhood: | 27.9 years |
| Whole city: | 38.3 years |
Average household size:
| Downtown Chandler Historic District: | 2.9 people |
| Chandler: | 2.6 people |
Percentage of family households:
| Downtown Chandler Historic District: | 62.3% |
| Chandler: | 53.2% |
| Here: | 39.5% |
| Chandler: | 50.7% |
Percentage of married-couple families with children (among all households):
| Downtown Chandler Historic District: | 19.5% |
| Chandler: | 26.2% |
Percentage of single-mother households (among all households):
| Downtown Chandler Historic District: | 10.4% |
| Chandler: | 7.3% |
Percentage of never married males 15 years old and over:
Percentage of never married females 15 years old and over:
| Downtown Chandler Historic District: | 21.3% |
| Chandler: | 20.3% |
Percentage of never married females 15 years old and over:
| Downtown Chandler Historic District: | 24.5% |
| city: | 14.9% |
Percentage of people that speak English not well or not at all:
| Downtown Chandler Historic District: | 6.9% |
| Chandler: | 3.1% |
Percentage of people born in this state:
Percentage of people born in another U.S. state:
Percentage of native residents but born outside the U.S.:
Percentage of foreign born residents:
| Here: | 39.4% |
| Chandler: | 35.8% |
Percentage of people born in another U.S. state:
| Downtown Chandler Historic District: | 40.0% |
| Chandler: | 44.6% |
Percentage of native residents but born outside the U.S.:
| Here: | 1.2% |
| city: | 1.5% |
Percentage of foreign born residents:
| Here: | 19.3% |
| Chandler: | 18.0% |
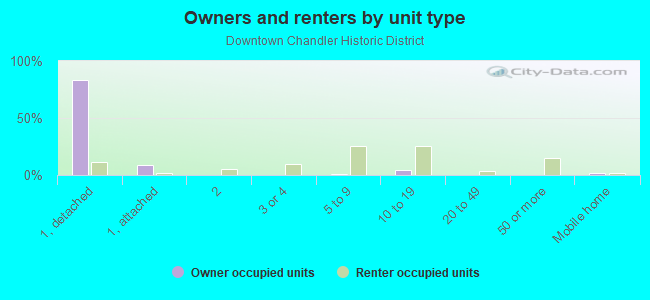
Owner-occupied
Renter-occupied

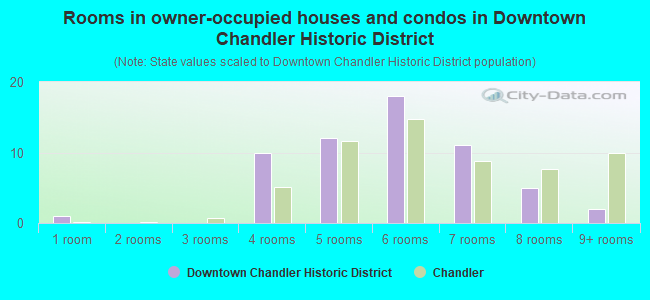
- Rooms in owner-occupied houses and condos in Downtown Chandler Historic District
- 11 room
- 02 rooms
- 03 rooms
- 104 rooms
- 125 rooms
- 186 rooms
- 117 rooms
- 58 rooms
- 29+ rooms
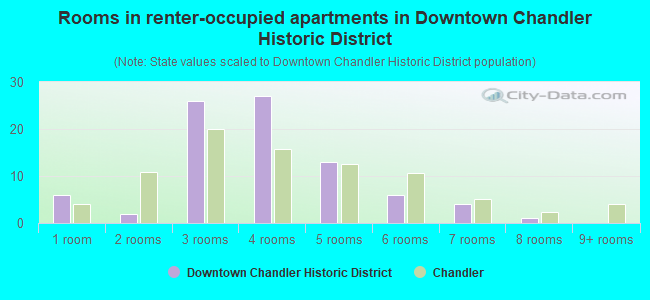
- Rooms in renter-occupied apartments in Downtown Chandler Historic District
- 61 room
- 22 rooms
- 263 rooms
- 274 rooms
- 135 rooms
- 66 rooms
- 47 rooms
- 18 rooms
- 09+ rooms
Owner-occupied
Renter-occupied
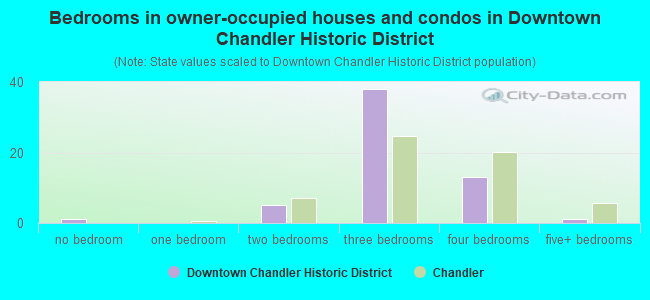
- Bedrooms in owner-occupied houses and condos in Downtown Chandler Historic District
- 1no bedroom
- 01 bedroom
- 52 bedrooms
- 383 bedrooms
- 134 bedrooms
- 15+ bedrooms
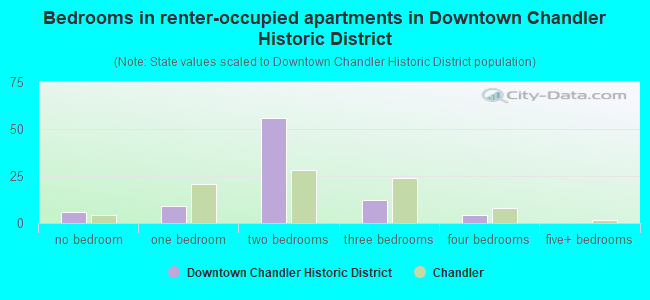
- Bedrooms in renter-occupied apartments in Downtown Chandler Historic District
- 6no bedroom
- 91 bedroom
- 562 bedrooms
- 123 bedrooms
- 44 bedrooms
- 05+ bedrooms
Average number of cars or other vehicles available in houses/condos:
Average number of cars or other vehicles available in apartments:
| This neighborhood: | 2.1 |
| Chandler: | 2.1 |
Average number of cars or other vehicles available in apartments:
| Here: | 1.4 |
| city: | 1.5 |
Percentage of units with a mortgage:
| Downtown Chandler Historic District: | 68.6% |
| Chandler: | 73.1% |
Housing prices:
- Average estimated value of detached houses in 2022 (41.4% of all units):
Downtown Chandler Historic District: $309,105 Chandler: $480,818
- Average estimated value of townhouses or other attached units in 2022 (3.3% of all units):
This neighborhood: $510,134 city: $322,028
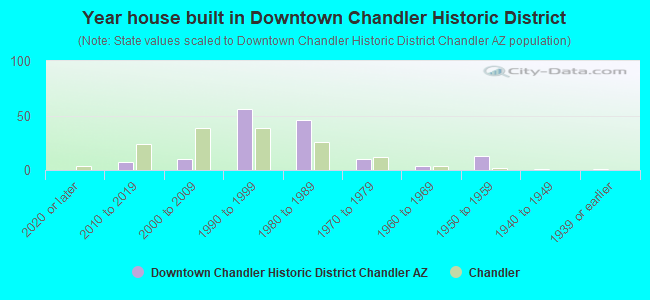
- Year house built in Downtown Chandler Historic District
- 02020 or later
- 72010 to 2019
- 102000 to 2009
- 561990 to 1999
- 461980 to 1989
- 101970 to 1979
- 41960 to 1969
- 131950 to 1959
- 11940 to 1949
- 11939 or earlier
City-data.com crime index for city in 2020 (higher means more crime):
| City: | 165.7 |
| U.S. average: | 219.5 |
Travel time to work (commute)
![Travel time to work (commute)]()
- 2Less than 5 minutes
- 65 to 9 minutes
- 1410 to 14 minutes
- 2115 to 19 minutes
- 1320 to 24 minutes
- 625 to 29 minutes
- 830 to 34 minutes
- 135 to 39 minutes
- 440 to 44 minutes
- 1245 to 59 minutes
- 260 to 89 minutes
- 290 or more minutes

Means of transportation to work
![Means of transportation to work]()
- 55.3%115Drove a car alone
- 24.1%50Carpooled
- 1.0%2Taxi
- 1.0%2Walked
- 4.3%9Other means
- 13.0%27Worked at home

Time leaving home to go to work
![Time leaving home to go to work]()
- 412:00 a.m. to 4:59 a.m.
- 95:00 a.m. to 5:29 a.m.
- 55:30 a.m. to 5:59 a.m.
- 136:00 a.m. to 6:29 a.m.
- 76:30 a.m. to 6:59 a.m.
- 147:00 a.m. to 7:29 a.m.
- 57:30 a.m. to 7:59 a.m.
- 58:00 a.m. to 8:29 a.m.
- 39:00 a.m. to 9:59 a.m.
- 111:00 a.m. to 11:59 a.m.
- 812:00 p.m. to 3:59 p.m.
- 74:00 p.m. to 11:59 p.m.

Occupations of males:
- Percentage of males in management occupations (except farmers):
Here: 9.4% city: 13.0%
- Percentage of males in business and financial operations occupations:
Here: 7.8% city: 7.1%
- Percentage of males in computer and mathematical occupations:
Here: 8.5% city: 8.4%
- Percentage of males in architecture and engineering occupations:
Here: 4.8% city: 9.9%
- Percentage of males in community and social services occupations:
Here: 2.1% city: 0.9%
- Percentage of males in education, training, and library occupations:
Here: 1.6% city: 3.3%
- Percentage of males in arts, design, entertainment, sports, and media occupations:
Here: 2.8% city: 2.0%
- Percentage of males in healthcare practitioners and technical occupations:
Here: 4.7% city: 3.0%
- Percentage of males in service occupations:
Here: 32.7% city: 11.0%
- Percentage of males in sales and office occupations:
Here: 18.3% city: 17.8%
- Percentage of males in construction, extraction, and maintenance occupations:
Here: 9.8% city: 5.9%
- Percentage of males in production occupations:
Here: 4.2% city: 4.4%
- Percentage of males in transportation occupations:
Here: 1.6% city: 3.6%
- Percentage of males in material moving occupations:
Here: 10.3% city: 3.9%
Occupations of females:
- Percentage of females in management occupations (except farmers):
Here: 2.2% city: 11.0%
- Percentage of females in business and financial operations occupations:
Here: 6.0% city: 9.3%
- Percentage of females in computer and mathematical occupations:
Here: 1.4% city: 3.8%
- Percentage of females in architecture and engineering occupations:
Here: 1.1% city: 2.4%
- Percentage of females in life, physical, and social science occupations:
Here: 2.2% city: 0.9%
- Percentage of females in legal occupations:
Here: 1.2% city: 1.3%
- Percentage of females in education, training, and library occupations:
Here: 11.2% city: 8.7%
- Percentage of females in healthcare practitioners and technical occupations:
Here: 6.8% city: 9.8%
- Percentage of females in service occupations:
Here: 36.9% city: 15.2%
- Percentage of females in sales and office occupations:
Here: 34.7% city: 28.7%
- Percentage of females in production occupations:
Here: 1.2% city: 2.0%
- Percentage of females in material moving occupations:
Here: 2.2% city: 1.1%
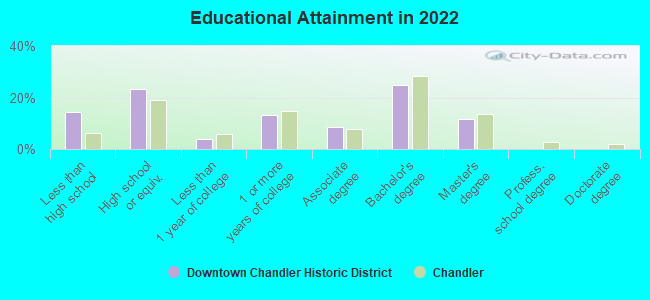
Education in this neighborhood (subdivision or community):
- Percentage of people 3 years and older in K-12 schools:
Downtown Chandler Historic District: 25.0% Chandler: 19.1%
- Percentage of people 3 years and older in undergraduate colleges:
Downtown Chandler Historic District: 5.8% Chandler: 4.5%
- Percentage of people 3 years and older in grad. or professional schools:
Downtown Chandler Historic District: 0.7% Chandler: 1.8%
- Percentage of students K-12 enrolled in private schools:
Downtown Chandler Historic District: 2.9% Chandler: 14.2%
Percentage of population below poverty level:
| Downtown Chandler Historic District: | 16.9% |
| Chandler: | 7.6% |
Median year owner moved in (as recorded in 2022):
Median year renter moved in (as recorded in 2022):
| Downtown Chandler Historic District: | 2012 |
| Chandler: | 2013 |
Median year renter moved in (as recorded in 2022):
| Downtown Chandler Historic District: | 2018 |
| Chandler: | 2020 |
Percentage of married-couple families with both working:
| Downtown Chandler Historic District: | 77.8% |
| Chandler: | 68.1% |
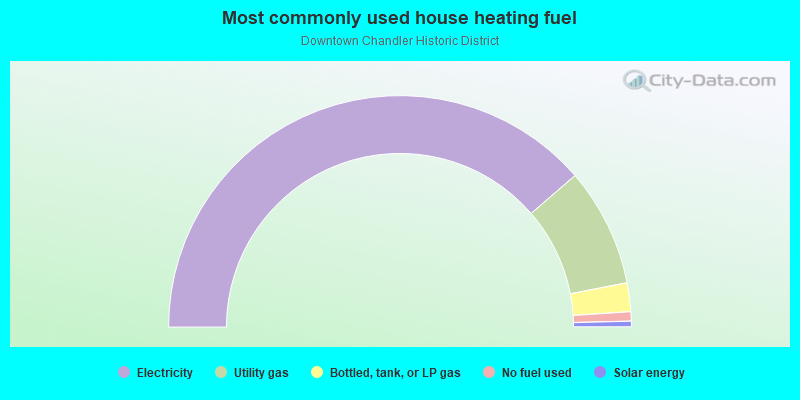
- 77.3%Electricity
- 16.6%Utility gas
- 4.0%Bottled, tank, or LP gas
- 1.3%No fuel used
- 0.8%Solar energy
Highways in this neighborhood:
S Arizona Ave (State Hwy 87)
Length: 0.16 miles
Direction: N-S
Address range: 1 to 99
Direction: N-S
Address range: 1 to 99
Roads and streets:
E Buffalo St
Length: 0.09 miles
Direction: E-W
Address range: 1 to 99
Direction: E-W
Address range: 1 to 99
E Boston St
Length: 0.09 miles
Direction: E-W
Address range: 1 to 99
Direction: E-W
Address range: 1 to 99
N Arizona Pl
Length: 0.09 miles
Direction: N-S
Address range: 1 to 99
Direction: N-S
Address range: 1 to 99
N San Marcos Pl
Length: 0.09 miles
Direction: N-S
Address range: 1 to 99
Direction: N-S
Address range: 1 to 99
S San Marcos Pl
Length: 0.07 miles
Direction: N-S
Address range: 1 to 99
Direction: N-S
Address range: 1 to 99
S Arizona Pl
Length: 0.07 miles
Direction: N-S
Address range: 1 to 99
Direction: N-S
Address range: 1 to 99
W Buffalo St
Length: 0.04 miles
Direction: E-W
Address range: 1 to 47
Direction: E-W
Address range: 1 to 47
W Boston St
Length: 0.04 miles
Direction: E-W
Address range: 1 to 49
Direction: E-W
Address range: 1 to 49