Downtown neighborhood in Boulder, Colorado (CO), 80302 detailed profile
Settings
X


Business Search - 14 Million verified businesses
Area: 0.211 square miles
Population: 2,774
Population density:
| Downtown: | 13,156 people per square mile |
| Boulder: | 4,328 people per square mile |

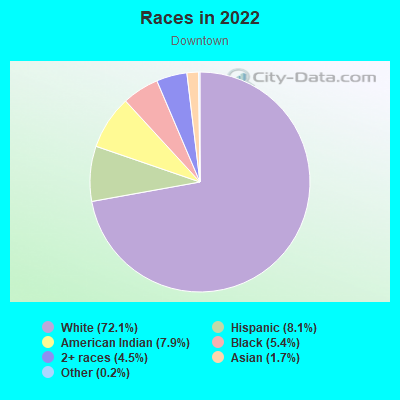
- 1,93368.3%White
- 56419.9%Hispanic or Latino
- 1374.8%Asian
- 1063.7%Two or more races
- 692.4%Black
- 200.7%Some other race
Median household income in 2022:
| Downtown: | $120,961 |
| Boulder: | $81,608 |
Distribution of median household income
![Distribution of median household income]()
- 208Less than $10,000
- 279$10,000 to $19,999
- 335$20,000 to $29,999
- 315$30,000 to $39,999
- 89$40,000 to $49,999
- 54$50,000 to $59,999
- 126$60,000 to $74,999
- 65$75,000 to $99,999
- 59$100,000 to $124,999
- 30$125,000 to $149,999
- 158$150,000 to $199,999
- 144$200,000 or more

Distribution of owner-occupied house/condo value
![Distribution of owner-occupied house/condo value]()
- 44$50,000 to $99,999
- 6$100,000 to $149,999
- 12$150,000 to $199,999
- 107$300,000 to $399,999
- 51$400,000 to $499,999
- 30$500,000 to $749,999
- 25$750,000 to $999,999
- 654$1,000,000 or more

Distribution of rent paid by renters
![Distribution of rent paid by renters]()
- 42Less than $100
- 21$100 to $199
- 21$200 to $299
- 11$300 to $399
- 22$400 to $499
- 236$500 to $599
- 3$600 to $699
- 91$800 to $899
- 3$900 to $999
- 138$1,000 to $1,249
- 285$1,250 to $1,499
- 455$1,500 to $1,999
- 236$2,000 or more

Median rent in 2022:
| Downtown: | $1,597 |
| Boulder: | $1,700 |
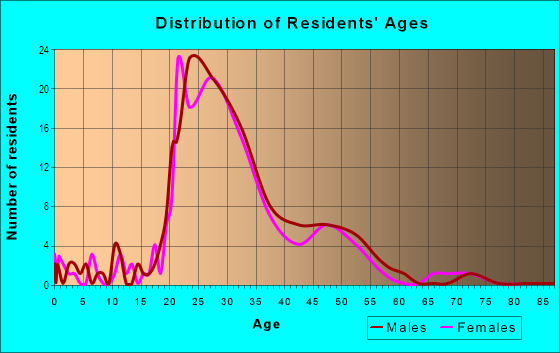
| Males: | 1,594 |
| Females: | 1,179 |
Males:
| This neighborhood: | 35.8 years |
| Whole city: | 28.3 years |
| This neighborhood: | 35.3 years |
| Whole city: | 29.2 years |
Average household size:
| Downtown: | 13.2 people |
| Boulder: | 2.1 people |
Percentage of family households:
| Downtown: | 12.1% |
| Boulder: | 26.9% |
| Here: | 5.5% |
| Boulder: | 30.4% |
Percentage of married-couple families with children (among all households):
| Downtown: | 17.8% |
| Boulder: | 32.8% |
Percentage of single-mother households (among all households):
| Downtown: | 49.7% |
| Boulder: | 6.3% |
Percentage of never married males 15 years old and over:
Percentage of never married females 15 years old and over:
| Downtown: | 51.0% |
| Boulder: | 32.7% |
Percentage of never married females 15 years old and over:
| Downtown: | 30.9% |
| city: | 28.3% |
Percentage of people that speak English not well or not at all:
| Downtown: | 0.2% |
| Boulder: | 1.0% |
Percentage of people born in this state:
Percentage of people born in another U.S. state:
Percentage of native residents but born outside the U.S.:
Percentage of foreign born residents:
| Here: | 30.7% |
| Boulder: | 28.3% |
Percentage of people born in another U.S. state:
| Downtown: | 60.3% |
| Boulder: | 60.5% |
Percentage of native residents but born outside the U.S.:
| Here: | 1.0% |
| city: | 2.1% |
Percentage of foreign born residents:
| Here: | 8.0% |
| Boulder: | 9.1% |
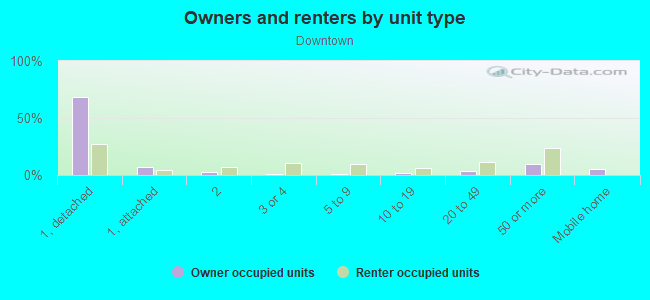
Owner-occupied
Renter-occupied

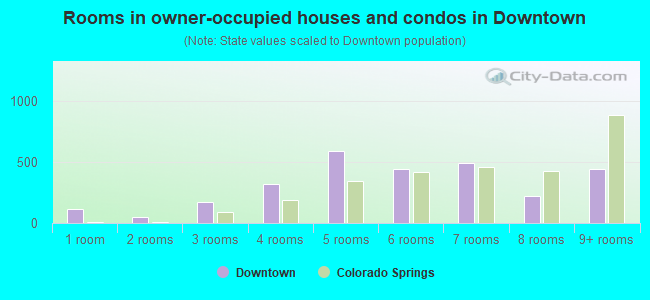
- Rooms in owner-occupied houses and condos in Downtown
- 01 room
- 432 rooms
- 1353 rooms
- 354 rooms
- 545 rooms
- 376 rooms
- 797 rooms
- 4578 rooms
- 1009+ rooms
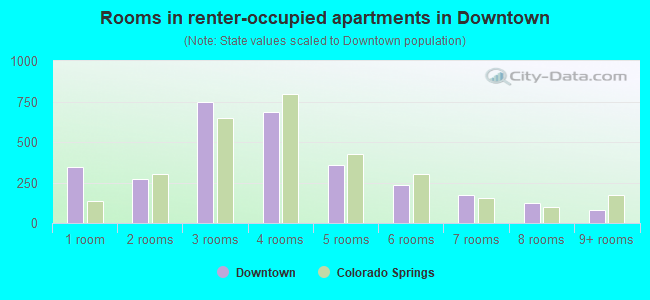
- Rooms in renter-occupied apartments in Downtown
- 1251 room
- 2242 rooms
- 4193 rooms
- 2694 rooms
- 1245 rooms
- 1206 rooms
- 217 rooms
- 128 rooms
- 39+ rooms
Owner-occupied
Renter-occupied
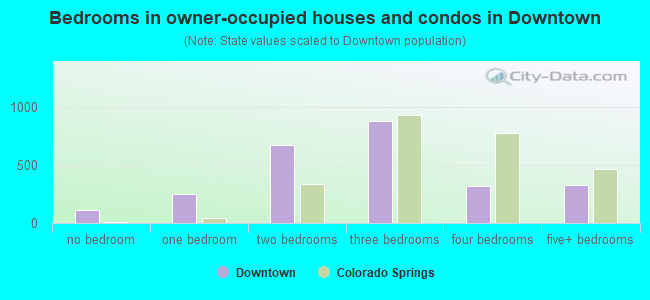
- Bedrooms in owner-occupied houses and condos in Downtown
- 0no bedroom
- 1851 bedroom
- 852 bedrooms
- 493 bedrooms
- 604 bedrooms
- 475+ bedrooms
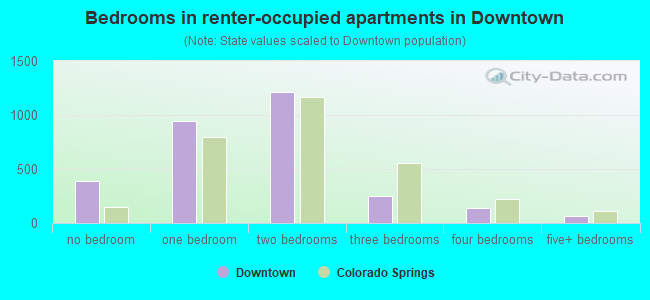
- Bedrooms in renter-occupied apartments in Downtown
- 136no bedroom
- 4281 bedroom
- 6042 bedrooms
- 1173 bedrooms
- 544 bedrooms
- 75+ bedrooms
Average number of cars or other vehicles available in houses/condos:
Average number of cars or other vehicles available in apartments:
| This neighborhood: | 1.6 |
| Boulder: | 1.8 |
Average number of cars or other vehicles available in apartments:
| Here: | 1.3 |
| city: | 1.6 |
Percentage of units with a mortgage:
| Downtown: | 48.5% |
| Boulder: | 60.5% |
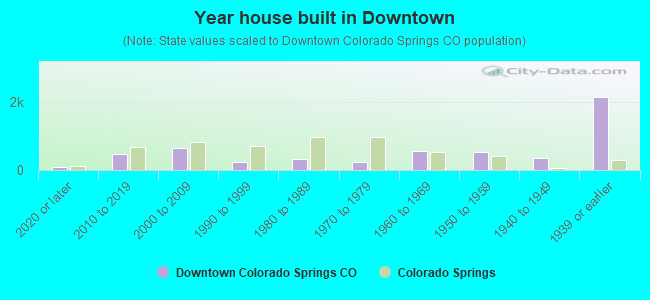
- Year house built in Downtown
- 02020 or later
- 492010 to 2019
- 652000 to 2009
- 2271990 to 1999
- 2031980 to 1989
- 6061970 to 1979
- 1401960 to 1969
- 801950 to 1959
- 361940 to 1949
- 2881939 or earlier
City-data.com crime index for city in 2020 (higher means more crime):
| City: | 275.1 |
| U.S. average: | 219.5 |
Travel time to work (commute)
![Travel time to work (commute)]()
- 8Less than 5 minutes
- 2105 to 9 minutes
- 10410 to 14 minutes
- 10515 to 19 minutes
- 6220 to 24 minutes
- 3525 to 29 minutes
- 530 to 34 minutes
- 2335 to 39 minutes
- 440 to 44 minutes
- 11845 to 59 minutes
- 1060 to 89 minutes
- 3690 or more minutes

Means of transportation to work
![Means of transportation to work]()
- 55.8%974Drove a car alone
- 1.7%29Carpooled
- 5.7%99Bus
- 0.4%7Motorcycle
- 7.5%130Bicycle
- 18.2%317Walked
- 1.8%32Other means
- 15.1%264Worked at home

Time leaving home to go to work
![Time leaving home to go to work]()
- 412:00 a.m. to 4:59 a.m.
- 45:00 a.m. to 5:29 a.m.
- 105:30 a.m. to 5:59 a.m.
- 516:00 a.m. to 6:29 a.m.
- 126:30 a.m. to 6:59 a.m.
- 467:00 a.m. to 7:29 a.m.
- 677:30 a.m. to 7:59 a.m.
- 1178:00 a.m. to 8:29 a.m.
- 518:30 a.m. to 8:59 a.m.
- 679:00 a.m. to 9:59 a.m.
- 4810:00 a.m. to 10:59 a.m.
- 1211:00 a.m. to 11:59 a.m.
- 3512:00 p.m. to 3:59 p.m.
- 1144:00 p.m. to 11:59 p.m.

Occupations of males:
- Percentage of males in management occupations (except farmers):
Here: 10.2% city: 12.9%
- Percentage of males in business and financial operations occupations:
Here: 2.1% city: 7.6%
- Percentage of males in computer and mathematical occupations:
Here: 13.9% city: 10.0%
- Percentage of males in architecture and engineering occupations:
Here: 3.8% city: 6.1%
- Percentage of males in life, physical, and social science occupations:
Here: 9.5% city: 6.1%
- Percentage of males in legal occupations:
Here: 1.2% city: 2.1%
- Percentage of males in education, training, and library occupations:
Here: 2.6% city: 8.1%
- Percentage of males in arts, design, entertainment, sports, and media occupations:
Here: 3.0% city: 3.3%
- Percentage of males in service occupations:
Here: 32.6% city: 14.4%
- Percentage of males in sales and office occupations:
Here: 11.9% city: 14.5%
- Percentage of males in production occupations:
Here: 2.3% city: 2.3%
- Percentage of males in transportation occupations:
Here: 2.6% city: 2.5%
- Percentage of males in material moving occupations:
Here: 4.4% city: 2.4%
Occupations of females:
- Percentage of females in management occupations (except farmers):
Here: 7.2% city: 8.8%
- Percentage of females in business and financial operations occupations:
Here: 6.4% city: 6.4%
- Percentage of females in computer and mathematical occupations:
Here: 3.8% city: 4.6%
- Percentage of females in life, physical, and social science occupations:
Here: 1.6% city: 4.7%
- Percentage of females in community and social services occupations:
Here: 1.4% city: 2.1%
- Percentage of females in legal occupations:
Here: 3.7% city: 1.4%
- Percentage of females in education, training, and library occupations:
Here: 13.1% city: 13.1%
- Percentage of females in arts, design, entertainment, sports, and media occupations:
Here: 5.1% city: 5.5%
- Percentage of females in healthcare practitioners and technical occupations:
Here: 1.4% city: 7.2%
- Percentage of females in service occupations:
Here: 24.4% city: 20.9%
- Percentage of females in sales and office occupations:
Here: 31.7% city: 19.4%
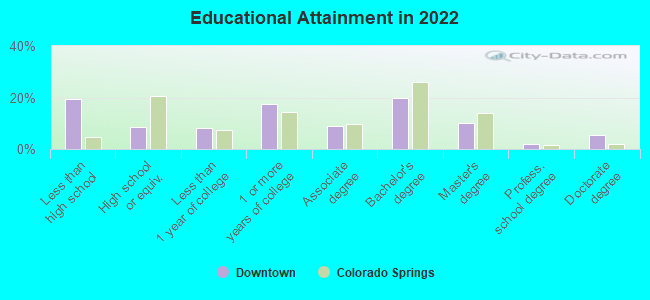
Education in this neighborhood (subdivision or community):
- Percentage of people 3 years and older in K-12 schools:
Downtown: 12.4% Boulder: 8.8%
- Percentage of people 3 years and older in undergraduate colleges:
Downtown: 40.1% Boulder: 28.2%
- Percentage of people 3 years and older in grad. or professional schools:
Downtown: 4.8% Boulder: 6.1%
- Percentage of students K-12 enrolled in private schools:
Downtown: 12.8% Boulder: 8.5%
Percentage of population below poverty level:
| Downtown: | 27.3% |
| Boulder: | 24.1% |
Median year owner moved in (as recorded in 2022):
Median year renter moved in (as recorded in 2022):
| Downtown: | 2011 |
| Boulder: | 2012 |
Median year renter moved in (as recorded in 2022):
| Downtown: | 2019 |
| Boulder: | 2022 |
Percentage of married-couple families with both working:
| Downtown: | 194.9% |
| Boulder: | 76.2% |
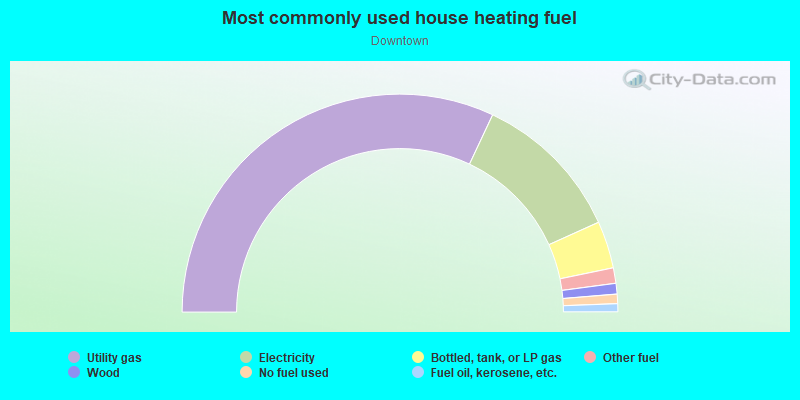
- 44.0%Utility gas
- 30.6%Electricity
- 13.2%No fuel used
- 10.2%Solar energy
- 1.2%Bottled, tank, or LP gas
- 0.8%Wood
Highways in this neighborhood:
Broadway St (State Hwy 7)
Length: 0.12 miles
Direction: N-S
Address range: 1940 to 2098
Direction: N-S
Address range: 1940 to 2098
Roads and streets:
Pearl St (Pearl Pkwy)
Length: 1.20 miles
Direction: E-W
Address range: 800 to 2099
Direction: E-W
Address range: 800 to 2099
Spruce St
Length: 1.18 miles
Direction: E-W
Address range: 800 to 2099
Direction: E-W
Address range: 800 to 2099
Walnut St
Length: 0.92 miles
Direction: E-W
Address range: 800 to 2099
Direction: E-W
Address range: 800 to 2099
Lawry Ln
Length: 0.55 miles
Direction: E-W
Direction: E-W
15th St
Length: 0.15 miles
Direction: N-S
Address range: 1900 to 2099
Direction: N-S
Address range: 1900 to 2099
16th St
Length: 0.15 miles
Directions: N-S, SE-NW
Address range: 1900 to 2099
Directions: N-S, SE-NW
Address range: 1900 to 2099
11th St
Length: 0.15 miles
Direction: N-S
Address range: 1900 to 2099
Direction: N-S
Address range: 1900 to 2099
18th St
Length: 0.15 miles
Direction: N-S
Address range: 1900 to 2099
Direction: N-S
Address range: 1900 to 2099
17th St
Length: 0.15 miles
Direction: N-S
Address range: 1900 to 2099
Direction: N-S
Address range: 1900 to 2099
19th St
Length: 0.15 miles
Direction: N-S
Address range: 1900 to 2099
Direction: N-S
Address range: 1900 to 2099
20th St
Length: 0.15 miles
Direction: N-S
Address range: 1900 to 2099
Direction: N-S
Address range: 1900 to 2099
8th St
Length: 0.15 miles
Direction: N-S
Address range: 1900 to 2099
Direction: N-S
Address range: 1900 to 2099
14th St
Length: 0.15 miles
Direction: N-S
Address range: 1900 to 2049
Direction: N-S
Address range: 1900 to 2049
9th St
Length: 0.15 miles
Direction: N-S
Address range: 1900 to 2099
Direction: N-S
Address range: 1900 to 2099
21st St
Length: 0.15 miles
Direction: N-S
Address range: 1900 to 2099
Direction: N-S
Address range: 1900 to 2099
13th St
Length: 0.12 miles
Direction: N-S
Address range: 1942 to 2099
Direction: N-S
Address range: 1942 to 2099
10th St
Length: 0.07 miles
Direction: N-S
Address range: 2000 to 2099
Direction: N-S
Address range: 2000 to 2099