Donovan Estates neighborhood in Yuma, Arizona (AZ), 85364 detailed profile
Settings
X

Business Search - 14 Million verified businesses
Area: 0.132 square miles
Population: 659
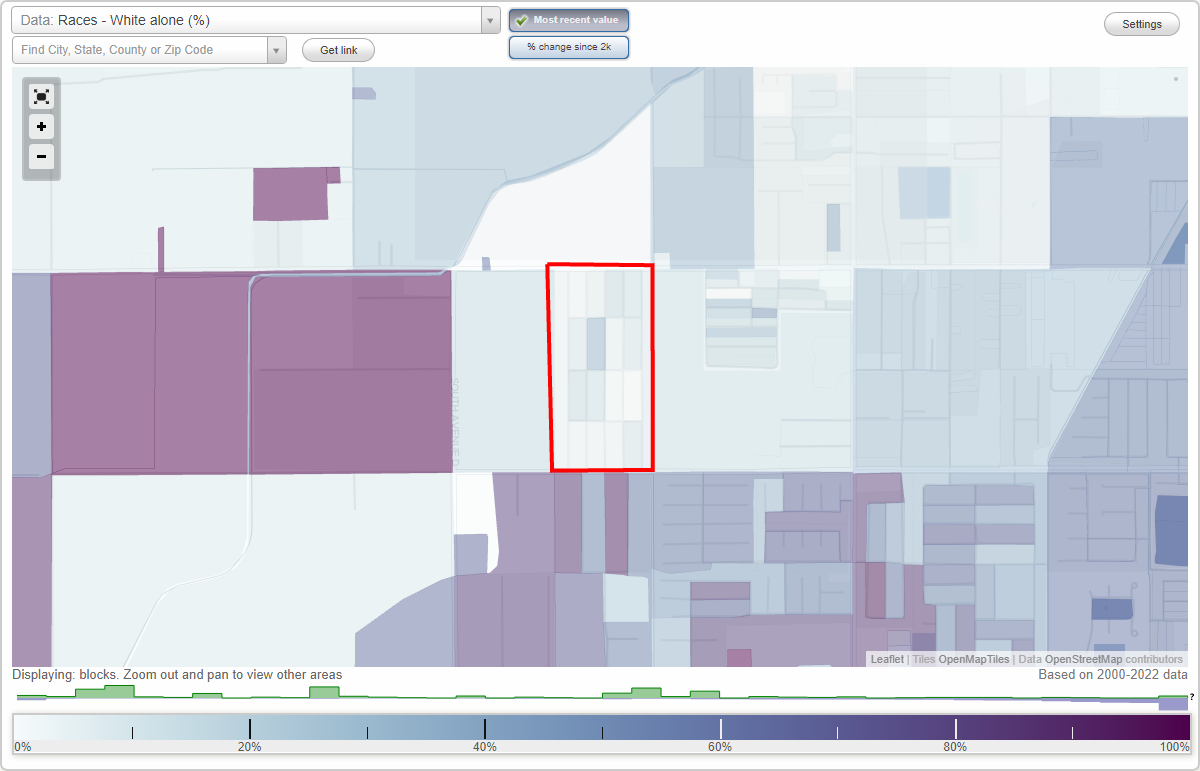
Population density:
| Donovan Estates: | 4,996 people per square mile |
| Yuma: | 924 people per square mile |

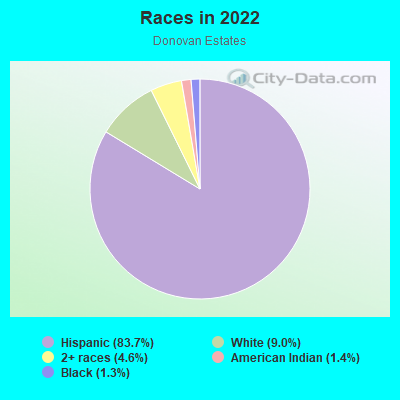
- 58583.7%Hispanic or Latino
- 639.0%White
- 324.6%Two or more races
- 101.4%American Indian
- 91.3%Black
Median household income in 2022:
| Donovan Estates: | $57,679 |
| Yuma: | $58,043 |
Distribution of median household income
![Distribution of median household income]()
- 2Less than $10,000
- 21$10,000 to $19,999
- 40$20,000 to $29,999
- 50$30,000 to $39,999
- 34$40,000 to $49,999
- 11$50,000 to $59,999
- 20$60,000 to $74,999
- 48$75,000 to $99,999
- 62$100,000 to $124,999
- 1$125,000 to $149,999
- 5$150,000 to $199,999
- 10$200,000 or more

Distribution of owner-occupied house/condo value
![Distribution of owner-occupied house/condo value]()
- 33Less than $50,000
- 73$50,000 to $99,999
- 17$100,000 to $149,999
- 35$150,000 to $199,999
- 70$200,000 to $249,999
- 6$250,000 to $299,999
- 22$300,000 to $399,999
- 7$500,000 to $749,999
- 6$750,000 to $999,999

Distribution of rent paid by renters
![Distribution of rent paid by renters]()
- 16$400 to $499
- 8$500 to $599
- 36$800 to $899
- 6$900 to $999

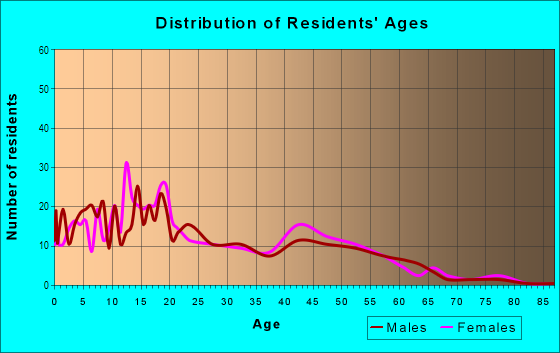
| Males: | 353 |
| Females: | 305 |
Males:
| This neighborhood: | 33.9 years |
| Whole city: | 30.9 years |
| This neighborhood: | 40.6 years |
| Whole city: | 34.5 years |
Average household size:
| Donovan Estates: | 3.1 people |
| Yuma: | 2.5 people |
Percentage of family households:
| Donovan Estates: | 42.6% |
| Yuma: | 50.2% |
| Here: | 50.6% |
| Yuma: | 48.2% |
Percentage of married-couple families with children (among all households):
| Donovan Estates: | 40.0% |
| Yuma: | 27.1% |
Percentage of single-mother households (among all households):
| Donovan Estates: | 13.0% |
| Yuma: | 9.1% |
Percentage of never married males 15 years old and over:
Percentage of never married females 15 years old and over:
| Donovan Estates: | 12.0% |
| Yuma: | 17.2% |
Percentage of never married females 15 years old and over:
| Donovan Estates: | 9.8% |
| city: | 14.0% |
Percentage of people that speak English not well or not at all:
| Donovan Estates: | 27.2% |
| Yuma: | 8.1% |
Percentage of people born in this state:
Percentage of people born in another U.S. state:
Percentage of native residents but born outside the U.S.:
Percentage of foreign born residents:
| Here: | 43.8% |
| Yuma: | 41.5% |
Percentage of people born in another U.S. state:
| Donovan Estates: | 22.4% |
| Yuma: | 36.5% |
Percentage of native residents but born outside the U.S.:
| Here: | 1.9% |
| city: | 2.6% |
Percentage of foreign born residents:
| Here: | 31.9% |
| Yuma: | 19.4% |
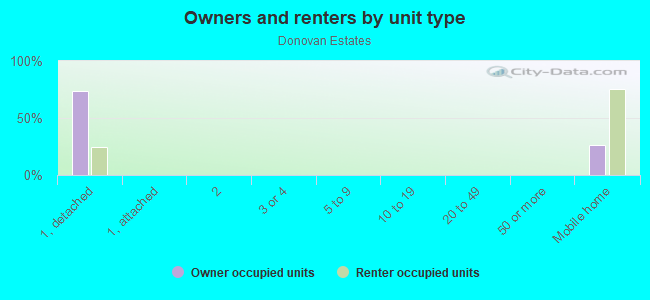
Owner-occupied
Renter-occupied

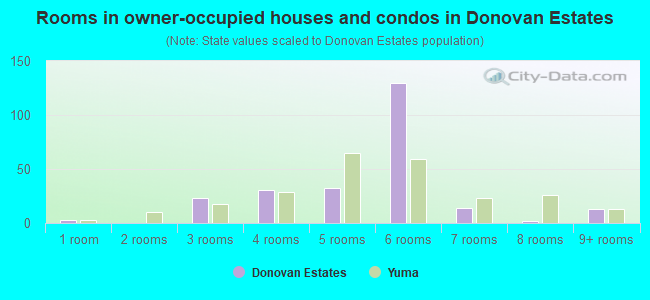
- Rooms in owner-occupied houses and condos in Donovan Estates
- 31 room
- 02 rooms
- 233 rooms
- 314 rooms
- 325 rooms
- 1306 rooms
- 147 rooms
- 28 rooms
- 139+ rooms
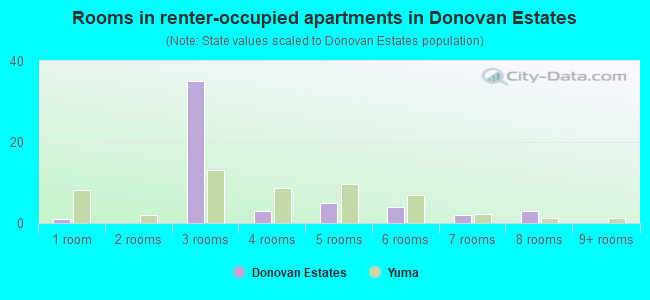
- Rooms in renter-occupied apartments in Donovan Estates
- 11 room
- 02 rooms
- 353 rooms
- 34 rooms
- 55 rooms
- 46 rooms
- 27 rooms
- 38 rooms
- 09+ rooms
Owner-occupied
Renter-occupied
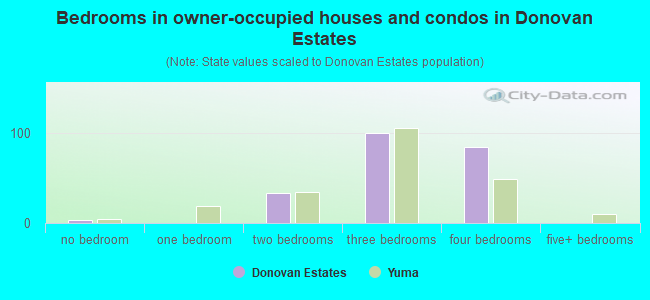
- Bedrooms in owner-occupied houses and condos in Donovan Estates
- 3no bedroom
- 01 bedroom
- 342 bedrooms
- 1013 bedrooms
- 854 bedrooms
- 05+ bedrooms
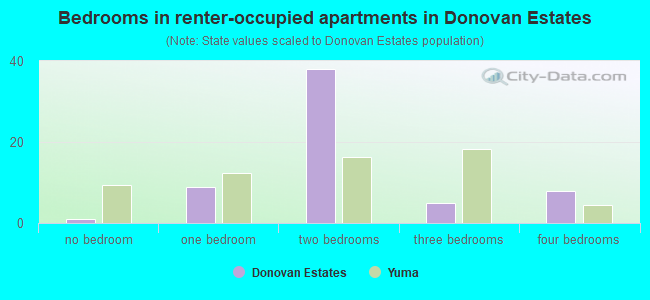
- Bedrooms in renter-occupied apartments in Donovan Estates
- 1no bedroom
- 91 bedroom
- 382 bedrooms
- 53 bedrooms
- 84 bedrooms
- 05+ bedrooms
Average number of cars or other vehicles available in houses/condos:
Average number of cars or other vehicles available in apartments:
| This neighborhood: | 1.8 |
| Yuma: | 2.1 |
Average number of cars or other vehicles available in apartments:
| Here: | 1.2 |
| city: | 1.3 |
Percentage of units with a mortgage:
| Donovan Estates: | 34.3% |
| Yuma: | 59.1% |
Average estimated value of detached houses in 2022 (61.0% of all units):
| Donovan Estates: | $207,871 |
| Yuma: | $212,447 |
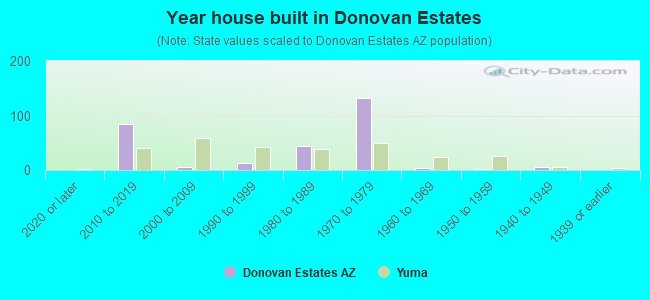
- Year house built in Donovan Estates
- 02020 or later
- 852010 to 2019
- 52000 to 2009
- 121990 to 1999
- 441980 to 1989
- 1321970 to 1979
- 41960 to 1969
- 21950 to 1959
- 61940 to 1949
- 01939 or earlier
City-data.com crime index for city in 2020 (higher means more crime):
| City: | 243.7 |
| U.S. average: | 219.5 |
Travel time to work (commute)
![Travel time to work (commute)]()
- 225 to 9 minutes
- 2110 to 14 minutes
- 10315 to 19 minutes
- 8120 to 24 minutes
- 2725 to 29 minutes
- 3330 to 34 minutes
- 245 to 59 minutes
- 2460 to 89 minutes

Means of transportation to work
![Means of transportation to work]()
- 99.2%252Drove a car alone
- 0.4%1Carpooled
- 0.4%1Motorcycle
- 0.8%2Other means
- 4.3%11Worked at home

Time leaving home to go to work
![Time leaving home to go to work]()
- 5212:00 a.m. to 4:59 a.m.
- 65:00 a.m. to 5:29 a.m.
- 15:30 a.m. to 5:59 a.m.
- 136:00 a.m. to 6:29 a.m.
- 306:30 a.m. to 6:59 a.m.
- 557:00 a.m. to 7:29 a.m.
- 717:30 a.m. to 7:59 a.m.
- 78:00 a.m. to 8:29 a.m.
- 28:30 a.m. to 8:59 a.m.
- 169:00 a.m. to 9:59 a.m.
- 410:00 a.m. to 10:59 a.m.
- 1511:00 a.m. to 11:59 a.m.
- 1612:00 p.m. to 3:59 p.m.
- 184:00 p.m. to 11:59 p.m.

Occupations of males:
- Percentage of males in management occupations (except farmers):
Here: 2.3% city: 7.9%
- Percentage of males in service occupations:
Here: 28.0% city: 18.5%
- Percentage of males in sales and office occupations:
Here: 2.7% city: 16.9%
- Percentage of males in farming, fishing, and forestry occupations:
Here: 7.5% city: 3.8%
- Percentage of males in construction, extraction, and maintenance occupations:
Here: 9.3% city: 6.9%
- Percentage of males in production occupations:
Here: 26.1% city: 5.7%
- Percentage of males in transportation occupations:
Here: 1.4% city: 9.0%
- Percentage of males in material moving occupations:
Here: 11.6% city: 7.3%
Occupations of females:
- Percentage of females in management occupations (except farmers):
Here: 1.8% city: 8.0%
- Percentage of females in computer and mathematical occupations:
Here: 2.1% city: 1.3%
- Percentage of females in education, training, and library occupations:
Here: 30.1% city: 8.8%
- Percentage of females in healthcare practitioners and technical occupations:
Here: 2.2% city: 9.2%
- Percentage of females in service occupations:
Here: 23.8% city: 24.0%
- Percentage of females in sales and office occupations:
Here: 15.3% city: 32.5%
- Percentage of females in farming, fishing, and forestry occupations:
Here: 3.1% city: 0.4%
- Percentage of females in material moving occupations:
Here: 21.5% city: 2.2%
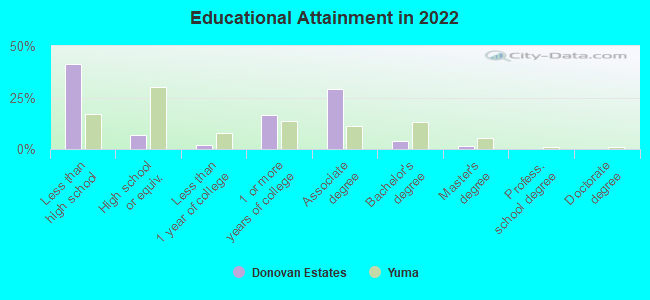
Education in this neighborhood (subdivision or community):
- Percentage of people 3 years and older in K-12 schools:
Donovan Estates: 19.6% Yuma: 18.6%
- Percentage of people 3 years and older in undergraduate colleges:
Donovan Estates: 1.4% Yuma: 4.4%
- Percentage of people 3 years and older in grad. or professional schools:
Donovan Estates: 0.8% Yuma: 0.6%
- Percentage of students K-12 enrolled in private schools:
Donovan Estates: 0.8% Yuma: 14.7%
Percentage of population below poverty level:
| Donovan Estates: | 16.6% |
| Yuma: | 9.8% |
Median year owner moved in (as recorded in 2022):
Median year renter moved in (as recorded in 2022):
| Donovan Estates: | 2008 |
| Yuma: | 2015 |
Median year renter moved in (as recorded in 2022):
| Donovan Estates: | 2014 |
| Yuma: | 2021 |
Percentage of married-couple families with both working:
| Donovan Estates: | 31.3% |
| Yuma: | 58.7% |
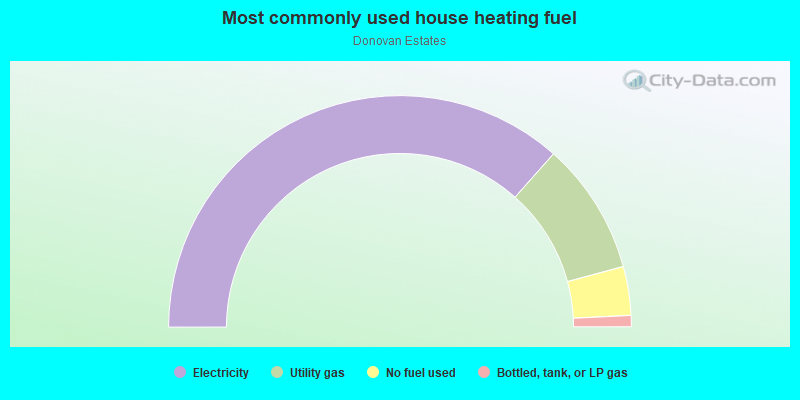
- 73.1%Electricity
- 18.5%Utility gas
- 6.8%No fuel used
- 1.6%Bottled, tank, or LP gas
Roads and streets:
S Mohave Ln
Length: 0.49 miles
Direction: N-S
Address range: 8100 to 8499
Direction: N-S
Address range: 8100 to 8499
S Pima Ln
Length: 0.38 miles
Direction: N-S
Address range: 8100 to 8399
Direction: N-S
Address range: 8100 to 8399
S Apache Ln
Length: 0.38 miles
Direction: N-S
Address range: 8100 to 8399
Direction: N-S
Address range: 8100 to 8399
S Coconino Ln
Length: 0.38 miles
Direction: N-S
Address range: 8100 to 8399
Direction: N-S
Address range: 8100 to 8399
S Yavapai Ln
Length: 0.38 miles
Direction: N-S
Address range: 8100 to 8399
Direction: N-S
Address range: 8100 to 8399
W 8th St
Length: 0.30 miles
Direction: E-W
Address range: 4492 to 4711
Direction: E-W
Address range: 4492 to 4711
W Crane St
Length: 0.22 miles
Direction: E-W
Direction: E-W
W Primrose St
Length: 0.22 miles
Direction: E-W
Direction: E-W
W Maricopa St
Length: 0.22 miles
Direction: E-W
Address range: 4869 to 4877
Direction: E-W
Address range: 4869 to 4877