Dentwood (Southbridge) neighborhood in San Jose, California (CA), 95118 detailed profile
Settings
X


Business Search - 14 Million verified businesses
Area: 0.113 square miles
Population: 1,333
Population density:
| Dentwood (Southbridge): | 11,745 people per square mile |
| San Jose: | 5,554 people per square mile |

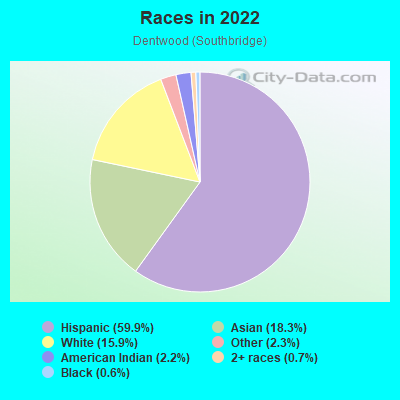
- 80559.9%Hispanic or Latino
- 24618.3%Asian
- 21415.9%White
- 312.3%Some other race
- 292.2%American Indian
- 100.7%Two or more races
- 80.6%Black
Median household income in 2022:
| Dentwood (Southbridge): | $133,588 |
| San Jose: | $133,835 |
Distribution of median household income
![Distribution of median household income]()
- 17Less than $10,000
- 53$10,000 to $19,999
- 20$20,000 to $29,999
- 8$30,000 to $39,999
- 34$40,000 to $49,999
- 8$50,000 to $59,999
- 19$60,000 to $74,999
- 19$75,000 to $99,999
- 100$100,000 to $124,999
- 24$125,000 to $149,999
- 68$150,000 to $199,999
- 89$200,000 or more

Distribution of owner-occupied house/condo value
![Distribution of owner-occupied house/condo value]()
- 24$750,000 to $999,999
- 95$1,000,000 or more

Distribution of rent paid by renters
![Distribution of rent paid by renters]()
- 17$200 to $299
- 22$300 to $399
- 6$400 to $499
- 7$700 to $799
- 15$800 to $899
- 17$1,000 to $1,249
- 37$1,250 to $1,499
- 32$1,500 to $1,999
- 172$2,000 or more

Median rent in 2022:
| Dentwood (Southbridge): | $2,151 |
| San Jose: | $2,001 |
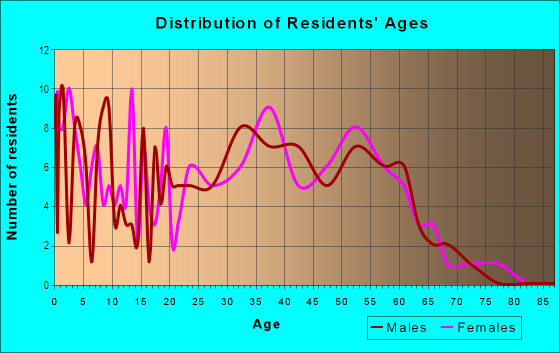
| Males: | 688 |
| Females: | 645 |
Males:
| This neighborhood: | 44.1 years |
| Whole city: | 37.6 years |
| This neighborhood: | 39.3 years |
| Whole city: | 39.1 years |
Average household size:
| Dentwood (Southbridge): | 2.6 people |
| San Jose: | 2.9 people |
Percentage of family households:
| Dentwood (Southbridge): | 53.5% |
| San Jose: | 49.9% |
| Here: | 44.3% |
| San Jose: | 53.0% |
Percentage of married-couple families with children (among all households):
| Dentwood (Southbridge): | 19.1% |
| San Jose: | 25.8% |
Percentage of single-mother households (among all households):
| Dentwood (Southbridge): | 4.6% |
| San Jose: | 5.2% |
Percentage of never married males 15 years old and over:
Percentage of never married females 15 years old and over:
| Dentwood (Southbridge): | 32.1% |
| San Jose: | 20.9% |
Percentage of never married females 15 years old and over:
| Dentwood (Southbridge): | 19.7% |
| city: | 16.7% |
Percentage of people that speak English not well or not at all:
| Dentwood (Southbridge): | 5.6% |
| San Jose: | 11.4% |
Percentage of people born in this state:
Percentage of people born in another U.S. state:
Percentage of native residents but born outside the U.S.:
Percentage of foreign born residents:
| Here: | 53.0% |
| San Jose: | 46.1% |
Percentage of people born in another U.S. state:
| Dentwood (Southbridge): | 15.1% |
| San Jose: | 10.4% |
Percentage of native residents but born outside the U.S.:
| Here: | 1.8% |
| city: | 1.7% |
Percentage of foreign born residents:
| Here: | 30.2% |
| San Jose: | 41.8% |
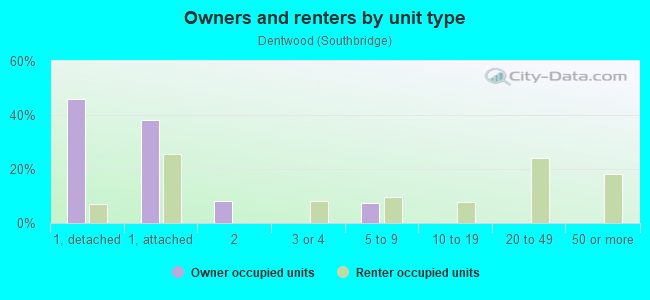
Owner-occupied
Renter-occupied

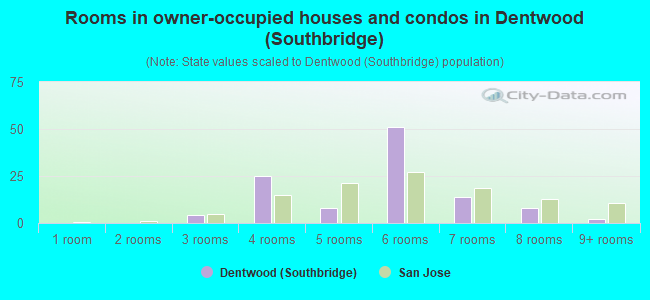
- Rooms in owner-occupied houses and condos in Dentwood <
> - 01 room
- 02 rooms
- 43 rooms
- 254 rooms
- 85 rooms
- 516 rooms
- 147 rooms
- 88 rooms
- 29+ rooms
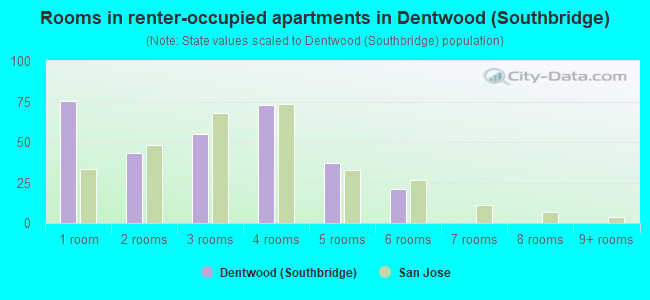
- Rooms in renter-occupied apartments in Dentwood <
> - 751 room
- 432 rooms
- 553 rooms
- 734 rooms
- 375 rooms
- 216 rooms
- 07 rooms
- 08 rooms
- 09+ rooms
Owner-occupied
Renter-occupied
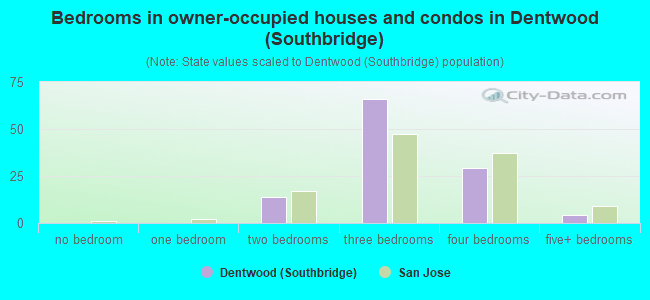
- Bedrooms in owner-occupied houses and condos in Dentwood <
> - 0no bedroom
- 01 bedroom
- 142 bedrooms
- 663 bedrooms
- 294 bedrooms
- 45+ bedrooms
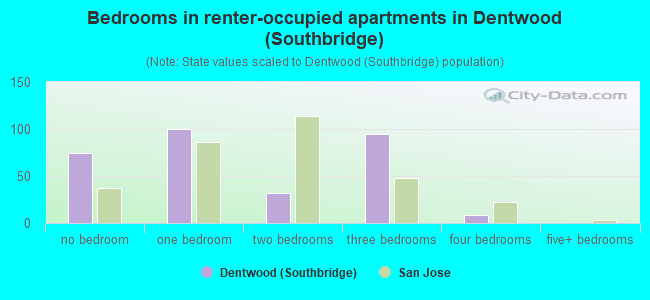
- Bedrooms in renter-occupied apartments in Dentwood <
> - 75no bedroom
- 1001 bedroom
- 322 bedrooms
- 953 bedrooms
- 94 bedrooms
- 05+ bedrooms
Average number of cars or other vehicles available in houses/condos:
Average number of cars or other vehicles available in apartments:
| This neighborhood: | 2.9 |
| San Jose: | 2.3 |
Average number of cars or other vehicles available in apartments:
| Here: | 1.9 |
| city: | 1.6 |
Percentage of units with a mortgage:
| Dentwood (Southbridge): | 83.4% |
| San Jose: | 66.9% |
Average estimated value of townhouses or other attached units in 2022 (26.3% of all units):
| This neighborhood: | $937,800 |
| city: | $1,024,857 |
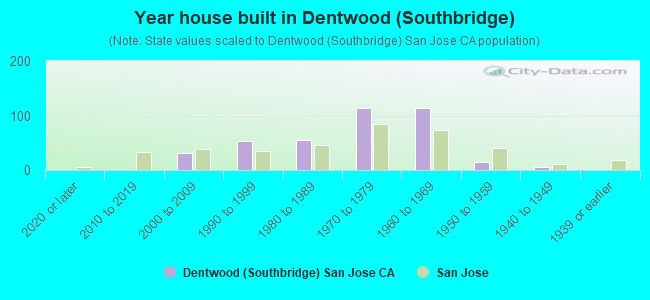
- Year house built in Dentwood <
> - 02020 or later
- 02010 to 2019
- 312000 to 2009
- 531990 to 1999
- 551980 to 1989
- 1141970 to 1979
- 1141960 to 1969
- 151950 to 1959
- 51940 to 1949
- 01939 or earlier
City-data.com crime index for city in 2020 (higher means more crime):
| City: | 268.4 |
| U.S. average: | 219.5 |
Travel time to work (commute)
![Travel time to work (commute)]()
- 30Less than 5 minutes
- 155 to 9 minutes
- 6810 to 14 minutes
- 6415 to 19 minutes
- 5720 to 24 minutes
- 2425 to 29 minutes
- 6230 to 34 minutes
- 835 to 39 minutes
- 1240 to 44 minutes
- 1845 to 59 minutes
- 2660 to 89 minutes
- 1190 or more minutes

Means of transportation to work
![Means of transportation to work]()
- 69.4%435Drove a car alone
- 8.6%54Carpooled
- 1.1%7Bus
- 1.3%8Long-distance train or commuter rail
- 1.4%9Light rail, streetcar or trolley
- 1.1%7Bicycle
- 3.5%22Walked
- 0.8%5Other means
- 19.8%124Worked at home

Time leaving home to go to work
![Time leaving home to go to work]()
- 1412:00 a.m. to 4:59 a.m.
- 45:00 a.m. to 5:29 a.m.
- 335:30 a.m. to 5:59 a.m.
- 66:00 a.m. to 6:29 a.m.
- 126:30 a.m. to 6:59 a.m.
- 797:00 a.m. to 7:29 a.m.
- 587:30 a.m. to 7:59 a.m.
- 688:00 a.m. to 8:29 a.m.
- 448:30 a.m. to 8:59 a.m.
- 379:00 a.m. to 9:59 a.m.
- 1810:00 a.m. to 10:59 a.m.
- 511:00 a.m. to 11:59 a.m.
- 1212:00 p.m. to 3:59 p.m.
- 244:00 p.m. to 11:59 p.m.

Occupations of males:
- Percentage of males in management occupations (except farmers):
Here: 6.2% city: 13.0%
- Percentage of males in business and financial operations occupations:
Here: 11.4% city: 4.6%
- Percentage of males in computer and mathematical occupations:
Here: 12.5% city: 13.6%
- Percentage of males in architecture and engineering occupations:
Here: 1.3% city: 10.2%
- Percentage of males in service occupations:
Here: 19.5% city: 12.7%
- Percentage of males in sales and office occupations:
Here: 9.1% city: 12.8%
- Percentage of males in construction, extraction, and maintenance occupations:
Here: 6.4% city: 7.8%
- Percentage of males in production occupations:
Here: 3.1% city: 5.5%
- Percentage of males in transportation occupations:
Here: 8.5% city: 3.6%
Occupations of females:
- Percentage of females in management occupations (except farmers):
Here: 5.0% city: 11.0%
- Percentage of females in business and financial operations occupations:
Here: 4.5% city: 8.6%
- Percentage of females in architecture and engineering occupations:
Here: 3.1% city: 2.8%
- Percentage of females in life, physical, and social science occupations:
Here: 3.2% city: 1.7%
- Percentage of females in education, training, and library occupations:
Here: 11.5% city: 8.1%
- Percentage of females in healthcare practitioners and technical occupations:
Here: 14.7% city: 6.8%
- Percentage of females in service occupations:
Here: 37.1% city: 21.7%
- Percentage of females in sales and office occupations:
Here: 20.3% city: 22.0%
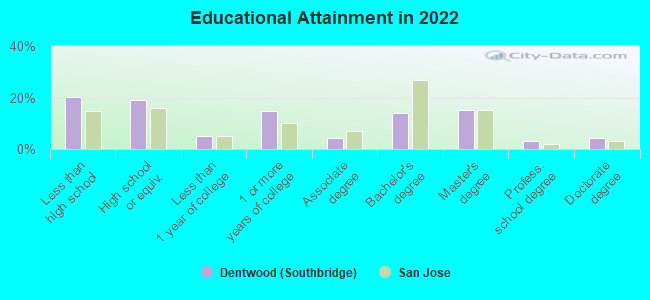
Education in this neighborhood (subdivision or community):
- Percentage of people 3 years and older in K-12 schools:
Dentwood (Southbridge): 26.1% San Jose: 16.1%
- Percentage of people 3 years and older in undergraduate colleges:
Dentwood (Southbridge): 6.8% San Jose: 6.5%
- Percentage of people 3 years and older in grad. or professional schools:
Dentwood (Southbridge): 3.9% San Jose: 2.0%
- Percentage of students K-12 enrolled in private schools:
Dentwood (Southbridge): 6.3% San Jose: 14.9%
Percentage of population below poverty level:
| Dentwood (Southbridge): | 5.6% |
| San Jose: | 9.0% |
Median year owner moved in (as recorded in 2022):
Median year renter moved in (as recorded in 2022):
| Dentwood (Southbridge): | 2009 |
| San Jose: | 2008 |
Median year renter moved in (as recorded in 2022):
| Dentwood (Southbridge): | 2011 |
| San Jose: | 2020 |
Percentage of married-couple families with both working:
| Dentwood (Southbridge): | 99.9% |
| San Jose: | 72.5% |
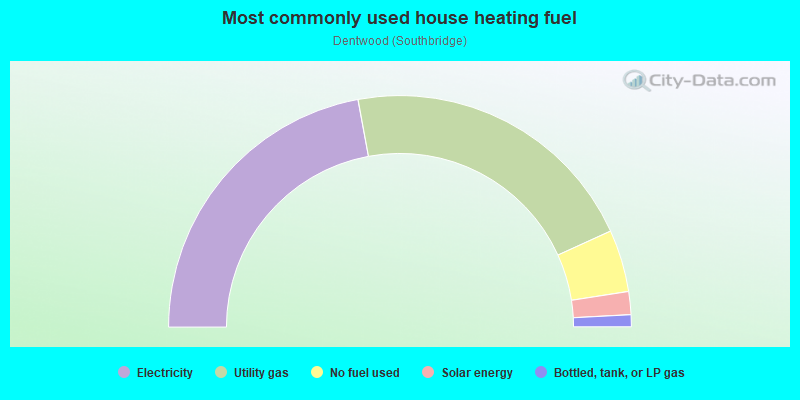
- 44.2%Electricity
- 42.2%Utility gas
- 8.7%No fuel used
- 3.2%Solar energy
- 1.7%Bottled, tank, or LP gas
Roads and streets:
Dentwood Dr
Length: 0.45 miles
Directions: E-W, N-S, SE-NW, SW-NE
Address range: 1274 to 1368
Directions: E-W, N-S, SE-NW, SW-NE
Address range: 1274 to 1368
Blossom Hill Rd
Length: 0.29 miles
Direction: SW-NE
Address range: 1261 to 12399
Direction: SW-NE
Address range: 1261 to 12399
Southbridge Pl
Length: 0.24 miles
Directions: E-W, N-S, SE-NW, SW-NE
Address range: 5200 to 5399
Directions: E-W, N-S, SE-NW, SW-NE
Address range: 5200 to 5399
Larchwood Dr
Length: 0.22 miles
Directions: N-S, SE-NW
Address range: 5200 to 5399
Directions: N-S, SE-NW
Address range: 5200 to 5399
Rimwood Dr
Length: 0.22 miles
Directions: N-S, SE-NW
Address range: 5200 to 5399
Directions: N-S, SE-NW
Address range: 5200 to 5399
Garwood Dr
Length: 0.22 miles
Directions: N-S, SE-NW
Address range: 5200 to 5399
Directions: N-S, SE-NW
Address range: 5200 to 5399
Ayrshire Dr
Length: 0.21 miles
Directions: N-S, SE-NW
Address range: 5300 to 5499
Directions: N-S, SE-NW
Address range: 5300 to 5499
Ridgewood Dr
Length: 0.19 miles
Direction: E-W
Address range: 1300 to 1343
Direction: E-W
Address range: 1300 to 1343
Ironbridge Way
Length: 0.16 miles
Direction: E-W
Address range: 1200 to 1299
Direction: E-W
Address range: 1200 to 1299
Coniston Way
Length: 0.14 miles
Directions: N-S, SE-NW, SW-NE
Address range: 5600 to 5604
Directions: N-S, SE-NW, SW-NE
Address range: 5600 to 5604
Coniston Ct
Length: 0.13 miles
Directions: E-W, N-S
Directions: E-W, N-S
Foxwood Dr
Length: 0.10 miles
Directions: E-W, N-S, SE-NW, SW-NE
Address range: 1200 to 1299
Directions: E-W, N-S, SE-NW, SW-NE
Address range: 1200 to 1299
Greenbank Ct
Length: 0.07 miles
Direction: SE-NW
Address range: 5300 to 5499
Direction: SE-NW
Address range: 5300 to 5499
Foxwood Way
Length: 0.06 miles
Directions: E-W, N-S
Address range: 1283 to 1299
Directions: E-W, N-S
Address range: 1283 to 1299
Southbridge Ct
Length: 0.06 miles
Directions: N-S, SE-NW
Address range: 5300 to 5499
Directions: N-S, SE-NW
Address range: 5300 to 5499
Hennessy Pl
Length: 0.03 miles
Direction: SE-NW
Direction: SE-NW