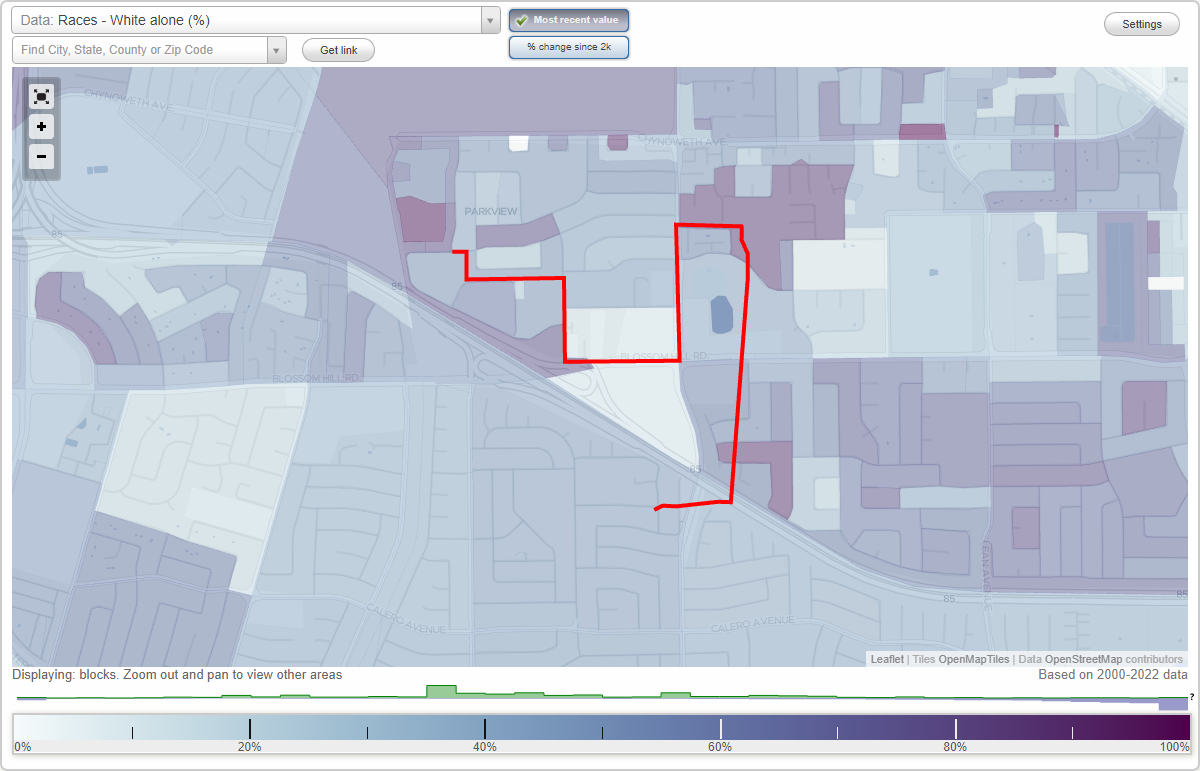
Del Robles neighborhood in San Jose, California (CA), 95123, 95136 detailed profile
Settings
X

Business Search - 14 Million verified businesses
Area: 0.228 square miles
Population: 1,964
Population density:
| Del Robles: | 8,601 people per square mile |
| San Jose: | 5,554 people per square mile |

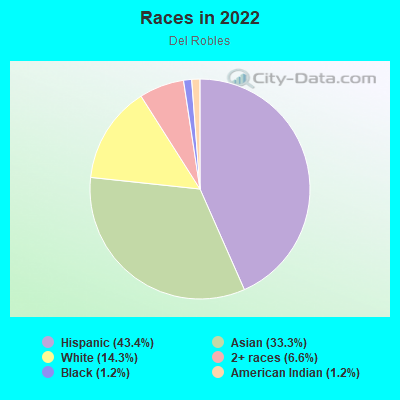
- 86243.4%Hispanic or Latino
- 66133.3%Asian
- 28514.3%White
- 1316.6%Two or more races
- 241.2%Black
- 241.2%American Indian
Median household income in 2022:
| Del Robles: | $125,784 |
| San Jose: | $133,835 |
Distribution of median household income
![Distribution of median household income]()
- 26Less than $10,000
- 23$10,000 to $19,999
- 77$20,000 to $29,999
- 68$30,000 to $39,999
- 46$40,000 to $49,999
- 12$50,000 to $59,999
- 50$60,000 to $74,999
- 49$75,000 to $99,999
- 117$100,000 to $124,999
- 33$125,000 to $149,999
- 144$150,000 to $199,999
- 206$200,000 or more

Distribution of owner-occupied house/condo value
![Distribution of owner-occupied house/condo value]()
- 10Less than $50,000
- 3$50,000 to $99,999
- 14$100,000 to $149,999
- 20$250,000 to $299,999
- 18$300,000 to $399,999
- 11$400,000 to $499,999
- 54$500,000 to $749,999
- 64$750,000 to $999,999
- 273$1,000,000 or more

Distribution of rent paid by renters
![Distribution of rent paid by renters]()
- 75$200 to $299
- 127$300 to $399
- 17$500 to $599
- 18$600 to $699
- 10$700 to $799
- 56$800 to $899
- 10$1,500 to $1,999
- 202$2,000 or more

Median rent in 2022:
| Del Robles: | $2,774 |
| San Jose: | $2,001 |
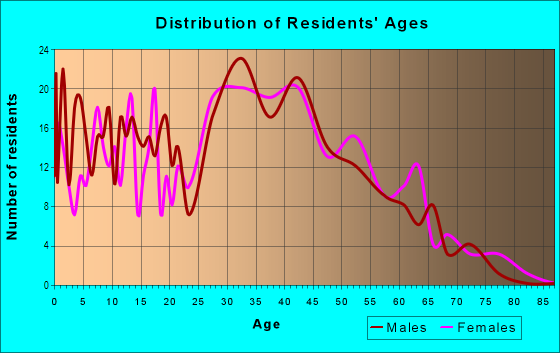
| Males: | 1,074 |
| Females: | 890 |
Males:
| This neighborhood: | 36.1 years |
| Whole city: | 37.6 years |
| This neighborhood: | 39.7 years |
| Whole city: | 39.1 years |
Average household size:
| Del Robles: | 2.8 people |
| San Jose: | 2.9 people |
Percentage of family households:
| Del Robles: | 70.0% |
| San Jose: | 49.9% |
| Here: | 60.3% |
| San Jose: | 53.0% |
Percentage of married-couple families with children (among all households):
| Del Robles: | 24.1% |
| San Jose: | 25.8% |
Percentage of single-mother households (among all households):
| Del Robles: | 1.8% |
| San Jose: | 5.2% |
Percentage of never married males 15 years old and over:
Percentage of never married females 15 years old and over:
| Del Robles: | 25.5% |
| San Jose: | 20.9% |
Percentage of never married females 15 years old and over:
| Del Robles: | 15.6% |
| city: | 16.7% |
Percentage of people that speak English not well or not at all:
| Del Robles: | 1.4% |
| San Jose: | 11.4% |
Percentage of people born in this state:
Percentage of people born in another U.S. state:
Percentage of native residents but born outside the U.S.:
Percentage of foreign born residents:
| Here: | 53.5% |
| San Jose: | 46.1% |
Percentage of people born in another U.S. state:
| Del Robles: | 11.2% |
| San Jose: | 10.4% |
Percentage of native residents but born outside the U.S.:
| Here: | 0.2% |
| city: | 1.7% |
Percentage of foreign born residents:
| Here: | 35.2% |
| San Jose: | 41.8% |
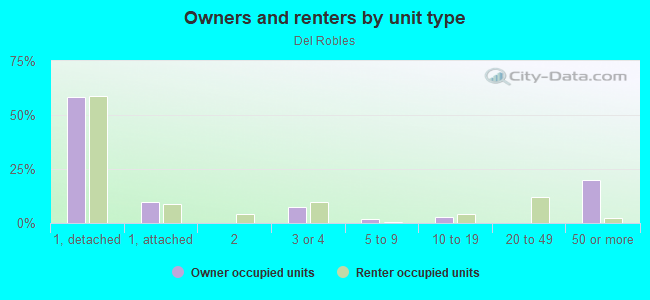
Owner-occupied
Renter-occupied

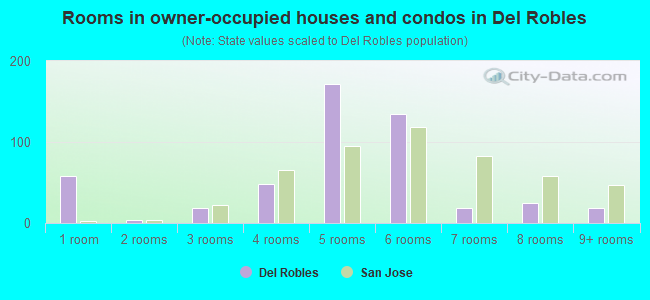
- Rooms in owner-occupied houses and condos in Del Robles
- 581 room
- 42 rooms
- 193 rooms
- 484 rooms
- 1725 rooms
- 1356 rooms
- 187 rooms
- 258 rooms
- 189+ rooms
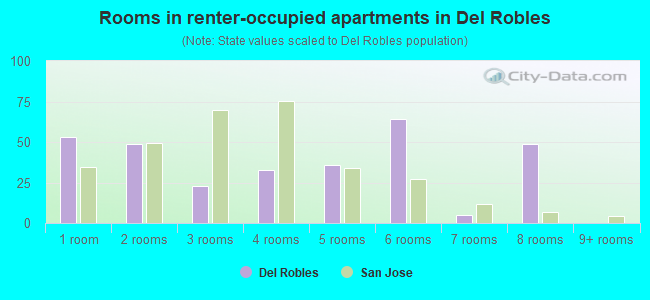
- Rooms in renter-occupied apartments in Del Robles
- 531 room
- 492 rooms
- 233 rooms
- 334 rooms
- 365 rooms
- 646 rooms
- 57 rooms
- 498 rooms
- 09+ rooms
Owner-occupied
Renter-occupied
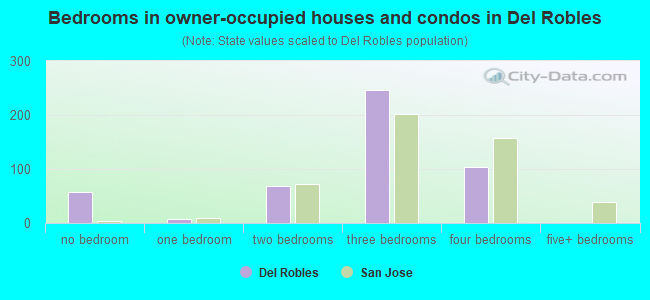
- Bedrooms in owner-occupied houses and condos in Del Robles
- 58no bedroom
- 71 bedroom
- 682 bedrooms
- 2473 bedrooms
- 1034 bedrooms
- 05+ bedrooms
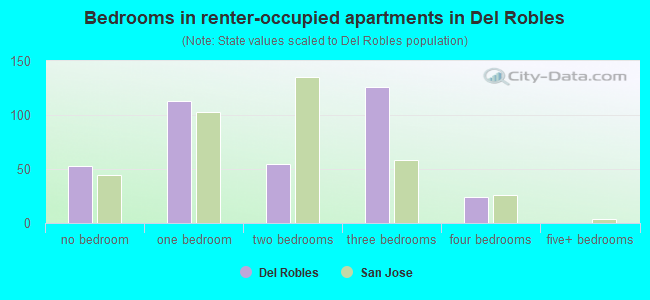
- Bedrooms in renter-occupied apartments in Del Robles
- 53no bedroom
- 1131 bedroom
- 552 bedrooms
- 1263 bedrooms
- 244 bedrooms
- 05+ bedrooms
Average number of cars or other vehicles available in houses/condos:
Average number of cars or other vehicles available in apartments:
| This neighborhood: | 2.2 |
| San Jose: | 2.3 |
Average number of cars or other vehicles available in apartments:
| Here: | 2.4 |
| city: | 1.6 |
Percentage of units with a mortgage:
| Del Robles: | 80.2% |
| San Jose: | 66.9% |
Housing prices:
- Average estimated value of detached houses in 2022 (77.2% of all units):
Del Robles: $600,950 San Jose: $1,532,815
- Average estimated value of townhouses or other attached units in 2022 (9.4% of all units):
This neighborhood: $2,209,357 city: $1,024,857
- Average estimated '22 value of housing units in 3-to-4-unit structures (11.0% of all units):
Del Robles: $664,418 city: $781,695
- Average estimated '22 value of housing units in 5-or-more-unit structures (1.0% of all units):
Del Robles: $147,339 San Jose: $791,954
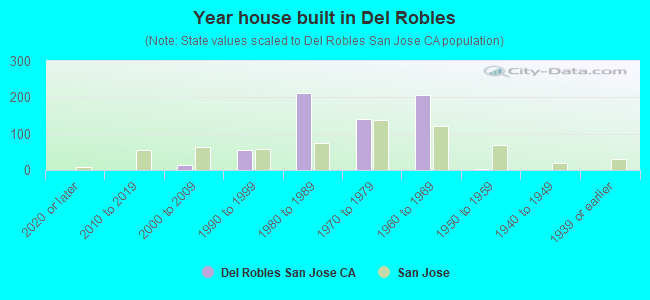
- Year house built in Del Robles
- 02020 or later
- 02010 to 2019
- 152000 to 2009
- 561990 to 1999
- 2131980 to 1989
- 1391970 to 1979
- 2061960 to 1969
- 41950 to 1959
- 01940 to 1949
- 01939 or earlier
City-data.com crime index for city in 2020 (higher means more crime):
| City: | 268.4 |
| U.S. average: | 219.5 |
Travel time to work (commute)
![Travel time to work (commute)]()
- 255 to 9 minutes
- 3710 to 14 minutes
- 8115 to 19 minutes
- 17020 to 24 minutes
- 7025 to 29 minutes
- 14630 to 34 minutes
- 1235 to 39 minutes
- 2040 to 44 minutes
- 16345 to 59 minutes
- 7760 to 89 minutes
- 4290 or more minutes

Means of transportation to work
![Means of transportation to work]()
- 66.3%808Drove a car alone
- 10.0%122Carpooled
- 0.8%10Bus
- 0.1%1Long-distance train or commuter rail
- 1.0%12Light rail, streetcar or trolley
- 2.0%24Motorcycle
- 2.0%24Bicycle
- 3.9%48Walked
- 1.3%16Other means
- 19.8%241Worked at home

Time leaving home to go to work
![Time leaving home to go to work]()
- 4312:00 a.m. to 4:59 a.m.
- 175:00 a.m. to 5:29 a.m.
- 255:30 a.m. to 5:59 a.m.
- 446:00 a.m. to 6:29 a.m.
- 946:30 a.m. to 6:59 a.m.
- 1237:00 a.m. to 7:29 a.m.
- 1227:30 a.m. to 7:59 a.m.
- 678:00 a.m. to 8:29 a.m.
- 508:30 a.m. to 8:59 a.m.
- 679:00 a.m. to 9:59 a.m.
- 1110:00 a.m. to 10:59 a.m.
- 1311:00 a.m. to 11:59 a.m.
- 5212:00 p.m. to 3:59 p.m.
- 614:00 p.m. to 11:59 p.m.

Occupations of males:
- Percentage of males in management occupations (except farmers):
Here: 21.0% city: 13.0%
- Percentage of males in business and financial operations occupations:
Here: 4.3% city: 4.6%
- Percentage of males in computer and mathematical occupations:
Here: 18.9% city: 13.6%
- Percentage of males in architecture and engineering occupations:
Here: 4.0% city: 10.2%
- Percentage of males in life, physical, and social science occupations:
Here: 2.0% city: 1.1%
- Percentage of males in legal occupations:
Here: 1.7% city: 0.8%
- Percentage of males in education, training, and library occupations:
Here: 2.0% city: 2.8%
- Percentage of males in healthcare practitioners and technical occupations:
Here: 3.8% city: 2.0%
- Percentage of males in service occupations:
Here: 9.5% city: 12.7%
- Percentage of males in sales and office occupations:
Here: 11.3% city: 12.8%
- Percentage of males in construction, extraction, and maintenance occupations:
Here: 12.1% city: 7.8%
- Percentage of males in production occupations:
Here: 2.1% city: 5.5%
- Percentage of males in transportation occupations:
Here: 1.9% city: 3.6%
Occupations of females:
- Percentage of females in management occupations (except farmers):
Here: 5.6% city: 11.0%
- Percentage of females in business and financial operations occupations:
Here: 14.2% city: 8.6%
- Percentage of females in computer and mathematical occupations:
Here: 1.5% city: 5.4%
- Percentage of females in education, training, and library occupations:
Here: 4.3% city: 8.1%
- Percentage of females in healthcare practitioners and technical occupations:
Here: 2.5% city: 6.8%
- Percentage of females in service occupations:
Here: 24.8% city: 21.7%
- Percentage of females in sales and office occupations:
Here: 40.5% city: 22.0%
- Percentage of females in production occupations:
Here: 4.9% city: 4.0%
- Percentage of females in transportation occupations:
Here: 1.3% city: 0.7%
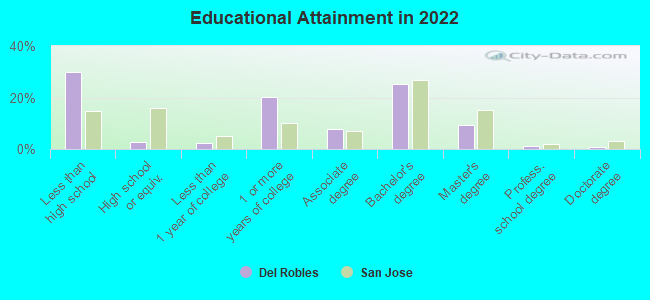
Education in this neighborhood (subdivision or community):
- Percentage of people 3 years and older in K-12 schools:
Del Robles: 25.2% San Jose: 16.1%
- Percentage of people 3 years and older in undergraduate colleges:
Del Robles: 3.9% San Jose: 6.5%
- Percentage of people 3 years and older in grad. or professional schools:
Del Robles: 2.0% San Jose: 2.0%
- Percentage of students K-12 enrolled in private schools:
Del Robles: 18.0% San Jose: 14.9%
Percentage of population below poverty level:
| Del Robles: | 3.5% |
| San Jose: | 9.0% |
Median year owner moved in (as recorded in 2022):
Median year renter moved in (as recorded in 2022):
| Del Robles: | 2009 |
| San Jose: | 2008 |
Median year renter moved in (as recorded in 2022):
| Del Robles: | 2016 |
| San Jose: | 2020 |
Percentage of married-couple families with both working:
| Del Robles: | 76.9% |
| San Jose: | 72.5% |
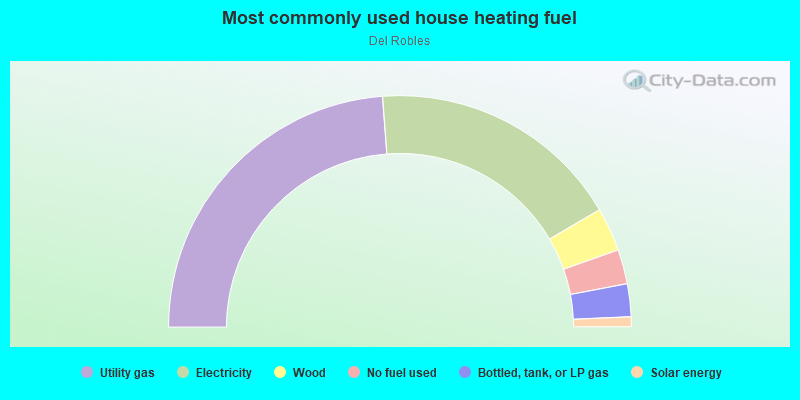
- 47.6%Utility gas
- 35.5%Electricity
- 6.1%Wood
- 4.8%No fuel used
- 4.6%Bottled, tank, or LP gas
- 1.4%Solar energy
Roads and streets:
Ave Arboles
Length: 0.61 miles
Directions: E-W, SW-NE
Address range: 300 to 431
Directions: E-W, SW-NE
Address range: 300 to 431
Ave Almendros
Length: 0.39 miles
Directions: E-W, N-S, SW-NE
Address range: 5316 to 5399
Directions: E-W, N-S, SW-NE
Address range: 5316 to 5399
Ave del Roble
Length: 0.37 miles
Directions: E-W, SE-NW, SW-NE
Address range: 300 to 499
Directions: E-W, SE-NW, SW-NE
Address range: 300 to 499
Snell Ave
Length: 0.34 miles
Directions: N-S, SW-NE
Address range: 5300 to 5599
Directions: N-S, SW-NE
Address range: 5300 to 5599
Ave Palmas
Length: 0.33 miles
Directions: E-W, N-S, SW-NE
Address range: 300 to 499
Directions: E-W, N-S, SW-NE
Address range: 300 to 499
Ave Manzanos
Length: 0.28 miles
Directions: E-W, N-S, SE-NW
Address range: 300 to 499
Directions: E-W, N-S, SE-NW
Address range: 300 to 499
Ave Nogales
Length: 0.27 miles
Direction: E-W
Address range: 300 to 327
Direction: E-W
Address range: 300 to 327
Ave Pinos
Length: 0.27 miles
Directions: E-W, N-S
Address range: 300 to 399
Directions: E-W, N-S
Address range: 300 to 399
Ave Abetos
Length: 0.25 miles
Directions: E-W, N-S, SE-NW, SW-NE
Address range: 300 to 499
Directions: E-W, N-S, SE-NW, SW-NE
Address range: 300 to 499
Chynoweth Ave
Length: 0.23 miles
Direction: E-W
Direction: E-W
Ent Olmos
Length: 0.23 miles
Directions: N-S, SE-NW
Address range: 5200 to 5499
Directions: N-S, SE-NW
Address range: 5200 to 5499
Ent Cedros
Length: 0.14 miles
Directions: N-S, SE-NW
Address range: 5300 to 5499
Directions: N-S, SE-NW
Address range: 5300 to 5499
Giuffrida Ave
Length: 0.13 miles
Direction: E-W
Address range: 400 to 545
Direction: E-W
Address range: 400 to 545
Studebaker Cir
Length: 0.12 miles
Directions: E-W, N-S, SE-NW, SW-NE
Address range: 5300 to 5499
Directions: E-W, N-S, SE-NW, SW-NE
Address range: 5300 to 5499
Vauxhall Cir
Length: 0.12 miles
Directions: E-W, N-S, SE-NW, SW-NE
Address range: 5300 to 5499
Directions: E-W, N-S, SE-NW, SW-NE
Address range: 5300 to 5499
Giuffrida Ct
Length: 0.10 miles
Directions: E-W, N-S, SE-NW, SW-NE
Address range: 5400 to 5499
Directions: E-W, N-S, SE-NW, SW-NE
Address range: 5400 to 5499
Ent Oleandros
Length: 0.07 miles
Direction: N-S
Address range: 5300 to 5399
Direction: N-S
Address range: 5300 to 5399
Daimler Ct
Length: 0.03 miles
Direction: N-S
Address range: 5301 to 5399
Direction: N-S
Address range: 5301 to 5399