Creekside neighborhood in San Jose, California (CA), 95121, 95135 detailed profile
Settings
X

Business Search - 14 Million verified businesses
Area: 0.319 square miles
Population: 1,720
Population density:
| Creekside: | 5,387 people per square mile |
| San Jose: | 5,554 people per square mile |

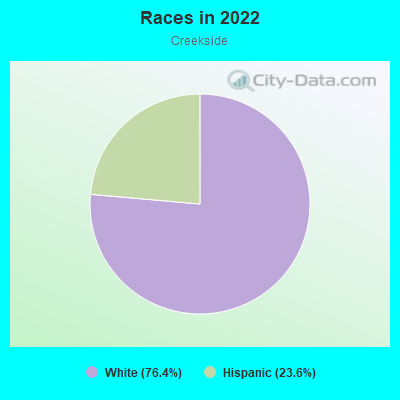
- 60634.2%Hispanic or Latino
- 55431.3%Asian
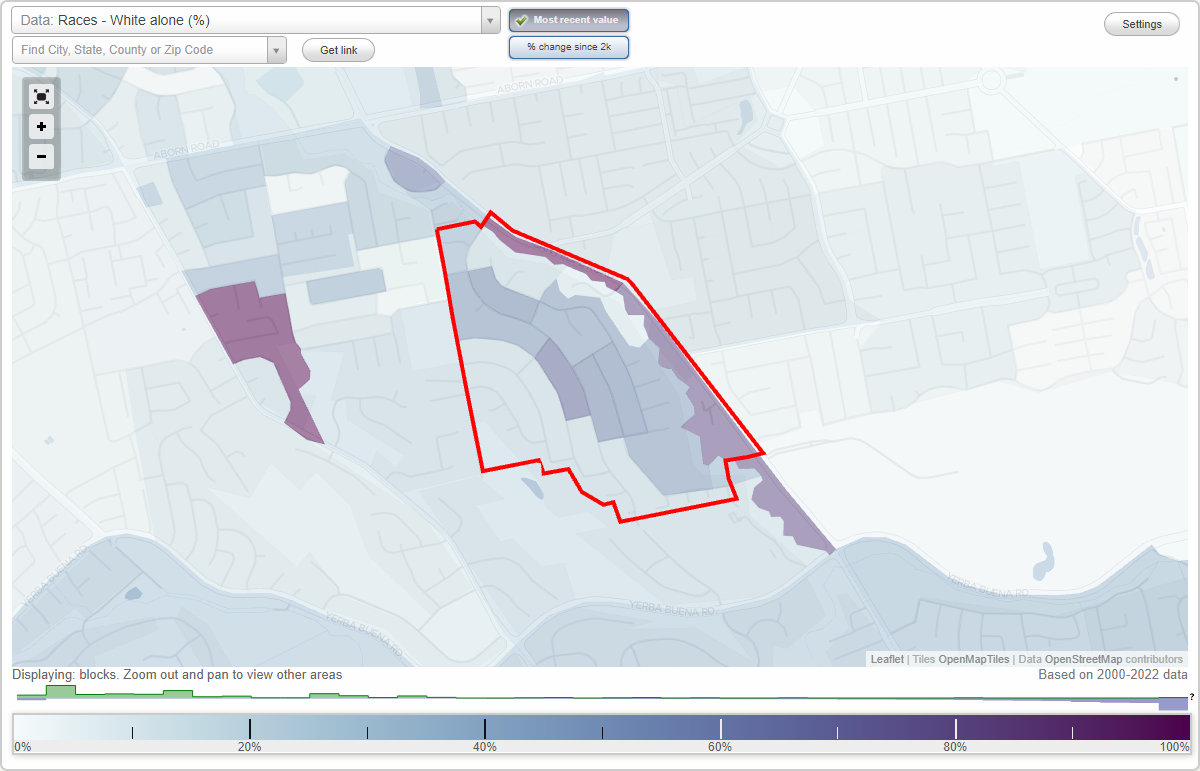
- 36520.6%White
- 643.6%Native Hawaiian and Other
Pacific Islander - 613.4%Black
- 613.4%Two or more races
- 502.8%Some other race
- 100.6%American Indian
Median household income in 2022:
| Creekside: | $148,718 |
| San Jose: | $133,835 |
Distribution of median household income
![Distribution of median household income]()
- 15Less than $10,000
- 57$10,000 to $19,999
- 49$20,000 to $29,999
- 50$30,000 to $39,999
- 59$40,000 to $49,999
- 26$50,000 to $59,999
- 102$60,000 to $74,999
- 55$75,000 to $99,999
- 104$100,000 to $124,999
- 142$125,000 to $149,999
- 61$150,000 to $199,999
- 184$200,000 or more

Distribution of owner-occupied house/condo value
![Distribution of owner-occupied house/condo value]()
- 1$50,000 to $99,999
- 44$500,000 to $749,999
- 23$750,000 to $999,999
- 345$1,000,000 or more

Distribution of rent paid by renters
![Distribution of rent paid by renters]()
- 27$600 to $699
- 11$700 to $799
- 22$1,500 to $1,999
- 238$2,000 or more

Median rent in 2022:
| Creekside: | $3,420 |
| San Jose: | $2,001 |
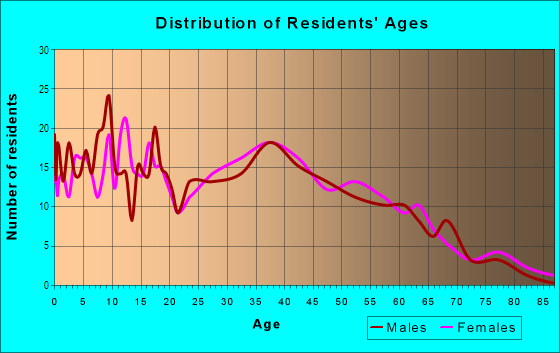
| Males: | 796 |
| Females: | 924 |
Males:
| This neighborhood: | 38.1 years |
| Whole city: | 37.6 years |
| This neighborhood: | 50.1 years |
| Whole city: | 39.1 years |
Average household size:
| Creekside: | 2.9 people |
| San Jose: | 2.9 people |
Percentage of family households:
| Creekside: | 34.0% |
| San Jose: | 49.9% |
| Here: | 49.2% |
| San Jose: | 53.0% |
Percentage of married-couple families with children (among all households):
| Creekside: | 38.5% |
| San Jose: | 25.8% |
Percentage of single-mother households (among all households):
| Creekside: | 2.1% |
| San Jose: | 5.2% |
Percentage of never married males 15 years old and over:
Percentage of never married females 15 years old and over:
| Creekside: | 13.9% |
| San Jose: | 20.9% |
Percentage of never married females 15 years old and over:
| Creekside: | 10.4% |
| city: | 16.7% |
Percentage of people that speak English not well or not at all:
| Creekside: | 5.0% |
| San Jose: | 11.4% |
Percentage of people born in this state:
Percentage of people born in another U.S. state:
Percentage of native residents but born outside the U.S.:
Percentage of foreign born residents:
| Here: | 45.4% |
| San Jose: | 46.1% |
Percentage of people born in another U.S. state:
| Creekside: | 7.0% |
| San Jose: | 10.4% |
Percentage of native residents but born outside the U.S.:
| Here: | 0.7% |
| city: | 1.7% |
Percentage of foreign born residents:
| Here: | 46.9% |
| San Jose: | 41.8% |
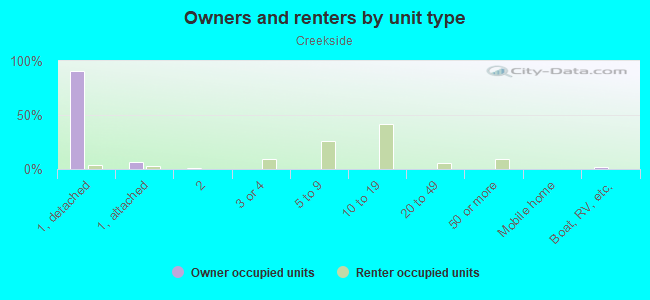
Owner-occupied
Renter-occupied

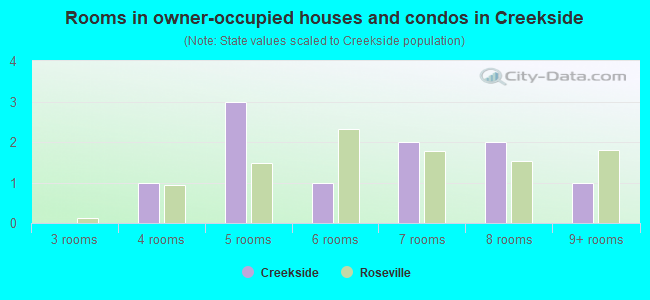
- Rooms in owner-occupied houses and condos in Creekside
- 01 room
- 02 rooms
- 193 rooms
- 504 rooms
- 665 rooms
- 436 rooms
- 667 rooms
- 1298 rooms
- 779+ rooms
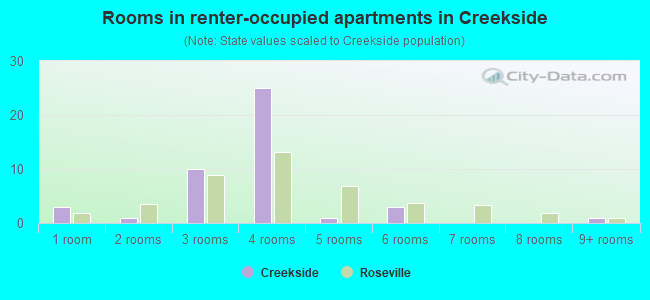
- Rooms in renter-occupied apartments in Creekside
- 1571 room
- 722 rooms
- 03 rooms
- 194 rooms
- 605 rooms
- 396 rooms
- 127 rooms
- 218 rooms
- 09+ rooms
Owner-occupied
Renter-occupied
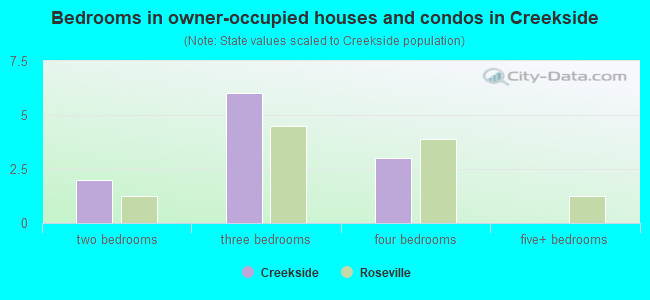
- Bedrooms in owner-occupied houses and condos in Creekside
- 0no bedroom
- 01 bedroom
- 192 bedrooms
- 1003 bedrooms
- 2374 bedrooms
- 485+ bedrooms
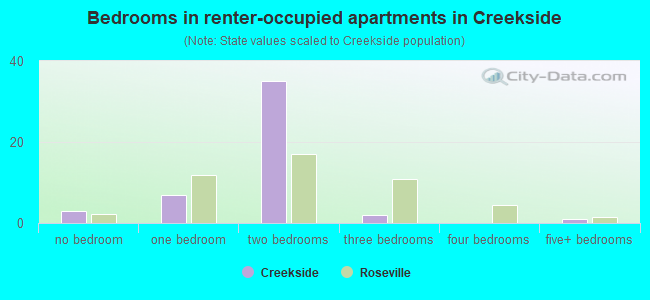
- Bedrooms in renter-occupied apartments in Creekside
- 168no bedroom
- 611 bedroom
- 192 bedrooms
- 523 bedrooms
- 554 bedrooms
- 05+ bedrooms
Average number of cars or other vehicles available in houses/condos:
Average number of cars or other vehicles available in apartments:
| This neighborhood: | 2.4 |
| San Jose: | 2.3 |
Average number of cars or other vehicles available in apartments:
| Here: | 0.7 |
| city: | 1.6 |
Percentage of units with a mortgage:
| Creekside: | 50.7% |
| San Jose: | 66.9% |
Average estimated value of detached houses in 2022 (56.9% of all units):
| Creekside: | $1,239,537 |
| San Jose: | $1,532,815 |
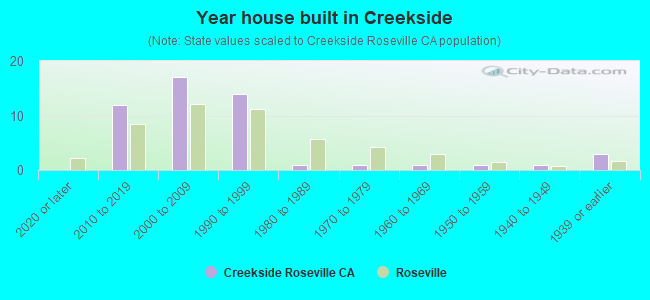
- Year house built in Creekside
- 02020 or later
- 72010 to 2019
- 1482000 to 2009
- 1011990 to 1999
- 1511980 to 1989
- 941970 to 1979
- 2261960 to 1969
- 591950 to 1959
- 01940 to 1949
- 21939 or earlier
City-data.com crime index for city in 2020 (higher means more crime):
| City: | 268.4 |
| U.S. average: | 219.5 |
Travel time to work (commute)
![Travel time to work (commute)]()
- 175 to 9 minutes
- 5210 to 14 minutes
- 9115 to 19 minutes
- 13220 to 24 minutes
- 6825 to 29 minutes
- 15730 to 34 minutes
- 1435 to 39 minutes
- 7140 to 44 minutes
- 5945 to 59 minutes
- 3360 to 89 minutes
- 990 or more minutes

Means of transportation to work
![Means of transportation to work]()
- 59.4%372Drove a car alone
- 18.8%118Carpooled
- 1.9%12Bus
- 4.2%26Taxi
- 4.2%26Walked
- 3.0%19Other means
- 17.1%107Worked at home

Time leaving home to go to work
![Time leaving home to go to work]()
- 3312:00 a.m. to 4:59 a.m.
- 255:00 a.m. to 5:29 a.m.
- 645:30 a.m. to 5:59 a.m.
- 296:00 a.m. to 6:29 a.m.
- 326:30 a.m. to 6:59 a.m.
- 1177:00 a.m. to 7:29 a.m.
- 537:30 a.m. to 7:59 a.m.
- 848:00 a.m. to 8:29 a.m.
- 738:30 a.m. to 8:59 a.m.
- 689:00 a.m. to 9:59 a.m.
- 1310:00 a.m. to 10:59 a.m.
- 111:00 a.m. to 11:59 a.m.
- 6012:00 p.m. to 3:59 p.m.
- 364:00 p.m. to 11:59 p.m.

Occupations of males:
- Percentage of males in management occupations (except farmers):
Here: 40.7% city: 13.0%
- Percentage of males in business and financial operations occupations:
Here: 6.7% city: 4.6%
- Percentage of males in computer and mathematical occupations:
Here: 1.9% city: 13.6%
- Percentage of males in architecture and engineering occupations:
Here: 2.5% city: 10.2%
- Percentage of males in community and social services occupations:
Here: 1.2% city: 0.8%
- Percentage of males in education, training, and library occupations:
Here: 6.8% city: 2.8%
- Percentage of males in service occupations:
Here: 2.0% city: 12.7%
- Percentage of males in sales and office occupations:
Here: 18.1% city: 12.8%
- Percentage of males in production occupations:
Here: 3.9% city: 5.5%
- Percentage of males in transportation occupations:
Here: 1.9% city: 3.6%
- Percentage of males in material moving occupations:
Here: 13.0% city: 3.1%
Occupations of females:
- Percentage of females in management occupations (except farmers):
Here: 11.2% city: 11.0%
- Percentage of females in business and financial operations occupations:
Here: 43.8% city: 8.6%
- Percentage of females in computer and mathematical occupations:
Here: 4.8% city: 5.4%
- Percentage of females in life, physical, and social science occupations:
Here: 1.9% city: 1.7%
- Percentage of females in community and social services occupations:
Here: 4.8% city: 1.8%
- Percentage of females in legal occupations:
Here: 2.3% city: 1.3%
- Percentage of females in education, training, and library occupations:
Here: 6.0% city: 8.1%
- Percentage of females in arts, design, entertainment, sports, and media occupations:
Here: 2.1% city: 2.0%
- Percentage of females in healthcare practitioners and technical occupations:
Here: 12.6% city: 6.8%
- Percentage of females in service occupations:
Here: 2.1% city: 21.7%
- Percentage of females in sales and office occupations:
Here: 22.9% city: 22.0%
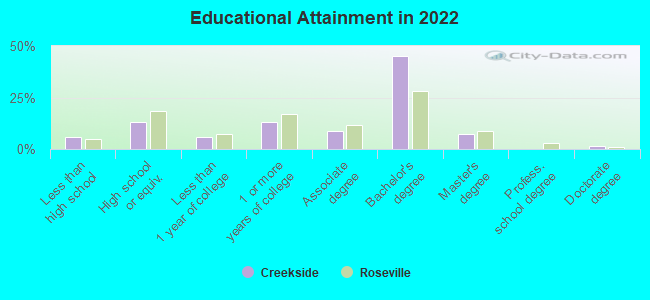
Education in this neighborhood (subdivision or community):
- Percentage of people 3 years and older in K-12 schools:
Creekside: 24.6% San Jose: 16.1%
- Percentage of people 3 years and older in undergraduate colleges:
Creekside: 5.9% San Jose: 6.5%
- Percentage of people 3 years and older in grad. or professional schools:
Creekside: 1.0% San Jose: 2.0%
- Percentage of students K-12 enrolled in private schools:
Creekside: 6.9% San Jose: 14.9%
Percentage of population below poverty level:
| Creekside: | 6.7% |
| San Jose: | 9.0% |
Median year owner moved in (as recorded in 2022):
Median year renter moved in (as recorded in 2022):
| Creekside: | 2010 |
| San Jose: | 2008 |
Median year renter moved in (as recorded in 2022):
| Creekside: | 2015 |
| San Jose: | 2020 |
Percentage of married-couple families with both working:
| Creekside: | 73.9% |
| San Jose: | 72.5% |
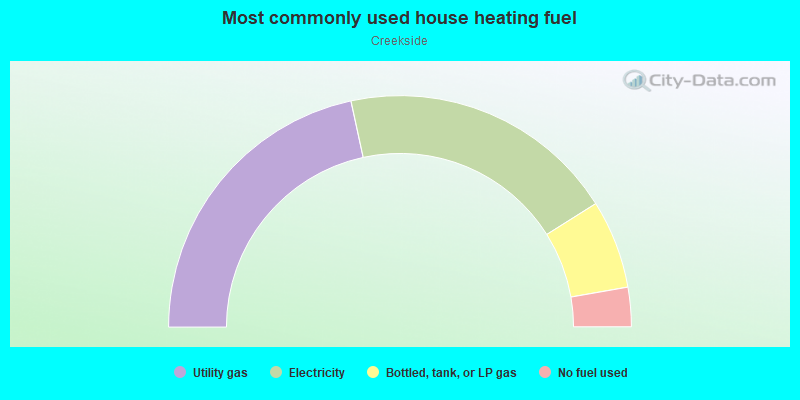
- 62.8%Utility gas
- 31.1%Electricity
- 3.2%Solar energy
- 2.8%Bottled, tank, or LP gas
Roads and streets:
Yerba Buena Ave
Length: 0.86 miles
Directions: E-W, N-S, SE-NW, SW-NE
Address range: 3681 to 4423
Directions: E-W, N-S, SE-NW, SW-NE
Address range: 3681 to 4423
Timberline Dr
Length: 0.67 miles
Directions: E-W, N-S, SE-NW
Address range: 3700 to 4199
Directions: E-W, N-S, SE-NW
Address range: 3700 to 4199
San Felipe Rd
Length: 0.48 miles
Directions: E-W, SE-NW
Address range: 3751 to 3999
Directions: E-W, SE-NW
Address range: 3751 to 3999
Forestwood Dr
Length: 0.40 miles
Directions: E-W, N-S, SE-NW, SW-NE
Address range: 3950 to 4399
Directions: E-W, N-S, SE-NW, SW-NE
Address range: 3950 to 4399
Partridge Dr
Length: 0.37 miles
Directions: N-S, SE-NW
Address range: 4000 to 4499
Directions: N-S, SE-NW
Address range: 4000 to 4499
Loganberry Dr
Length: 0.23 miles
Directions: N-S, SE-NW
Address range: 4000 to 4199
Directions: N-S, SE-NW
Address range: 4000 to 4199
Peartree Ln
Length: 0.21 miles
Direction: E-W
Address range: 2600 to 2799
Direction: E-W
Address range: 2600 to 2799
Deer Isle Dr
Length: 0.18 miles
Direction: E-W
Direction: E-W
Thompson Creek Ct
Length: 0.17 miles
Directions: E-W, SE-NW, SW-NE
Address range: 3801 to 3899
Directions: E-W, SE-NW, SW-NE
Address range: 3801 to 3899
Prunetree Ln
Length: 0.17 miles
Directions: E-W, SE-NW
Address range: 4062 to 4199
Directions: E-W, SE-NW
Address range: 4062 to 4199
Evergreen Way
Length: 0.14 miles
Direction: SW-NE
Address range: 2800 to 2899
Direction: SW-NE
Address range: 2800 to 2899
Green Hill Way
Length: 0.13 miles
Direction: SW-NE
Address range: 2700 to 2799
Direction: SW-NE
Address range: 2700 to 2799
Ivywood Ct
Length: 0.08 miles
Direction: E-W
Address range: 2800 to 2899
Direction: E-W
Address range: 2800 to 2899
Pinecrest Ct
Length: 0.08 miles
Directions: E-W, SW-NE
Address range: 2800 to 2899
Directions: E-W, SW-NE
Address range: 2800 to 2899
Fourthplain Ct
Length: 0.08 miles
Directions: E-W, SE-NW
Address range: 2700 to 2799
Directions: E-W, SE-NW
Address range: 2700 to 2799
Forester Ct
Length: 0.08 miles
Directions: N-S, SE-NW
Address range: 3800 to 3899
Directions: N-S, SE-NW
Address range: 3800 to 3899
Apricot Ln
Length: 0.07 miles
Direction: E-W
Address range: 2500 to 2599
Direction: E-W
Address range: 2500 to 2599
Greenleaf Ln
Length: 0.07 miles
Direction: E-W
Address range: 2801 to 2899
Direction: E-W
Address range: 2801 to 2899
Lone Oak Dr
Length: 0.07 miles
Direction: E-W
Address range: 2400 to 2499
Direction: E-W
Address range: 2400 to 2499
Timberline Ct
Length: 0.07 miles
Directions: E-W, SW-NE
Address range: 2800 to 2899
Directions: E-W, SW-NE
Address range: 2800 to 2899
Burl Way
Length: 0.06 miles
Directions: N-S, SW-NE
Address range: 2700 to 2799
Directions: N-S, SW-NE
Address range: 2700 to 2799
Bergman Ct
Length: 0.06 miles
Direction: E-W
Address range: 2500 to 2599
Direction: E-W
Address range: 2500 to 2599
Partridge Ct
Length: 0.06 miles
Directions: E-W, N-S, SE-NW, SW-NE
Address range: 4400 to 4499
Directions: E-W, N-S, SE-NW, SW-NE
Address range: 4400 to 4499
Escalonia Ct
Length: 0.05 miles
Directions: E-W, SW-NE
Address range: 2400 to 2499
Directions: E-W, SW-NE
Address range: 2400 to 2499
Sugar Pine Ct
Length: 0.04 miles
Direction: E-W
Address range: 2800 to 2899
Direction: E-W
Address range: 2800 to 2899
Burl Ct
Length: 0.04 miles
Directions: E-W, SW-NE
Address range: 2800 to 2899
Directions: E-W, SW-NE
Address range: 2800 to 2899
Prunetree Ct
Length: 0.04 miles
Direction: E-W
Address range: 2400 to 2499
Direction: E-W
Address range: 2400 to 2499
Yerba Buena Ct
Length: 0.03 miles
Direction: SW-NE
Address range: 3700 to 3799
Direction: SW-NE
Address range: 3700 to 3799
Lanes End Pl
Length: 0.03 miles
Direction: N-S
Direction: N-S
Ulman Ct
Length: 0.02 miles
Direction: N-S
Address range: 4449 to 4466
Direction: N-S
Address range: 4449 to 4466
Millplain Ct
Length: 0.02 miles
Direction: N-S
Address range: 3600 to 3699
Direction: N-S
Address range: 3600 to 3699
Azzarello Ct
Length: 0.02 miles
Direction: N-S
Address range: 4400 to 4499
Direction: N-S
Address range: 4400 to 4499
Other features:
Thompson Crk
Length: 1.09 miles
Directions: E-W, N-S, SE-NW, SW-NE
Directions: E-W, N-S, SE-NW, SW-NE