Coyote Point neighborhood in San Mateo, California (CA), 94401 detailed profile
Settings
X

Business Search - 14 Million verified businesses
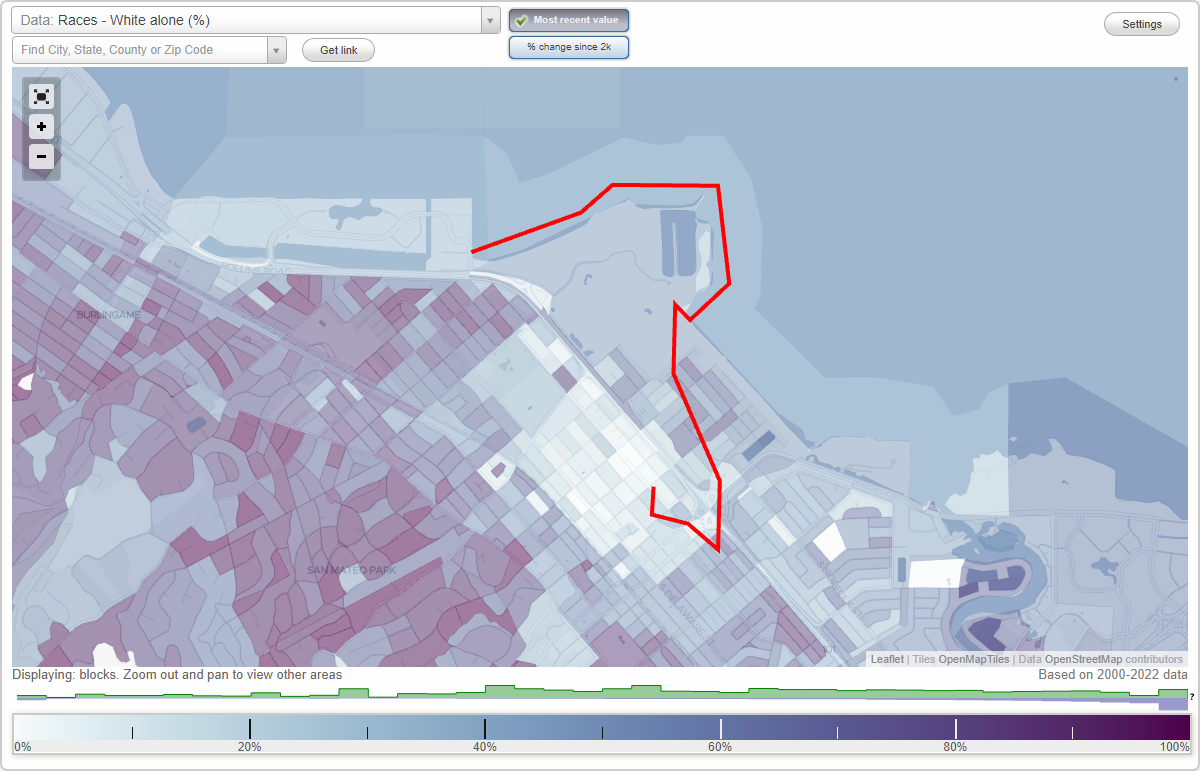
Area: 0.641 square miles
Population: 427
Population density:
| Coyote Point: | 666 people per square mile |
| San Mateo: | 8,266 people per square mile |

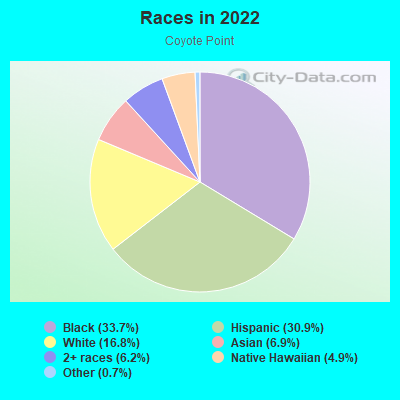
- 22933.7%Black
- 21030.9%Hispanic or Latino
- 11416.8%White
- 476.9%Asian
- 426.2%Two or more races
- 334.9%Native Hawaiian and Other
Pacific Islander - 50.7%Some other race
Distribution of median household income
![Distribution of median household income]()
- 2Less than $10,000
- 4$10,000 to $19,999
- 7$20,000 to $29,999
- 57$30,000 to $39,999
- 23$40,000 to $49,999
- 9$50,000 to $59,999
- 18$60,000 to $74,999
- 11$75,000 to $99,999
- 18$100,000 to $124,999
- 20$125,000 to $149,999
- 18$150,000 to $199,999
- 27$200,000 or more

Distribution of owner-occupied house/condo value
![Distribution of owner-occupied house/condo value]()
- 2Less than $50,000
- 2$100,000 to $149,999
- 6$150,000 to $199,999
- 14$200,000 to $249,999
- 67$250,000 to $299,999
- 82$400,000 to $499,999
- 282$500,000 to $749,999
- 14$750,000 to $999,999
- 36$1,000,000 or more

Distribution of rent paid by renters
![Distribution of rent paid by renters]()
- 27$600 to $699
- 134$1,000 to $1,249
- 43$1,250 to $1,499
- 8$1,500 to $1,999
- 73$2,000 or more

Median rent in 2022:
| Coyote Point: | $2,606 |
| San Mateo: | $2,001 |
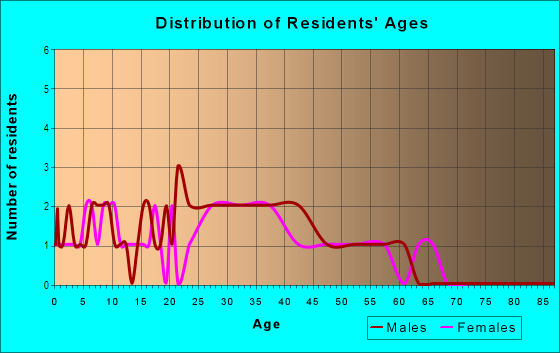
| Males: | 231 |
| Females: | 196 |
Males:
| This neighborhood: | 30.9 years |
| Whole city: | 37.8 years |
| This neighborhood: | 33.1 years |
| Whole city: | 40.5 years |
Average household size:
| Coyote Point: | 2.5 people |
| San Mateo: | 2.6 people |
Percentage of family households:
| Coyote Point: | 51.9% |
| San Mateo: | 41.3% |
| Here: | 53.3% |
| San Mateo: | 48.9% |
Percentage of married-couple families with children (among all households):
| Coyote Point: | 26.1% |
| San Mateo: | 29.2% |
Percentage of single-mother households (among all households):
| Coyote Point: | 3.6% |
| San Mateo: | 5.8% |
Percentage of never married males 15 years old and over:
Percentage of never married females 15 years old and over:
| Coyote Point: | 20.0% |
| San Mateo: | 18.2% |
Percentage of never married females 15 years old and over:
| Coyote Point: | 15.2% |
| city: | 17.0% |
Percentage of people that speak English not well or not at all:
| Coyote Point: | 17.4% |
| San Mateo: | 6.3% |
Percentage of people born in this state:
Percentage of people born in another U.S. state:
Percentage of native residents but born outside the U.S.:
Percentage of foreign born residents:
| Here: | 47.7% |
| San Mateo: | 48.0% |
Percentage of people born in another U.S. state:
| Coyote Point: | 11.4% |
| San Mateo: | 14.4% |
Percentage of native residents but born outside the U.S.:
| Here: | 0.5% |
| city: | 1.1% |
Percentage of foreign born residents:
| Here: | 40.4% |
| San Mateo: | 36.5% |
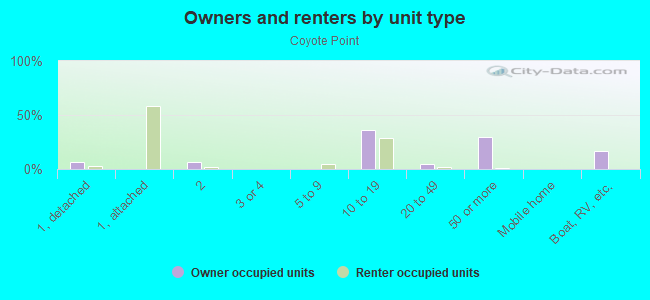
Owner-occupied
Renter-occupied

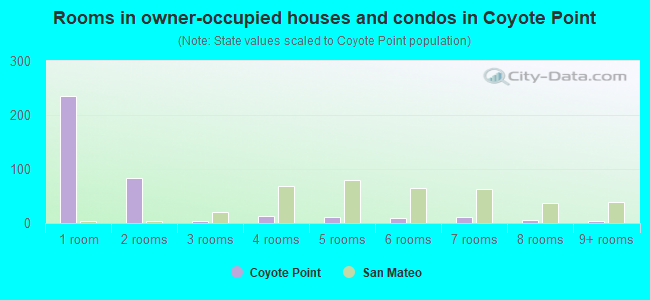
- Rooms in owner-occupied houses and condos in Coyote Point
- 2361 room
- 842 rooms
- 43 rooms
- 134 rooms
- 115 rooms
- 96 rooms
- 117 rooms
- 58 rooms
- 39+ rooms
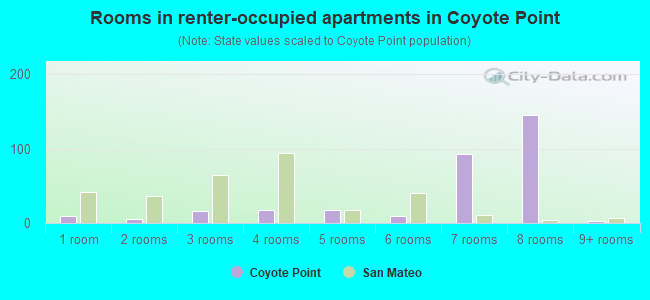
- Rooms in renter-occupied apartments in Coyote Point
- 101 room
- 52 rooms
- 163 rooms
- 174 rooms
- 175 rooms
- 96 rooms
- 937 rooms
- 1458 rooms
- 39+ rooms
Owner-occupied
Renter-occupied
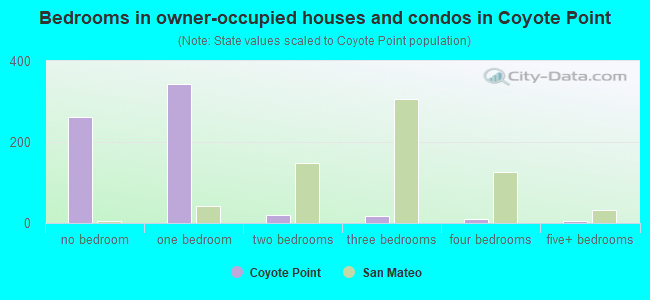
- Bedrooms in owner-occupied houses and condos in Coyote Point
- 262no bedroom
- 3441 bedroom
- 192 bedrooms
- 173 bedrooms
- 94 bedrooms
- 65+ bedrooms
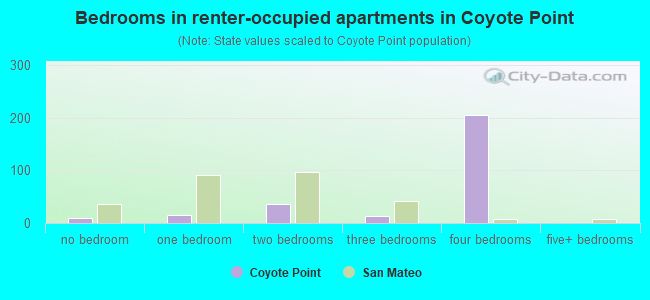
- Bedrooms in renter-occupied apartments in Coyote Point
- 10no bedroom
- 151 bedroom
- 372 bedrooms
- 143 bedrooms
- 2054 bedrooms
- 05+ bedrooms
Average number of cars or other vehicles available in houses/condos:
Average number of cars or other vehicles available in apartments:
| This neighborhood: | 2.0 |
| San Mateo: | 2.0 |
Average number of cars or other vehicles available in apartments:
| Here: | 1.6 |
| city: | 1.4 |
Percentage of units with a mortgage:
| Coyote Point: | 64.1% |
| San Mateo: | 70.1% |
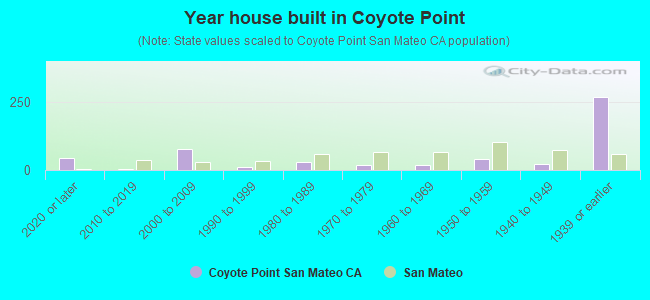
- Year house built in Coyote Point
- 432020 or later
- 42010 to 2019
- 772000 to 2009
- 121990 to 1999
- 311980 to 1989
- 181970 to 1979
- 171960 to 1969
- 391950 to 1959
- 221940 to 1949
- 2691939 or earlier
City-data.com crime index for city in 2020 (higher means more crime):
| City: | 202.6 |
| U.S. average: | 219.5 |
Travel time to work (commute)
![Travel time to work (commute)]()
- 4Less than 5 minutes
- 105 to 9 minutes
- 4510 to 14 minutes
- 6015 to 19 minutes
- 6120 to 24 minutes
- 1925 to 29 minutes
- 4230 to 34 minutes
- 535 to 39 minutes
- 1040 to 44 minutes
- 1045 to 59 minutes
- 1560 to 89 minutes
- 6490 or more minutes

Means of transportation to work
![Means of transportation to work]()
- 65.8%148Drove a car alone
- 11.6%26Carpooled
- 0.9%2Bus
- 0.9%2Subway or elevated rail
- 3.1%7Long-distance train or commuter rail
- 4.0%9Light rail, streetcar or trolley
- 0.9%2Bicycle
- 45.4%102Walked
- 289.1%650Other means
- 8.4%19Worked at home

Time leaving home to go to work
![Time leaving home to go to work]()
- 1012:00 a.m. to 4:59 a.m.
- 25:00 a.m. to 5:29 a.m.
- 85:30 a.m. to 5:59 a.m.
- 156:00 a.m. to 6:29 a.m.
- 216:30 a.m. to 6:59 a.m.
- 447:00 a.m. to 7:29 a.m.
- 487:30 a.m. to 7:59 a.m.
- 578:00 a.m. to 8:29 a.m.
- 198:30 a.m. to 8:59 a.m.
- 419:00 a.m. to 9:59 a.m.
- 710:00 a.m. to 10:59 a.m.
- 311:00 a.m. to 11:59 a.m.
- 612:00 p.m. to 3:59 p.m.
- 184:00 p.m. to 11:59 p.m.

Occupations of males:
- Percentage of males in management occupations (except farmers):
Here: 12.2% city: 17.3%
- Percentage of males in business and financial operations occupations:
Here: 6.7% city: 5.6%
- Percentage of males in computer and mathematical occupations:
Here: 4.7% city: 15.5%
- Percentage of males in architecture and engineering occupations:
Here: 5.5% city: 4.6%
- Percentage of males in life, physical, and social science occupations:
Here: 3.6% city: 2.6%
- Percentage of males in community and social services occupations:
Here: 2.6% city: 1.2%
- Percentage of males in education, training, and library occupations:
Here: 3.2% city: 3.1%
- Percentage of males in arts, design, entertainment, sports, and media occupations:
Here: 1.4% city: 2.2%
- Percentage of males in healthcare practitioners and technical occupations:
Here: 4.5% city: 3.6%
- Percentage of males in service occupations:
Here: 18.1% city: 11.1%
- Percentage of males in sales and office occupations:
Here: 5.9% city: 12.6%
- Percentage of males in farming, fishing, and forestry occupations:
Here: 4.4% city: 1.0%
- Percentage of males in construction, extraction, and maintenance occupations:
Here: 12.3% city: 6.3%
- Percentage of males in production occupations:
Here: 4.9% city: 2.8%
- Percentage of males in transportation occupations:
Here: 2.0% city: 3.4%
- Percentage of males in material moving occupations:
Here: 2.8% city: 2.3%
Occupations of females:
- Percentage of females in management occupations (except farmers):
Here: 12.2% city: 15.9%
- Percentage of females in business and financial operations occupations:
Here: 5.0% city: 11.0%
- Percentage of females in computer and mathematical occupations:
Here: 6.7% city: 6.6%
- Percentage of females in architecture and engineering occupations:
Here: 2.9% city: 1.6%
- Percentage of females in life, physical, and social science occupations:
Here: 5.6% city: 3.9%
- Percentage of females in legal occupations:
Here: 1.5% city: 1.7%
- Percentage of females in education, training, and library occupations:
Here: 3.1% city: 6.9%
- Percentage of females in arts, design, entertainment, sports, and media occupations:
Here: 2.8% city: 3.2%
- Percentage of females in healthcare practitioners and technical occupations:
Here: 2.5% city: 8.3%
- Percentage of females in service occupations:
Here: 35.9% city: 16.0%
- Percentage of females in sales and office occupations:
Here: 19.8% city: 19.6%
- Percentage of females in production occupations:
Here: 2.5% city: 1.6%
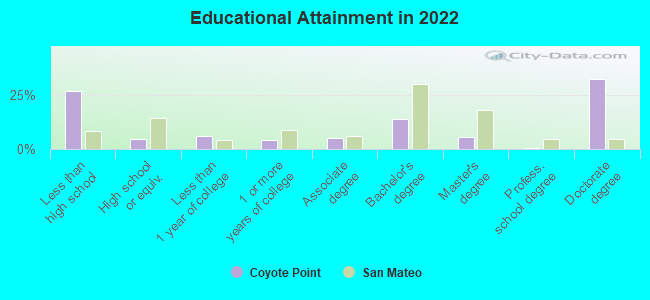
Education in this neighborhood (subdivision or community):
- Percentage of people 3 years and older in K-12 schools:
Coyote Point: 38.7% San Mateo: 15.7%
- Percentage of people 3 years and older in undergraduate colleges:
Coyote Point: 3.4% San Mateo: 4.9%
- Percentage of people 3 years and older in grad. or professional schools:
Coyote Point: 7.4% San Mateo: 1.2%
- Percentage of students K-12 enrolled in private schools:
Coyote Point: 82.8% San Mateo: 18.6%
Percentage of population below poverty level:
| Coyote Point: | 7.8% |
| San Mateo: | 8.3% |
Median year owner moved in (as recorded in 2022):
Median year renter moved in (as recorded in 2022):
| Coyote Point: | 2003 |
| San Mateo: | 2009 |
Median year renter moved in (as recorded in 2022):
| Coyote Point: | 2015 |
| San Mateo: | 2021 |
Percentage of married-couple families with both working:
| Coyote Point: | 62.2% |
| San Mateo: | 66.4% |
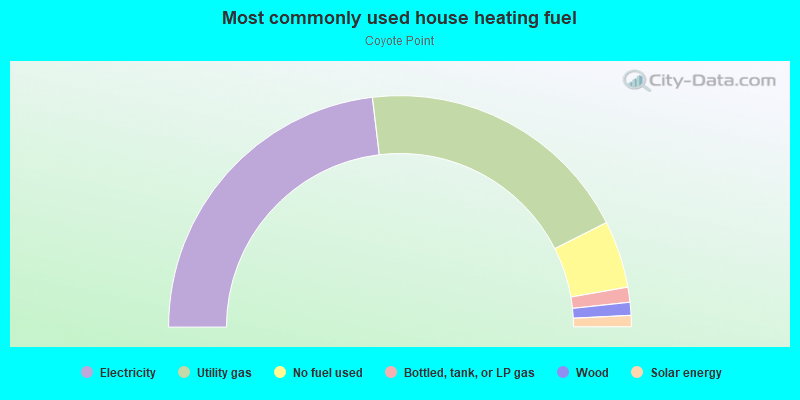
- 46.2%Electricity
- 38.9%Utility gas
- 9.4%No fuel used
- 2.1%Bottled, tank, or LP gas
- 1.8%Wood
- 1.6%Solar energy
Limited-access highways (interstate or state) in this neighborhood:
Bayshore Fwy (US Hwy 101)
Length: 0.62 miles
Directions: E-W, SE-NW
Directions: E-W, SE-NW
Roads and streets:
US Hwy 101
Length: 0.88 miles
Directions: E-W, N-S, SE-NW, SW-NE
Directions: E-W, N-S, SE-NW, SW-NE
E Poplar Ave
Length: 0.56 miles
Direction: SW-NE
Address range: 1200 to 1698
Direction: SW-NE
Address range: 1200 to 1698
Coyote Point Dr
Length: 0.49 miles
Directions: N-S, SW-NE
Address range: 1200 to 1999
Directions: N-S, SW-NE
Address range: 1200 to 1999
N Amphlett Blvd
Length: 0.47 miles
Directions: E-W, SE-NW
Address range: 800 to 1099
Directions: E-W, SE-NW
Address range: 800 to 1099
N Bayshore Blvd
Length: 0.41 miles
Direction: SE-NW
Address range: 500 to 525
Direction: SE-NW
Address range: 500 to 525