Cove at Tiburon neighborhood in Chandler, Arizona (AZ), 85224 detailed profile
Settings
X

Business Search - 14 Million verified businesses
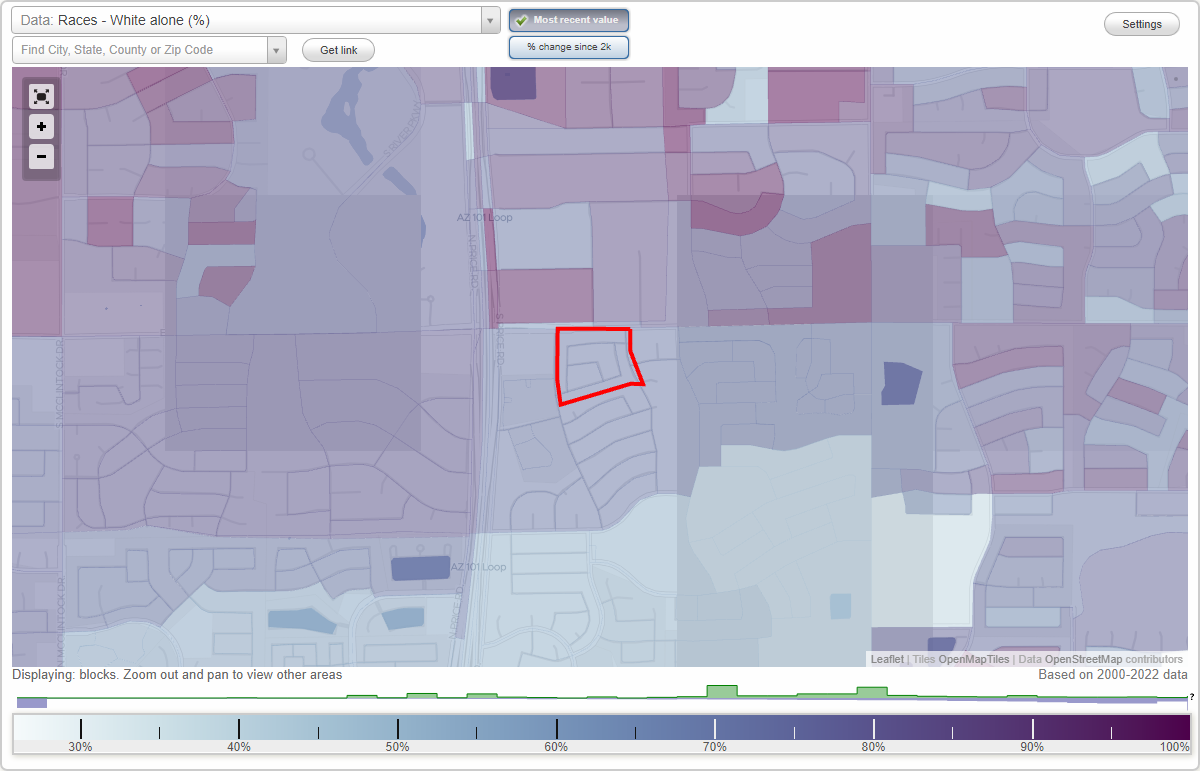
Area: 0.031 square miles
Population: 77
Population density:
| Cove at Tiburon: | 2,521 people per square mile |
| Chandler: | 4,849 people per square mile |

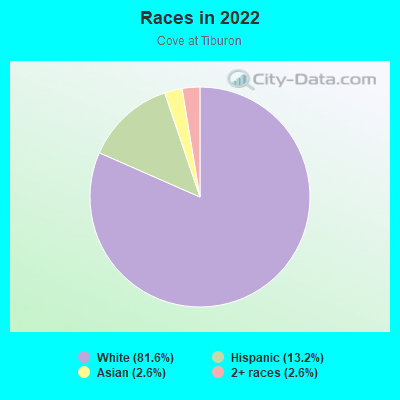
- 6281.6%White
- 1013.2%Hispanic or Latino
- 22.6%Asian
- 22.6%Two or more races
Median household income in 2022:
| Cove at Tiburon: | $86,552 |
| Chandler: | $98,664 |
Distribution of median household income
![Distribution of median household income]()
- 2$30,000 to $39,999
- 3$40,000 to $49,999
- 2$50,000 to $59,999
- 3$60,000 to $74,999
- 9$75,000 to $99,999
- 6$100,000 to $124,999
- 1$125,000 to $149,999
- 2$150,000 to $199,999
- 2$200,000 or more

Distribution of owner-occupied house/condo value
![Distribution of owner-occupied house/condo value]()
- 4$200,000 to $249,999
- 4$250,000 to $299,999
- 10$300,000 to $399,999
- 3$400,000 to $499,999
- 1$750,000 to $999,999
- 3$1,000,000 or more

Distribution of rent paid by renters
![Distribution of rent paid by renters]()
- 1$1,000 to $1,249
- 1$1,250 to $1,499
- 1$1,500 to $1,999

Median rent in 2022:
| Cove at Tiburon: | $1,321 |
| Chandler: | $1,692 |
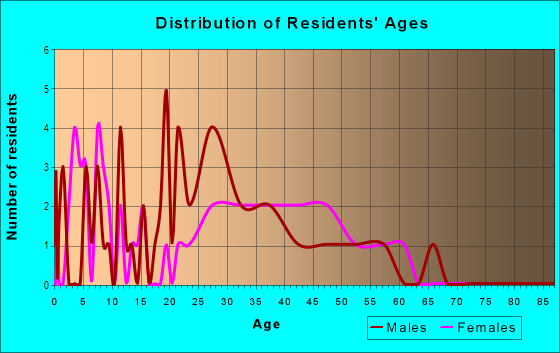
| Males: | 34 |
| Females: | 43 |
Males:
| This neighborhood: | 37.9 years |
| Whole city: | 35.8 years |
| This neighborhood: | 37.3 years |
| Whole city: | 38.3 years |
Average household size:
| Cove at Tiburon: | 34.0 people |
| Chandler: | 2.6 people |
Percentage of family households:
| Cove at Tiburon: | 54.3% |
| Chandler: | 53.2% |
| Here: | 69.2% |
| Chandler: | 50.7% |
Percentage of married-couple families with children (among all households):
| Cove at Tiburon: | 29.8% |
| Chandler: | 26.2% |
Percentage of single-mother households (among all households):
| Cove at Tiburon: | 2.7% |
| Chandler: | 7.3% |
Percentage of never married males 15 years old and over:
Percentage of never married females 15 years old and over:
| Cove at Tiburon: | 15.6% |
| Chandler: | 20.3% |
Percentage of never married females 15 years old and over:
| Cove at Tiburon: | 15.9% |
| city: | 14.9% |
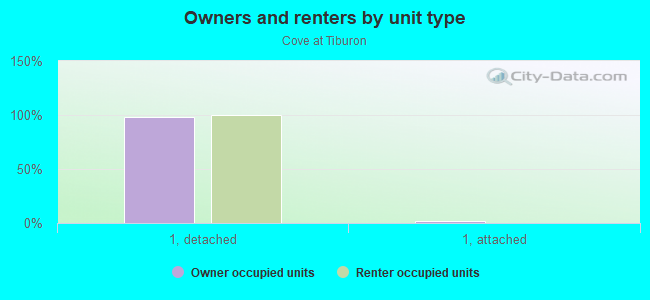
Owner-occupied
Renter-occupied

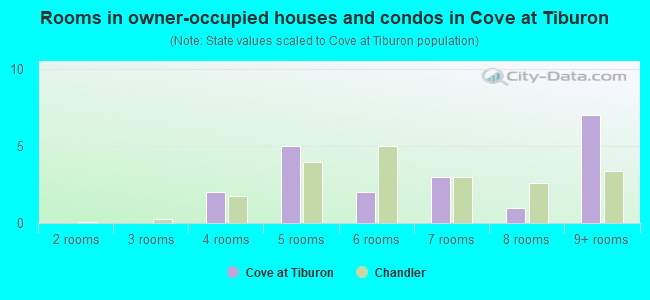
- Rooms in owner-occupied houses and condos in Cove at Tiburon
- 01 room
- 02 rooms
- 03 rooms
- 24 rooms
- 55 rooms
- 26 rooms
- 37 rooms
- 18 rooms
- 79+ rooms
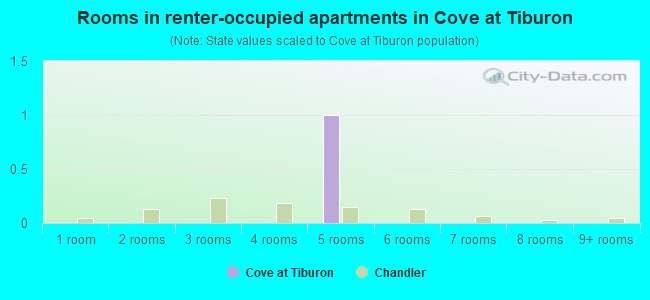
- Rooms in renter-occupied apartments in Cove at Tiburon
- 01 room
- 02 rooms
- 03 rooms
- 04 rooms
- 15 rooms
- 06 rooms
- 07 rooms
- 08 rooms
- 09+ rooms
Owner-occupied
Renter-occupied
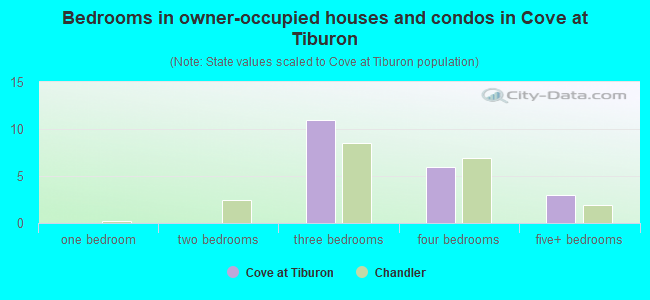
- Bedrooms in owner-occupied houses and condos in Cove at Tiburon
- 0no bedroom
- 01 bedroom
- 02 bedrooms
- 113 bedrooms
- 64 bedrooms
- 35+ bedrooms
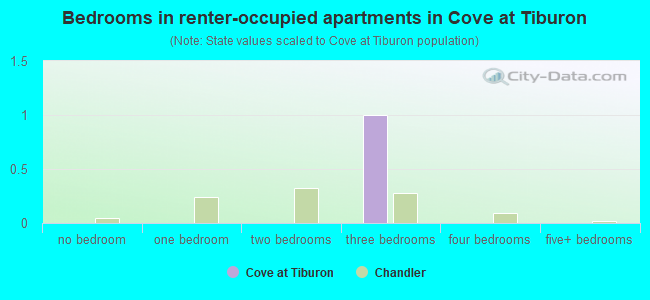
- Bedrooms in renter-occupied apartments in Cove at Tiburon
- 0no bedroom
- 01 bedroom
- 02 bedrooms
- 13 bedrooms
- 04 bedrooms
- 05+ bedrooms
Average number of cars or other vehicles available in houses/condos:
Average number of cars or other vehicles available in apartments:
| This neighborhood: | 2.7 |
| Chandler: | 2.1 |
Average number of cars or other vehicles available in apartments:
| Here: | 2.1 |
| city: | 1.5 |
Percentage of units with a mortgage:
| Cove at Tiburon: | 70.3% |
| Chandler: | 73.1% |
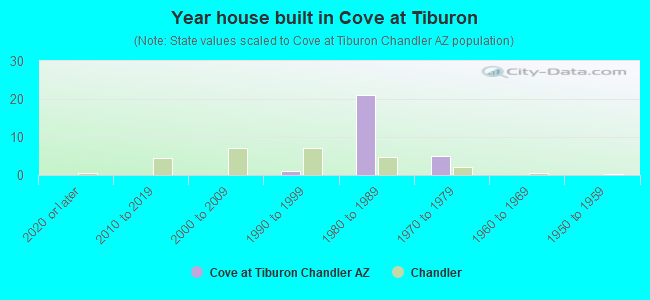
- Year house built in Cove at Tiburon
- 02020 or later
- 02010 to 2019
- 02000 to 2009
- 11990 to 1999
- 211980 to 1989
- 51970 to 1979
- 01960 to 1969
- 01950 to 1959
- 01940 to 1949
- 01939 or earlier
City-data.com crime index for city in 2020 (higher means more crime):
| City: | 165.7 |
| U.S. average: | 219.5 |
Means of transportation to work
![Means of transportation to work]()
- 87.5%30Drove a car alone
- 8.8%3Worked at home

Occupations of males:
- Percentage of males in management occupations (except farmers):
Here: 15.8% city: 13.0%
- Percentage of males in business and financial operations occupations:
Here: 4.3% city: 7.1%
- Percentage of males in computer and mathematical occupations:
Here: 11.9% city: 8.4%
- Percentage of males in healthcare practitioners and technical occupations:
Here: 3.6% city: 3.0%
- Percentage of males in service occupations:
Here: 6.5% city: 11.0%
- Percentage of males in sales and office occupations:
Here: 48.2% city: 17.8%
- Percentage of males in production occupations:
Here: 2.5% city: 4.4%
- Percentage of males in transportation occupations:
Here: 5.0% city: 3.6%
Occupations of females:
- Percentage of females in management occupations (except farmers):
Here: 3.5% city: 11.0%
- Percentage of females in business and financial operations occupations:
Here: 4.2% city: 9.3%
- Percentage of females in computer and mathematical occupations:
Here: 14.5% city: 3.8%
- Percentage of females in legal occupations:
Here: 2.5% city: 1.3%
- Percentage of females in education, training, and library occupations:
Here: 3.5% city: 8.7%
- Percentage of females in arts, design, entertainment, sports, and media occupations:
Here: 4.6% city: 2.1%
- Percentage of females in healthcare practitioners and technical occupations:
Here: 9.2% city: 9.8%
- Percentage of females in service occupations:
Here: 26.5% city: 15.2%
- Percentage of females in sales and office occupations:
Here: 31.4% city: 28.7%
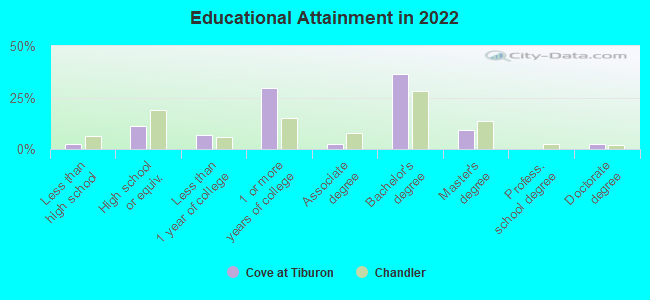
Education in this neighborhood (subdivision or community):
- Percentage of people 3 years and older in K-12 schools:
Cove at Tiburon: 14.5% Chandler: 19.1%
- Percentage of people 3 years and older in undergraduate colleges:
Cove at Tiburon: 3.9% Chandler: 4.5%
- Percentage of people 3 years and older in grad. or professional schools:
Cove at Tiburon: 0.0% Chandler: 1.8%
- Percentage of students K-12 enrolled in private schools:
Cove at Tiburon: 27.3% Chandler: 14.2%
Median year owner moved in (as recorded in 2022):
Median year renter moved in (as recorded in 2022):
| Cove at Tiburon: | 1998 |
| Chandler: | 2013 |
Median year renter moved in (as recorded in 2022):
| Cove at Tiburon: | 2013 |
| Chandler: | 2020 |
Percentage of married-couple families with both working:
| Cove at Tiburon: | 13.8% |
| Chandler: | 68.1% |
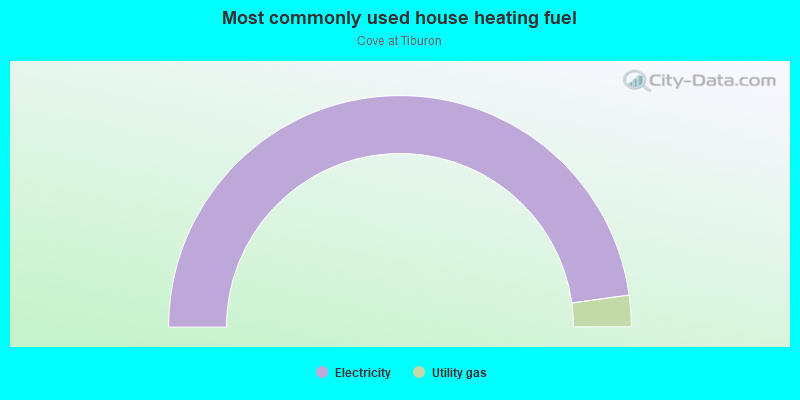
- 95.6%Electricity
- 4.4%Utility gas
Roads and streets:
W Brooks St
Length: 0.19 miles
Directions: E-W, SW-NE
Address range: 2526 to 2799
Directions: E-W, SW-NE
Address range: 2526 to 2799
W Estrella Dr
Length: 0.15 miles
Direction: E-W
Address range: 2600 to 2739
Direction: E-W
Address range: 2600 to 2739
W Temple St
Length: 0.14 miles
Directions: E-W, N-S, SE-NW
Address range: 2700 to 2799
Directions: E-W, N-S, SE-NW
Address range: 2700 to 2799
N Blackstone Dr
Length: 0.11 miles
Directions: N-S, SW-NE
Address range: 1900 to 1999
Directions: N-S, SW-NE
Address range: 1900 to 1999
N Ellis St
Length: 0.11 miles
Directions: N-S, SE-NW
Address range: 1900 to 1989
Directions: N-S, SE-NW
Address range: 1900 to 1989
N Lexington Dr
Length: 0.09 miles
Directions: E-W, N-S, SE-NW, SW-NE
Address range: 1949 to 1965
Directions: E-W, N-S, SE-NW, SW-NE
Address range: 1949 to 1965