Convention Center neighborhood in Arlington, Texas (TX), 76011 detailed profile
Settings
X

Business Search - 14 Million verified businesses
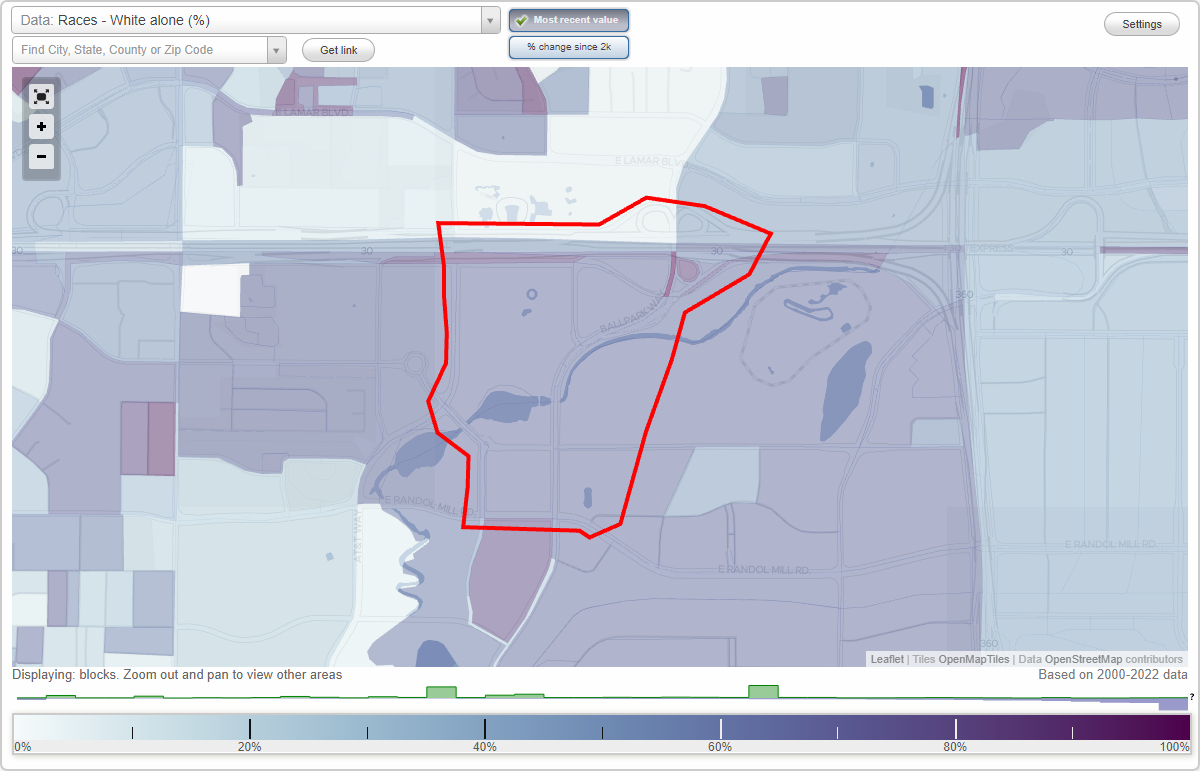
Area: 0.450 square miles
Population: 1,060
Population density:
| Convention Center: | 2,356 people per square mile |
| Arlington: | 4,118 people per square mile |

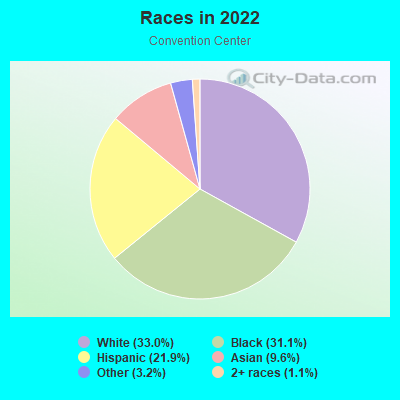
- 35733.0%White
- 33731.1%Black
- 23721.9%Hispanic or Latino
- 1049.6%Asian
- 353.2%Some other race
- 121.1%Two or more races
- 10.09%American Indian
Distribution of median household income
![Distribution of median household income]()
- 11Less than $10,000
- 45$10,000 to $19,999
- 36$20,000 to $29,999
- 91$30,000 to $39,999
- 40$40,000 to $49,999
- 83$50,000 to $59,999
- 82$60,000 to $74,999
- 81$75,000 to $99,999
- 53$100,000 to $124,999
- 44$125,000 to $149,999
- 66$150,000 to $199,999
- 23$200,000 or more

Distribution of owner-occupied house/condo value
![Distribution of owner-occupied house/condo value]()
- 24Less than $50,000
- 78$50,000 to $99,999
- 29$100,000 to $149,999
- 88$150,000 to $199,999
- 31$200,000 to $249,999
- 56$250,000 to $299,999
- 74$300,000 to $399,999
- 12$400,000 to $499,999
- 7$500,000 to $749,999

Distribution of rent paid by renters
![Distribution of rent paid by renters]()
- 18$100 to $199
- 51$200 to $299
- 16$400 to $499
- 19$700 to $799
- 46$800 to $899
- 34$900 to $999
- 164$1,000 to $1,249
- 132$1,250 to $1,499
- 58$1,500 to $1,999
- 2$2,000 or more

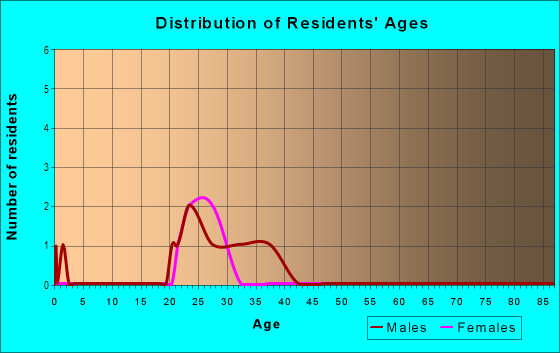
| Males: | 544 |
| Females: | 516 |
Males:
| This neighborhood: | |
| Whole city: |
| This neighborhood: | |
| Whole city: |
Percentage of family households:
| Convention Center: | 32.8% |
| Arlington: | 49.5% |
| Here: | 26.2% |
| Arlington: | 43.9% |
Percentage of married-couple families with children (among all households):
| Convention Center: | 19.2% |
| Arlington: | 23.1% |
Percentage of single-mother households (among all households):
| Convention Center: | 16.2% |
| Arlington: | 8.5% |
Percentage of never married males 15 years old and over:
Percentage of never married females 15 years old and over:
| Convention Center: | 22.8% |
| Arlington: | 20.6% |
Percentage of never married females 15 years old and over:
| Convention Center: | 16.0% |
| city: | 19.7% |
Percentage of people that speak English not well or not at all:
| Convention Center: | 2.9% |
| Arlington: | 6.6% |
Percentage of people born in this state:
Percentage of people born in another U.S. state:
Percentage of native residents but born outside the U.S.:
Percentage of foreign born residents:
| Here: | 46.8% |
| Arlington: | 50.9% |
Percentage of people born in another U.S. state:
| Convention Center: | 38.4% |
| Arlington: | 25.9% |
Percentage of native residents but born outside the U.S.:
| Here: | 0.6% |
| city: | 1.9% |
Percentage of foreign born residents:
| Here: | 14.2% |
| Arlington: | 21.3% |
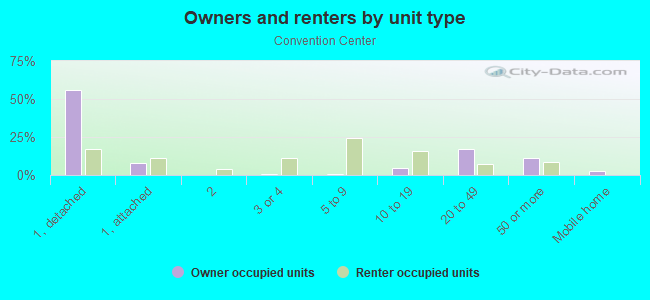
Owner-occupied
Renter-occupied

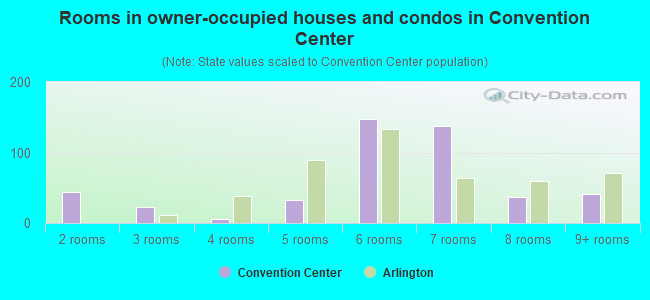
- Rooms in owner-occupied houses and condos in Convention Center
- 01 room
- 442 rooms
- 223 rooms
- 54 rooms
- 335 rooms
- 1476 rooms
- 1387 rooms
- 378 rooms
- 419+ rooms
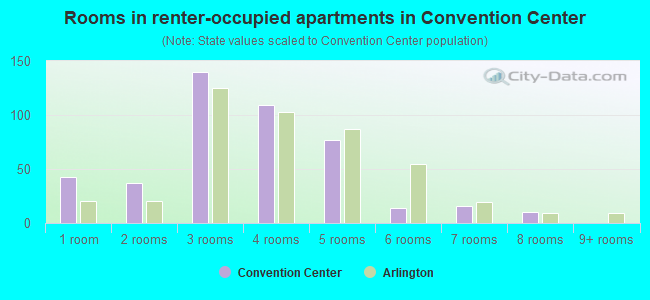
- Rooms in renter-occupied apartments in Convention Center
- 431 room
- 372 rooms
- 1403 rooms
- 1094 rooms
- 775 rooms
- 146 rooms
- 167 rooms
- 108 rooms
- 09+ rooms
Owner-occupied
Renter-occupied
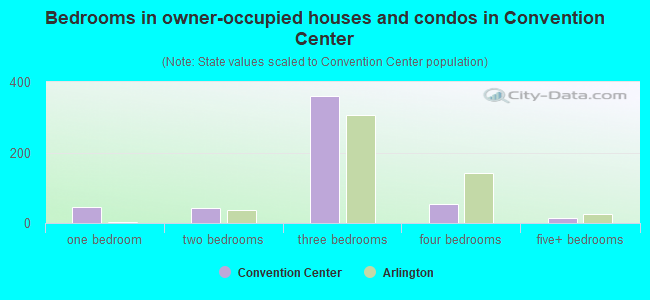
- Bedrooms in owner-occupied houses and condos in Convention Center
- 0no bedroom
- 441 bedroom
- 422 bedrooms
- 3613 bedrooms
- 554 bedrooms
- 155+ bedrooms
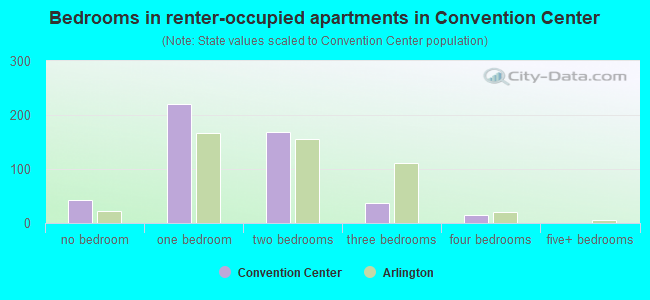
- Bedrooms in renter-occupied apartments in Convention Center
- 43no bedroom
- 2201 bedroom
- 1682 bedrooms
- 373 bedrooms
- 144 bedrooms
- 05+ bedrooms
Average number of cars or other vehicles available in houses/condos:
Average number of cars or other vehicles available in apartments:
| This neighborhood: | |
| Arlington: |
Average number of cars or other vehicles available in apartments:
| Here: | |
| city: |
Percentage of units with a mortgage:
| Convention Center: | 38.7% |
| Arlington: | 60.9% |
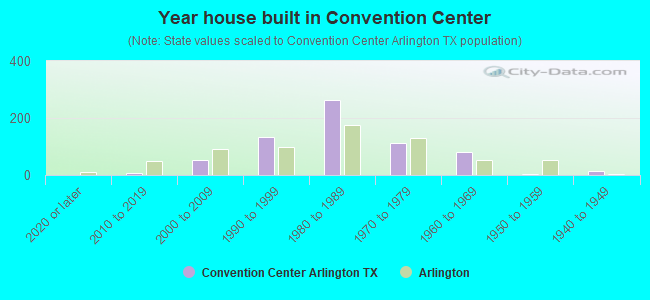
- Year house built in Convention Center
- 02020 or later
- 82010 to 2019
- 512000 to 2009
- 1331990 to 1999
- 2631980 to 1989
- 1111970 to 1979
- 821960 to 1969
- 21950 to 1959
- 141940 to 1949
- 11939 or earlier
City-data.com crime index for city in 2020 (higher means more crime):
| City: | 285.6 |
| U.S. average: | 219.5 |
Travel time to work (commute)
![Travel time to work (commute)]()
- 21Less than 5 minutes
- 335 to 9 minutes
- 4110 to 14 minutes
- 4315 to 19 minutes
- 2320 to 24 minutes
- 2225 to 29 minutes
- 4130 to 34 minutes
- 435 to 39 minutes
- 740 to 44 minutes
- 5045 to 59 minutes
- 260 to 89 minutes
- 390 or more minutes

Means of transportation to work
![Means of transportation to work]()
- 83.1%554Drove a car alone
- 3.8%25Carpooled
- 0.6%4Walked
- 1.7%11Other means
- 12.3%82Worked at home

Time leaving home to go to work
![Time leaving home to go to work]()
- 912:00 a.m. to 4:59 a.m.
- 125:00 a.m. to 5:29 a.m.
- 115:30 a.m. to 5:59 a.m.
- 146:00 a.m. to 6:29 a.m.
- 226:30 a.m. to 6:59 a.m.
- 357:00 a.m. to 7:29 a.m.
- 197:30 a.m. to 7:59 a.m.
- 458:00 a.m. to 8:29 a.m.
- 198:30 a.m. to 8:59 a.m.
- 269:00 a.m. to 9:59 a.m.
- 1410:00 a.m. to 10:59 a.m.
- 6211:00 a.m. to 11:59 a.m.
- 3512:00 p.m. to 3:59 p.m.
- 104:00 p.m. to 11:59 p.m.

Occupations of males:
- Percentage of males in management occupations (except farmers):
Here: 8.0% city: 8.8%
- Percentage of males in business and financial operations occupations:
Here: 16.4% city: 4.5%
- Percentage of males in computer and mathematical occupations:
Here: 5.8% city: 4.4%
- Percentage of males in education, training, and library occupations:
Here: 1.9% city: 3.7%
- Percentage of males in arts, design, entertainment, sports, and media occupations:
Here: 6.9% city: 1.7%
- Percentage of males in healthcare practitioners and technical occupations:
Here: 1.4% city: 2.2%
- Percentage of males in service occupations:
Here: 7.0% city: 12.9%
- Percentage of males in sales and office occupations:
Here: 21.5% city: 17.0%
- Percentage of males in construction, extraction, and maintenance occupations:
Here: 2.0% city: 10.8%
- Percentage of males in production occupations:
Here: 4.1% city: 8.0%
- Percentage of males in transportation occupations:
Here: 13.4% city: 7.6%
- Percentage of males in material moving occupations:
Here: 7.4% city: 7.5%
Occupations of females:
- Percentage of females in management occupations (except farmers):
Here: 15.6% city: 9.3%
- Percentage of females in business and financial operations occupations:
Here: 7.4% city: 6.1%
- Percentage of females in architecture and engineering occupations:
Here: 6.1% city: 0.6%
- Percentage of females in life, physical, and social science occupations:
Here: 3.7% city: 0.7%
- Percentage of females in community and social services occupations:
Here: 4.3% city: 2.5%
- Percentage of females in education, training, and library occupations:
Here: 3.6% city: 9.2%
- Percentage of females in healthcare practitioners and technical occupations:
Here: 10.8% city: 7.2%
- Percentage of females in service occupations:
Here: 12.0% city: 19.8%
- Percentage of females in sales and office occupations:
Here: 36.5% city: 30.1%
- Percentage of females in transportation occupations:
Here: 7.3% city: 2.1%
- Percentage of females in material moving occupations:
Here: 25.5% city: 3.3%
Percentage of people 16-64 in Armed Forces:
| Convention Center: | 0.0% |
| Arlington: | 0.4% |
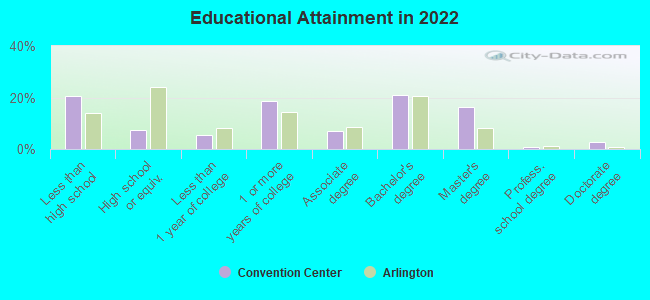
Education in this neighborhood (subdivision or community):
- Percentage of people 3 years and older in K-12 schools:
Convention Center: 19.9% Arlington: 19.2%
- Percentage of people 3 years and older in undergraduate colleges:
Convention Center: 4.3% Arlington: 8.1%
- Percentage of people 3 years and older in grad. or professional schools:
Convention Center: 4.5% Arlington: 1.4%
- Percentage of students K-12 enrolled in private schools:
Convention Center: 4.3% Arlington: 7.1%
Percentage of population below poverty level:
| Convention Center: | 12.0% |
| Arlington: | 11.7% |
Percentage of married-couple families with both working:
| Convention Center: | 261.8% |
| Arlington: | 62.4% |
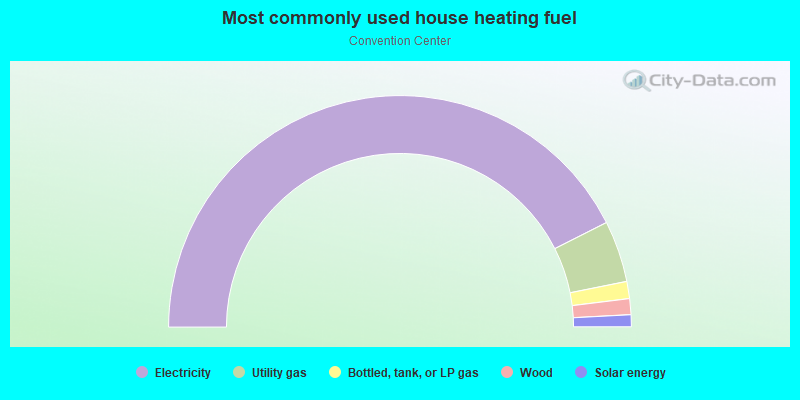
- 85.1%Electricity
- 8.6%Utility gas
- 2.4%Bottled, tank, or LP gas
- 2.2%Wood
- 1.7%Solar energy
Limited-access highways (interstate or state) in this neighborhood:
I- 30
Length: 1.34 miles
Direction: E-W
Direction: E-W
Roads and streets:
Ballpark Way
Length: 1.86 miles
Directions: E-W, N-S, SW-NE
Address range: 1000 to 1599
Directions: E-W, N-S, SW-NE
Address range: 1000 to 1599
Nolan Ryan Expy
Length: 0.49 miles
Directions: N-S, SE-NW
Address range: 1000 to 1198
Directions: N-S, SE-NW
Address range: 1000 to 1198
Brinker Ct
Length: 0.33 miles
Directions: E-W, SE-NW, SW-NE
Address range: 2000 to 2099
Directions: E-W, SE-NW, SW-NE
Address range: 2000 to 2099
E Copeland Rd
Length: 0.33 miles
Directions: E-W, SE-NW
Address range: 1900 to 2099
Directions: E-W, SE-NW
Address range: 1900 to 2099
E Randol Mill Rd
Length: 0.33 miles
Directions: E-W, SE-NW
Address range: 1700 to 1963
Directions: E-W, SE-NW
Address range: 1700 to 1963
Convention Center Dr
Length: 0.26 miles
Directions: E-W, N-S, SE-NW, SW-NE
Address range: 1400 to 1599
Directions: E-W, N-S, SE-NW, SW-NE
Address range: 1400 to 1599
Rd To Six Flags E
Length: 0.20 miles
Direction: E-W
Address range: 1900 to 1909
Direction: E-W
Address range: 1900 to 1909
Wet N Wild Way
Length: 0.03 miles
Direction: E-W
Address range: 1964 to 1999
Direction: E-W
Address range: 1964 to 1999
Other features:
Johnson Crk
Length: 0.12 miles
Directions: E-W, SW-NE
Directions: E-W, SW-NE