Community Center neighborhood in Palo Alto, California (CA), 94301, 94303 detailed profile
Settings
X


Business Search - 14 Million verified businesses
Area: 0.319 square miles
Population: 2,313
Population density:
| Community Center: | 7,260 people per square mile |
| Palo Alto: | 2,789 people per square mile |

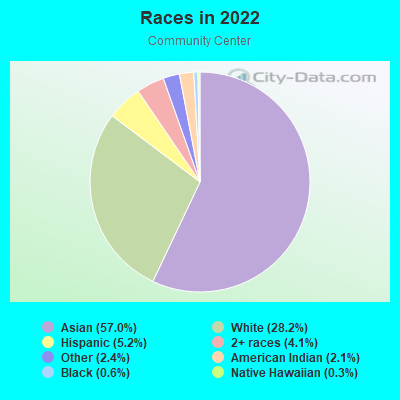
- 1,15448.3%Asian
- 96040.2%White
- 1124.7%Two or more races
- 873.6%Hispanic or Latino
- 472.0%Some other race
- 231.0%Black
- 50.2%Native Hawaiian and Other
Pacific Islander
Median household income in 2022:
| Community Center: | $239,710 |
| Palo Alto: | $179,707 |
Distribution of median household income
![Distribution of median household income]()
- 14Less than $10,000
- 9$10,000 to $19,999
- 250$20,000 to $29,999
- 30$30,000 to $39,999
- 41$40,000 to $49,999
- 14$50,000 to $59,999
- 19$60,000 to $74,999
- 14$75,000 to $99,999
- 25$100,000 to $124,999
- 65$125,000 to $149,999
- 55$150,000 to $199,999
- 462$200,000 or more

Distribution of owner-occupied house/condo value
![Distribution of owner-occupied house/condo value]()
- 27Less than $50,000
- 20$100,000 to $149,999
- 8$300,000 to $399,999
- 17$400,000 to $499,999
- 5$500,000 to $749,999
- 4$750,000 to $999,999
- 614$1,000,000 or more

Distribution of rent paid by renters
![Distribution of rent paid by renters]()
- 11$1,000 to $1,249
- 8$1,500 to $1,999
- 306$2,000 or more

Median rent in 2022:
| Community Center: | $3,499 |
| Palo Alto: | $2,001 |
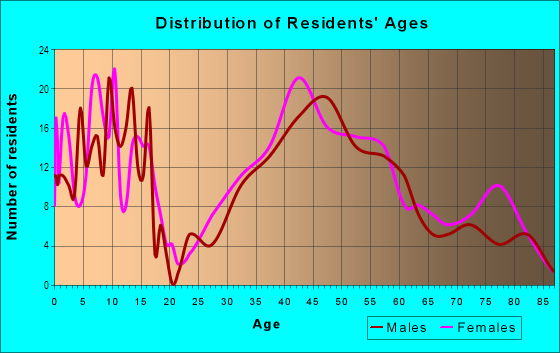
| Males: | 1,186 |
| Females: | 1,127 |
Males:
| This neighborhood: | 45.3 years |
| Whole city: | 47.1 years |
| This neighborhood: | 53.0 years |
| Whole city: | 48.1 years |
Average household size:
| Community Center: | 2.8 people |
| Palo Alto: | 2.3 people |
Percentage of family households:
| Community Center: | 52.6% |
| Palo Alto: | 42.2% |
| Here: | 50.7% |
| Palo Alto: | 52.1% |
Percentage of married-couple families with children (among all households):
| Community Center: | 37.5% |
| Palo Alto: | 37.5% |
Percentage of single-mother households (among all households):
| Community Center: | 3.0% |
| Palo Alto: | 3.5% |
Percentage of never married males 15 years old and over:
Percentage of never married females 15 years old and over:
| Community Center: | 16.9% |
| Palo Alto: | 17.4% |
Percentage of never married females 15 years old and over:
| Community Center: | 7.9% |
| city: | 11.8% |
Percentage of people that speak English not well or not at all:
| Community Center: | 0.8% |
| Palo Alto: | 3.7% |
Percentage of people born in this state:
Percentage of people born in another U.S. state:
Percentage of native residents but born outside the U.S.:
Percentage of foreign born residents:
| Here: | 42.8% |
| Palo Alto: | 36.4% |
Percentage of people born in another U.S. state:
| Community Center: | 29.3% |
| Palo Alto: | 28.3% |
Percentage of native residents but born outside the U.S.:
| Here: | 2.5% |
| city: | 3.7% |
Percentage of foreign born residents:
| Here: | 25.4% |
| Palo Alto: | 31.6% |
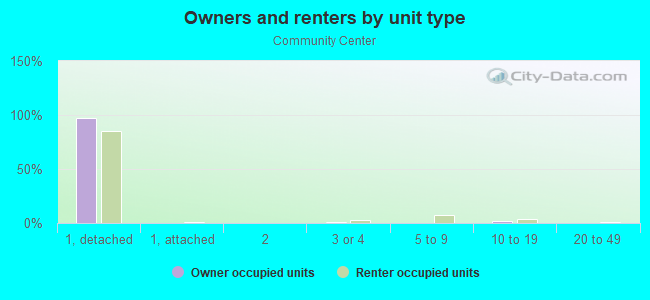
Owner-occupied
Renter-occupied

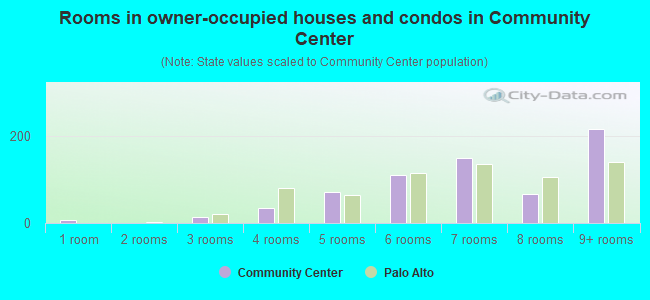
- Rooms in owner-occupied houses and condos in Community Center
- 61 room
- 02 rooms
- 143 rooms
- 344 rooms
- 705 rooms
- 1096 rooms
- 1487 rooms
- 668 rooms
- 2159+ rooms
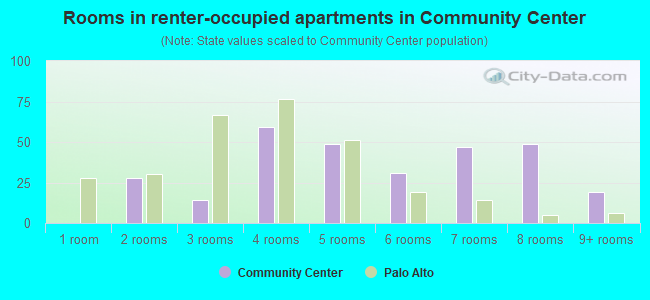
- Rooms in renter-occupied apartments in Community Center
- 01 room
- 282 rooms
- 143 rooms
- 594 rooms
- 495 rooms
- 316 rooms
- 477 rooms
- 498 rooms
- 199+ rooms
Owner-occupied
Renter-occupied

- Bedrooms in owner-occupied houses and condos in Community Center
- 6no bedroom
- 81 bedroom
- 472 bedrooms
- 1623 bedrooms
- 3854 bedrooms
- 645+ bedrooms
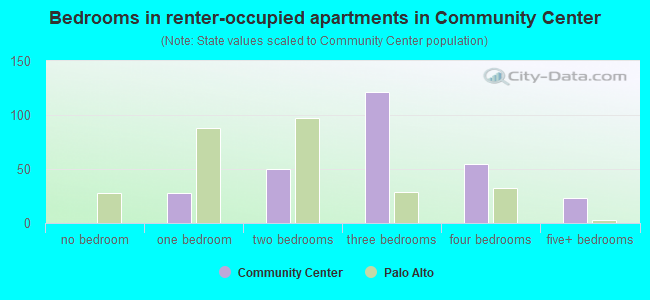
- Bedrooms in renter-occupied apartments in Community Center
- 0no bedroom
- 281 bedroom
- 502 bedrooms
- 1213 bedrooms
- 554 bedrooms
- 235+ bedrooms
Average number of cars or other vehicles available in houses/condos:
Average number of cars or other vehicles available in apartments:
| This neighborhood: | 1.7 |
| Palo Alto: | 2.1 |
Average number of cars or other vehicles available in apartments:
| Here: | 1.5 |
| city: | 1.1 |
Percentage of units with a mortgage:
| Community Center: | 81.9% |
| Palo Alto: | 58.3% |
Average estimated value of detached houses in 2022 (100.0% of all units):
| Community Center: | $2,669,710 |
| California: | $988,808 |
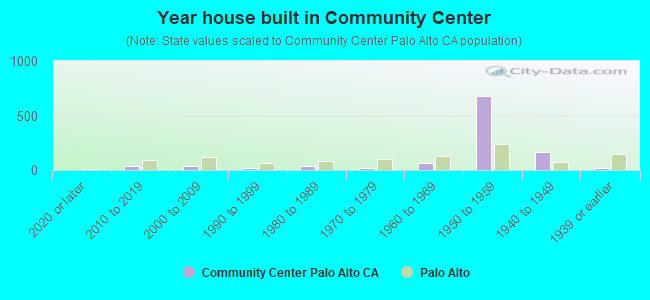
- Year house built in Community Center
- 02020 or later
- 332010 to 2019
- 332000 to 2009
- 161990 to 1999
- 371980 to 1989
- 161970 to 1979
- 641960 to 1969
- 6811950 to 1959
- 1651940 to 1949
- 151939 or earlier
City-data.com crime index for city in 2020 (higher means more crime):
| City: | 180.8 |
| U.S. average: | 219.5 |
Travel time to work (commute)
![Travel time to work (commute)]()
- 8Less than 5 minutes
- 225 to 9 minutes
- 11510 to 14 minutes
- 12715 to 19 minutes
- 12320 to 24 minutes
- 4825 to 29 minutes
- 4030 to 34 minutes
- 635 to 39 minutes
- 2540 to 44 minutes
- 5245 to 59 minutes
- 1860 to 89 minutes
- 1990 or more minutes

Means of transportation to work
![Means of transportation to work]()
- 69.8%650Drove a car alone
- 4.5%42Carpooled
- 0.5%5Bus
- 1.5%14Subway or elevated rail
- 2.5%23Long-distance train or commuter rail
- 4.6%43Taxi
- 0.3%3Motorcycle
- 3.3%31Bicycle
- 1.4%13Walked
- 1.7%16Other means
- 17.9%167Worked at home

Time leaving home to go to work
![Time leaving home to go to work]()
- 612:00 a.m. to 4:59 a.m.
- 85:00 a.m. to 5:29 a.m.
- 35:30 a.m. to 5:59 a.m.
- 136:00 a.m. to 6:29 a.m.
- 136:30 a.m. to 6:59 a.m.
- 387:00 a.m. to 7:29 a.m.
- 697:30 a.m. to 7:59 a.m.
- 1398:00 a.m. to 8:29 a.m.
- 948:30 a.m. to 8:59 a.m.
- 1009:00 a.m. to 9:59 a.m.
- 4710:00 a.m. to 10:59 a.m.
- 1011:00 a.m. to 11:59 a.m.
- 1212:00 p.m. to 3:59 p.m.
- 124:00 p.m. to 11:59 p.m.

Occupations of males:
- Percentage of males in management occupations (except farmers):
Here: 20.1% city: 19.1%
- Percentage of males in business and financial operations occupations:
Here: 14.8% city: 7.0%
- Percentage of males in computer and mathematical occupations:
Here: 41.5% city: 22.2%
- Percentage of males in architecture and engineering occupations:
Here: 4.9% city: 10.1%
- Percentage of males in life, physical, and social science occupations:
Here: 6.9% city: 6.4%
- Percentage of males in education, training, and library occupations:
Here: 4.1% city: 7.2%
- Percentage of males in arts, design, entertainment, sports, and media occupations:
Here: 4.9% city: 3.2%
- Percentage of males in healthcare practitioners and technical occupations:
Here: 7.6% city: 4.6%
- Percentage of males in construction, extraction, and maintenance occupations:
Here: 2.9% city: 1.7%
Occupations of females:
- Percentage of females in management occupations (except farmers):
Here: 20.3% city: 19.0%
- Percentage of females in business and financial operations occupations:
Here: 15.4% city: 8.3%
- Percentage of females in computer and mathematical occupations:
Here: 20.6% city: 8.6%
- Percentage of females in architecture and engineering occupations:
Here: 2.1% city: 4.0%
- Percentage of females in life, physical, and social science occupations:
Here: 3.2% city: 6.8%
- Percentage of females in legal occupations:
Here: 3.5% city: 4.8%
- Percentage of females in education, training, and library occupations:
Here: 8.1% city: 12.9%
- Percentage of females in arts, design, entertainment, sports, and media occupations:
Here: 4.2% city: 4.3%
- Percentage of females in healthcare practitioners and technical occupations:
Here: 5.6% city: 8.7%
- Percentage of females in service occupations:
Here: 3.5% city: 8.4%
- Percentage of females in sales and office occupations:
Here: 13.6% city: 11.7%
- Percentage of females in transportation occupations:
Here: 1.8% city: 0.4%
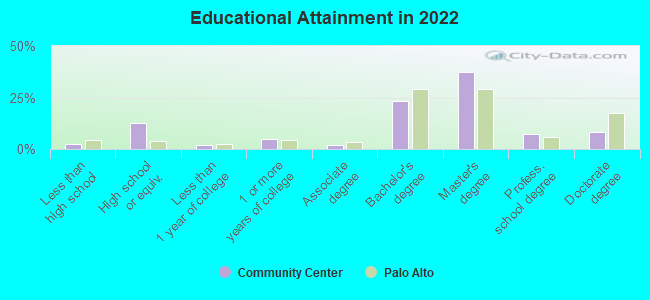
Education in this neighborhood (subdivision or community):
- Percentage of people 3 years and older in K-12 schools:
Community Center: 17.0% Palo Alto: 14.2%
- Percentage of people 3 years and older in undergraduate colleges:
Community Center: 6.7% Palo Alto: 2.4%
- Percentage of people 3 years and older in grad. or professional schools:
Community Center: 2.6% Palo Alto: 2.8%
- Percentage of students K-12 enrolled in private schools:
Community Center: 43.3% Palo Alto: 22.1%
Percentage of population below poverty level:
| Community Center: | 1.9% |
| Palo Alto: | 4.5% |
Median year owner moved in (as recorded in 2022):
Median year renter moved in (as recorded in 2022):
| Community Center: | 1999 |
| Palo Alto: | 2001 |
Median year renter moved in (as recorded in 2022):
| Community Center: | 2015 |
| Palo Alto: | 2019 |
Percentage of married-couple families with both working:
| Community Center: | 58.6% |
| Palo Alto: | 68.5% |
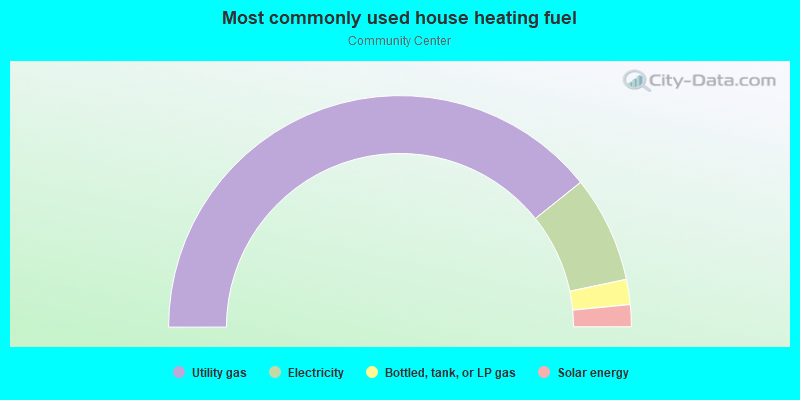
- 78.6%Utility gas
- 14.9%Electricity
- 3.5%Bottled, tank, or LP gas
- 3.1%Solar energy
Roads and streets:
Walter Hays Dr
Length: 0.79 miles
Directions: E-W, N-S, SE-NW, SW-NE
Address range: 100 to 299
Directions: E-W, N-S, SE-NW, SW-NE
Address range: 100 to 299
Embarcadero Rd
Length: 0.61 miles
Direction: E-W
Address range: 733 to 927
Direction: E-W
Address range: 733 to 927
Greenwood Ave
Length: 0.46 miles
Directions: E-W, SW-NE
Address range: 1000 to 1499
Directions: E-W, SW-NE
Address range: 1000 to 1499
Harker Ave
Length: 0.46 miles
Direction: E-W
Address range: 1000 to 1499
Direction: E-W
Address range: 1000 to 1499
Parkinson Ave
Length: 0.46 miles
Direction: E-W
Address range: 1000 to 1499
Direction: E-W
Address range: 1000 to 1499
Hopkins Ave
Length: 0.35 miles
Direction: E-W
Address range: 1100 to 1499
Direction: E-W
Address range: 1100 to 1499
Lois Ln
Length: 0.32 miles
Directions: E-W, N-S, SE-NW, SW-NE
Address range: 100 to 199
Directions: E-W, N-S, SE-NW, SW-NE
Address range: 100 to 199
Newell Rd
Length: 0.32 miles
Direction: N-S
Address range: 1000 to 1399
Direction: N-S
Address range: 1000 to 1399
Walnut Dr
Length: 0.31 miles
Directions: E-W, N-S, SE-NW, SW-NE
Address range: 1500 to 1599
Directions: E-W, N-S, SE-NW, SW-NE
Address range: 1500 to 1599
Fulton St
Length: 0.30 miles
Directions: E-W, SE-NW
Address range: 1000 to 1299
Directions: E-W, SE-NW
Address range: 1000 to 1299
Community Ln
Length: 0.26 miles
Direction: E-W
Address range: 1100 to 1398
Direction: E-W
Address range: 1100 to 1398
Guinda St
Length: 0.24 miles
Direction: SE-NW
Address range: 1000 to 1299
Direction: SE-NW
Address range: 1000 to 1299
Harriet St
Length: 0.22 miles
Direction: N-S
Address range: 1000 to 1299
Direction: N-S
Address range: 1000 to 1299
Melville Ave
Length: 0.21 miles
Directions: N-S, SW-NE
Address range: 726 to 880
Directions: N-S, SW-NE
Address range: 726 to 880
Stanley Way
Length: 0.15 miles
Directions: N-S, SW-NE
Address range: 1000 to 1199
Directions: N-S, SW-NE
Address range: 1000 to 1199
Cedar St
Length: 0.15 miles
Direction: N-S
Address range: 1100 to 1299
Direction: N-S
Address range: 1100 to 1299
Addison Ave
Length: 0.11 miles
Direction: SW-NE
Address range: 735 to 875
Direction: SW-NE
Address range: 735 to 875
Erstwild Ct
Length: 0.08 miles
Direction: N-S
Address range: 1 to 99
Direction: N-S
Address range: 1 to 99
Wilson St
Length: 0.08 miles
Direction: N-S
Address range: 1200 to 1299
Direction: N-S
Address range: 1200 to 1299
Pine St
Length: 0.08 miles
Direction: N-S
Address range: 1200 to 1299
Direction: N-S
Address range: 1200 to 1299
Hutchinson Ave
Length: 0.07 miles
Direction: N-S
Address range: 1000 to 1099
Direction: N-S
Address range: 1000 to 1099
Kingsley Ave
Length: 0.06 miles
Direction: SW-NE
Address range: 750 to 799
Direction: SW-NE
Address range: 750 to 799
Lincoln Ave
Length: 0.06 miles
Direction: SW-NE
Address range: 750 to 799
Direction: SW-NE
Address range: 750 to 799
Jordan Pl
Length: 0.05 miles
Directions: E-W, SE-NW
Address range: 1 to 99
Directions: E-W, SE-NW
Address range: 1 to 99