College Park neighborhood in Las Vegas, Nevada (NV), 89101 detailed profile
Settings
X

Business Search - 14 Million verified businesses
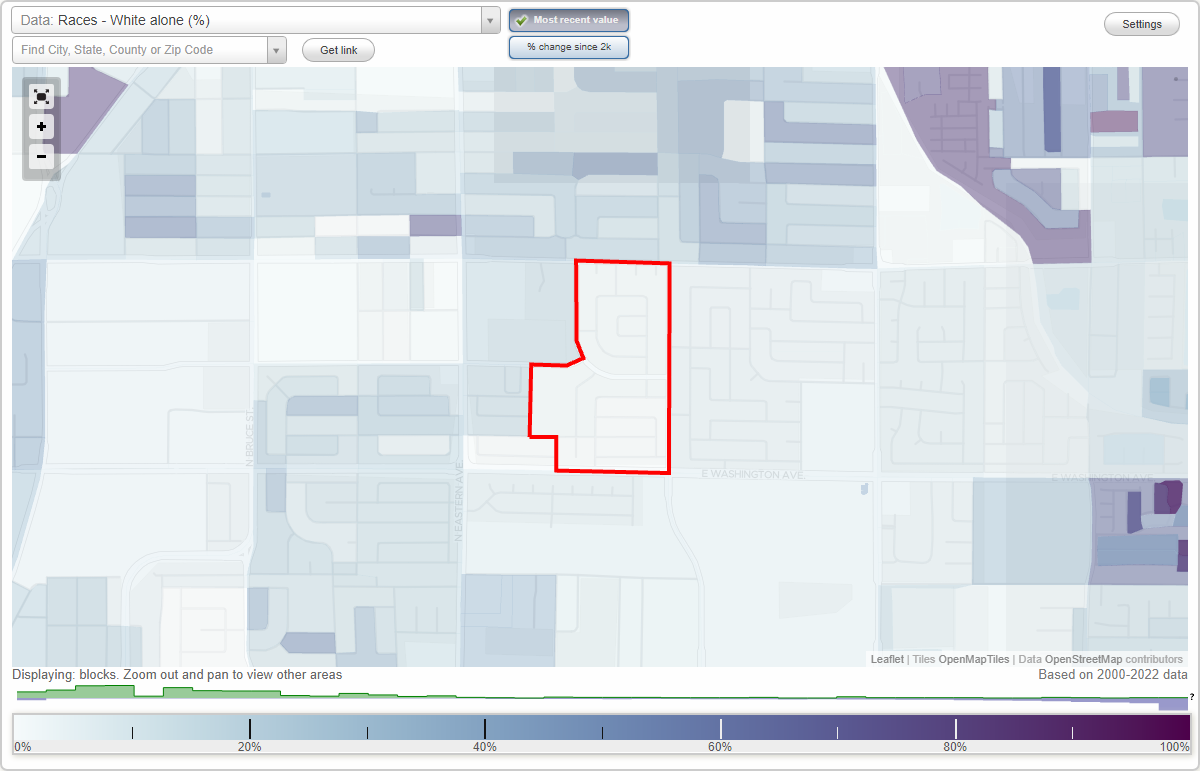
Area: 0.134 square miles
Population: 1,792
Population density:
| College Park: | 13,343 people per square mile |
| Las Vegas: | 5,792 people per square mile |

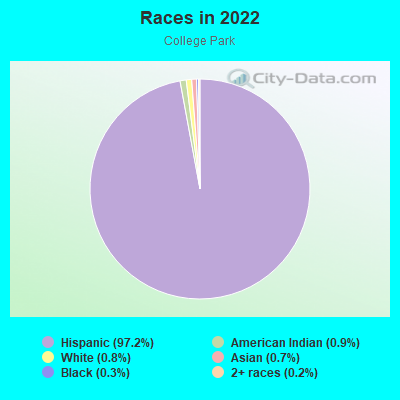
- 1,75697.2%Hispanic or Latino
- 160.9%American Indian
- 140.8%White
- 130.7%Asian
- 50.3%Black
- 30.2%Two or more races
Median household income in 2022:
| College Park: | $68,942 |
| Las Vegas: | $68,905 |
Distribution of median household income
![Distribution of median household income]()
- 6Less than $10,000
- 10$10,000 to $19,999
- 42$20,000 to $29,999
- 122$30,000 to $39,999
- 20$40,000 to $49,999
- 18$50,000 to $59,999
- 29$60,000 to $74,999
- 82$75,000 to $99,999
- 34$100,000 to $124,999
- 33$125,000 to $149,999
- 12$150,000 to $199,999
- 22$200,000 or more

Distribution of owner-occupied house/condo value
![Distribution of owner-occupied house/condo value]()
- 7Less than $50,000
- 19$50,000 to $99,999
- 48$100,000 to $149,999
- 23$150,000 to $199,999
- 74$200,000 to $249,999
- 43$250,000 to $299,999
- 9$500,000 to $749,999

Distribution of rent paid by renters
![Distribution of rent paid by renters]()
- 7$400 to $499
- 73$700 to $799
- 5$800 to $899
- 25$900 to $999
- 9$1,000 to $1,249
- 33$1,250 to $1,499
- 12$1,500 to $1,999

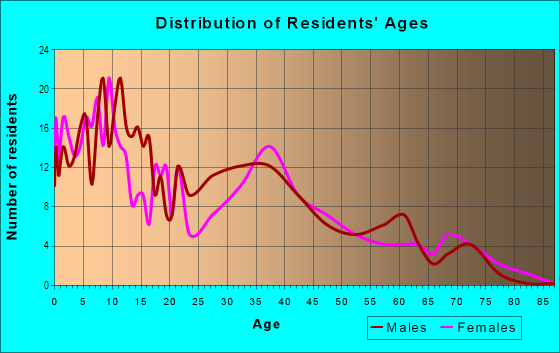
| Males: | 1,085 |
| Females: | 707 |
Males:
| This neighborhood: | 22.9 years |
| Whole city: | 38.4 years |
| This neighborhood: | 31.3 years |
| Whole city: | 38.9 years |
Average household size:
| College Park: | 5.6 people |
| Las Vegas: | 2.7 people |
Percentage of family households:
| College Park: | 55.4% |
| Las Vegas: | 45.8% |
| Here: | 24.8% |
| Las Vegas: | 40.9% |
Percentage of married-couple families with children (among all households):
| College Park: | 7.9% |
| Las Vegas: | 23.4% |
Percentage of single-mother households (among all households):
| College Park: | 10.0% |
| Las Vegas: | 10.1% |
Percentage of never married males 15 years old and over:
Percentage of never married females 15 years old and over:
| College Park: | 35.2% |
| Las Vegas: | 19.7% |
Percentage of never married females 15 years old and over:
| College Park: | 16.8% |
| city: | 17.0% |
Percentage of people that speak English not well or not at all:
| College Park: | 0.0% |
| Las Vegas: | 7.0% |
Percentage of people born in this state:
Percentage of people born in another U.S. state:
Percentage of native residents but born outside the U.S.:
Percentage of foreign born residents:
| Here: | 34.0% |
| Las Vegas: | 27.3% |
Percentage of people born in another U.S. state:
| College Park: | 22.9% |
| Las Vegas: | 49.8% |
Percentage of native residents but born outside the U.S.:
| Here: | 0.0% |
| city: | 1.9% |
Percentage of foreign born residents:
| Here: | 43.1% |
| Las Vegas: | 21.0% |
Owner-occupied
Renter-occupied

- Rooms in owner-occupied houses and condos in College Park
- 101 room
- 02 rooms
- 73 rooms
- 334 rooms
- 865 rooms
- 476 rooms
- 27 rooms
- 108 rooms
- 89+ rooms
- Rooms in renter-occupied apartments in College Park
- 01 room
- 02 rooms
- 03 rooms
- 704 rooms
- 115 rooms
- 376 rooms
- 97 rooms
- 08 rooms
- 09+ rooms
Owner-occupied
Renter-occupied
- Bedrooms in owner-occupied houses and condos in College Park
- 10no bedroom
- 01 bedroom
- 222 bedrooms
- 1253 bedrooms
- 534 bedrooms
- 105+ bedrooms
- Bedrooms in renter-occupied apartments in College Park
- 0no bedroom
- 01 bedroom
- 112 bedrooms
- 993 bedrooms
- 84 bedrooms
- 05+ bedrooms
Average number of cars or other vehicles available in houses/condos:
Average number of cars or other vehicles available in apartments:
| This neighborhood: | 2.5 |
| Las Vegas: | 2.0 |
Average number of cars or other vehicles available in apartments:
| Here: | 2.5 |
| city: | 1.3 |
Percentage of units with a mortgage:
| College Park: | 83.2% |
| Las Vegas: | 69.3% |
Average estimated value of detached houses in 2022 (96.4% of all units):
| College Park: | $215,321 |
| Nevada: | $549,327 |
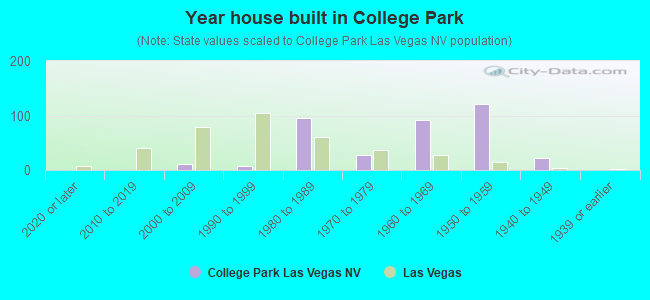
- Year house built in College Park
- 02020 or later
- 02010 to 2019
- 112000 to 2009
- 81990 to 1999
- 951980 to 1989
- 271970 to 1979
- 921960 to 1969
- 1221950 to 1959
- 221940 to 1949
- 01939 or earlier
City-data.com crime index for city in 2020 (higher means more crime):
| City: | 280.7 |
| U.S. average: | 219.5 |
Travel time to work (commute)
![Travel time to work (commute)]()
- 24Less than 5 minutes
- 175 to 9 minutes
- 1810 to 14 minutes
- 5515 to 19 minutes
- 18620 to 24 minutes
- 5525 to 29 minutes
- 8130 to 34 minutes
- 935 to 39 minutes
- 2540 to 44 minutes
- 4445 to 59 minutes
- 660 to 89 minutes
- 990 or more minutes

Means of transportation to work
![Means of transportation to work]()
- 42.7%471Drove a car alone
- 27.4%302Carpooled
- 0.3%3Bus
- 29.9%330Other means
- 0.1%1Worked at home

Time leaving home to go to work
![Time leaving home to go to work]()
- 7112:00 a.m. to 4:59 a.m.
- 35:00 a.m. to 5:29 a.m.
- 755:30 a.m. to 5:59 a.m.
- 736:00 a.m. to 6:29 a.m.
- 967:00 a.m. to 7:29 a.m.
- 457:30 a.m. to 7:59 a.m.
- 458:00 a.m. to 8:29 a.m.
- 38:30 a.m. to 8:59 a.m.
- 489:00 a.m. to 9:59 a.m.
- 110:00 a.m. to 10:59 a.m.
- 2612:00 p.m. to 3:59 p.m.
- 444:00 p.m. to 11:59 p.m.

Occupations of males:
- Percentage of males in business and financial operations occupations:
Here: 6.1% city: 3.6%
- Percentage of males in architecture and engineering occupations:
Here: 1.4% city: 1.8%
- Percentage of males in service occupations:
Here: 83.3% city: 23.3%
- Percentage of males in sales and office occupations:
Here: 3.2% city: 16.6%
- Percentage of males in construction, extraction, and maintenance occupations:
Here: 4.0% city: 10.6%
- Percentage of males in production occupations:
Here: 1.5% city: 3.3%
- Percentage of males in material moving occupations:
Here: 1.1% city: 5.4%
Occupations of females:
- Percentage of females in management occupations (except farmers):
Here: 15.5% city: 8.5%
- Percentage of females in business and financial operations occupations:
Here: 2.3% city: 5.7%
- Percentage of females in community and social services occupations:
Here: 1.1% city: 1.9%
- Percentage of females in education, training, and library occupations:
Here: 2.0% city: 8.0%
- Percentage of females in service occupations:
Here: 37.8% city: 26.5%
- Percentage of females in sales and office occupations:
Here: 4.9% city: 30.5%
- Percentage of females in construction, extraction, and maintenance occupations:
Here: 16.4% city: 0.4%
- Percentage of females in transportation occupations:
Here: 3.6% city: 1.6%
- Percentage of females in material moving occupations:
Here: 10.2% city: 2.2%
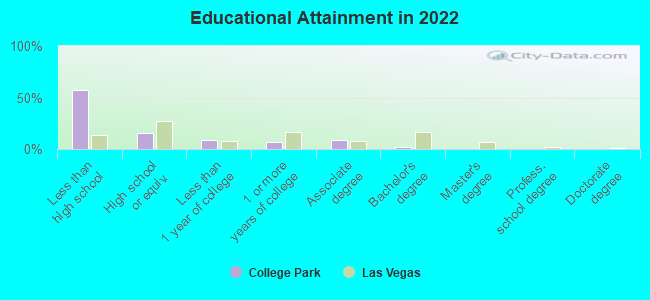
Education in this neighborhood (subdivision or community):
- Percentage of people 3 years and older in K-12 schools:
College Park: 22.4% Las Vegas: 17.4%
- Percentage of people 3 years and older in undergraduate colleges:
College Park: 3.2% Las Vegas: 4.2%
- Percentage of people 3 years and older in grad. or professional schools:
College Park: 0.2% Las Vegas: 1.0%
- Percentage of students K-12 enrolled in private schools:
College Park: 1.0% Las Vegas: 12.9%
Percentage of population below poverty level:
| College Park: | 20.7% |
| Las Vegas: | 14.1% |
Median year owner moved in (as recorded in 2022):
Median year renter moved in (as recorded in 2022):
| College Park: | 2012 |
| Las Vegas: | 2015 |
Median year renter moved in (as recorded in 2022):
| College Park: | 2019 |
| Las Vegas: | 2020 |
Percentage of married-couple families with both working:
| College Park: | 100.0% |
| Las Vegas: | 62.0% |
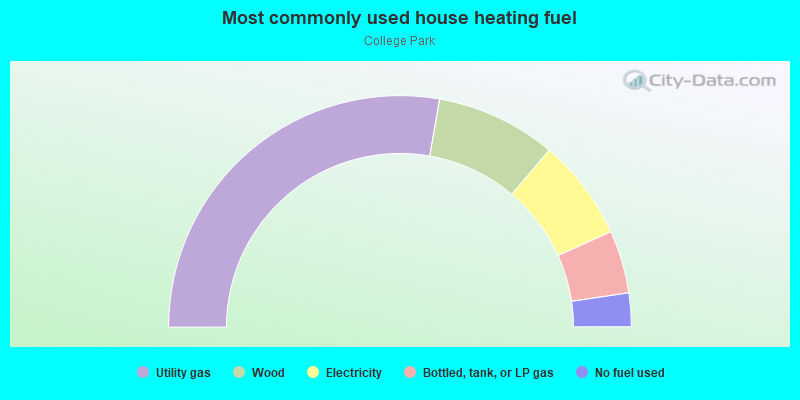
- 55.5%Utility gas
- 16.8%Wood
- 14.2%Electricity
- 8.8%Bottled, tank, or LP gas
- 4.7%No fuel used
Roads and streets:
Meyer St
Length: 0.31 miles
Directions: N-S, SE-NW, SW-NE
Address range: 900 to 1599
Directions: N-S, SE-NW, SW-NE
Address range: 900 to 1599
N Mojave Rd
Length: 0.30 miles
Direction: N-S
Address range: 900 to 1399
Direction: N-S
Address range: 900 to 1399
E Jansen Ave
Length: 0.29 miles
Direction: E-W
Address range: 2800 to 2999
Direction: E-W
Address range: 2800 to 2999
Vaughn St
Length: 0.24 miles
Directions: N-S, SW-NE
Address range: 900 to 1299
Directions: N-S, SW-NE
Address range: 900 to 1299
Melissa St
Length: 0.23 miles
Direction: N-S
Address range: 1200 to 1599
Direction: N-S
Address range: 1200 to 1599
E Searles Ave
Length: 0.22 miles
Direction: E-W
Address range: 2800 to 2999
Direction: E-W
Address range: 2800 to 2999
E Washington Ave
Length: 0.22 miles
Direction: E-W
Address range: 2900 to 2999
Direction: E-W
Address range: 2900 to 2999
Brady Ave
Length: 0.22 miles
Direction: E-W
Address range: 2800 to 2999
Direction: E-W
Address range: 2800 to 2999
Demetrius Ave
Length: 0.21 miles
Direction: E-W
Address range: 2900 to 2999
Direction: E-W
Address range: 2900 to 2999
Theresa Ave
Length: 0.17 miles
Directions: E-W, SE-NW
Address range: 2800 to 2999
Directions: E-W, SE-NW
Address range: 2800 to 2999
Armin Ave
Length: 0.15 miles
Directions: E-W, SE-NW, SW-NE
Address range: 2800 to 2999
Directions: E-W, SE-NW, SW-NE
Address range: 2800 to 2999
Marcia Ave
Length: 0.13 miles
Directions: E-W, SE-NW
Address range: 2800 to 2999
Directions: E-W, SE-NW
Address range: 2800 to 2999
Mac Farlane St
Length: 0.09 miles
Directions: N-S, SE-NW
Address range: 900 to 1108
Directions: N-S, SE-NW
Address range: 900 to 1108
Millie Ave
Length: 0.09 miles
Directions: E-W, SE-NW
Address range: 2800 to 2999
Directions: E-W, SE-NW
Address range: 2800 to 2999
Mitzi Ave
Length: 0.08 miles
Direction: E-W
Address range: 2900 to 2999
Direction: E-W
Address range: 2900 to 2999
Lucilee St
Length: 0.05 miles
Directions: N-S, SE-NW, SW-NE
Address range: 1400 to 1499
Directions: N-S, SE-NW, SW-NE
Address range: 1400 to 1499