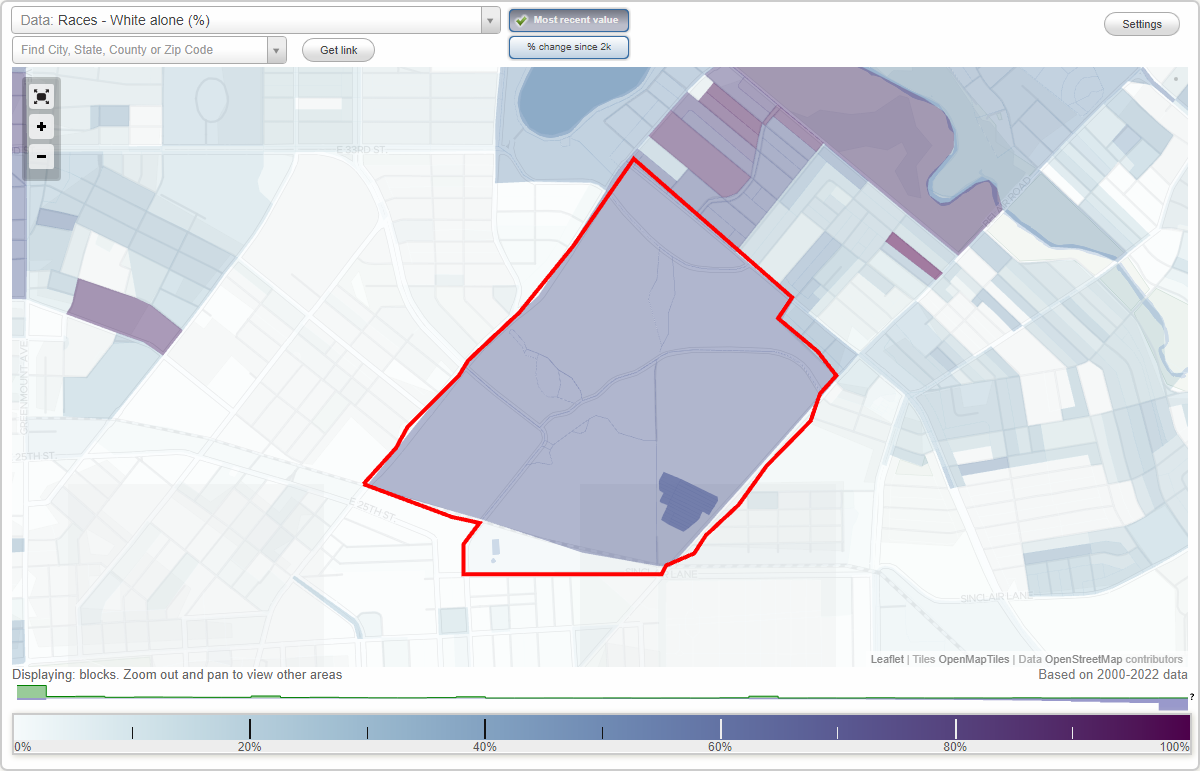
Clifton Park neighborhood in Baltimore, Maryland (MD), 21213 detailed profile
Settings
X

Business Search - 14 Million verified businesses
Area: 0.569 square miles
Population: 1,044
Population density:
| Clifton Park: | 1,834 people per square mile |
| Baltimore: | 7,053 people per square mile |

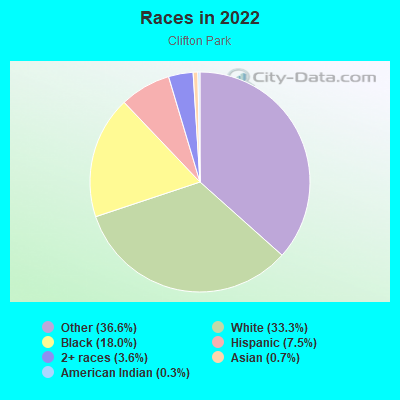
- 60536.6%Some other race
- 54933.3%White
- 29718.0%Black
- 1247.5%Hispanic or Latino
- 603.6%Two or more races
- 110.7%Asian
- 50.3%American Indian
Distribution of median household income
![Distribution of median household income]()
- 242Less than $10,000
- 914$10,000 to $19,999
- 186$20,000 to $29,999
- 438$30,000 to $39,999
- 32$40,000 to $49,999
- 160$50,000 to $59,999
- 47$60,000 to $74,999
- 307$75,000 to $99,999
- 70$100,000 to $124,999
- 83$125,000 to $149,999
- 49$150,000 to $199,999
- 43$200,000 or more

Distribution of owner-occupied house/condo value
![Distribution of owner-occupied house/condo value]()
- 1,704Less than $50,000
- 1,603$50,000 to $99,999
- 558$100,000 to $149,999
- 52$150,000 to $199,999
- 44$200,000 to $249,999
- 77$250,000 to $299,999
- 131$300,000 to $399,999
- 531$400,000 to $499,999
- 25$500,000 to $749,999
- 185$750,000 to $999,999
- 17$1,000,000 or more

Distribution of rent paid by renters
![Distribution of rent paid by renters]()
- 415Less than $100
- 98$100 to $199
- 297$200 to $299
- 7$300 to $399
- 202$400 to $499
- 234$500 to $599
- 59$600 to $699
- 720$700 to $799
- 531$800 to $899
- 124$900 to $999
- 786$1,000 to $1,249
- 289$1,250 to $1,499
- 10$1,500 to $1,999

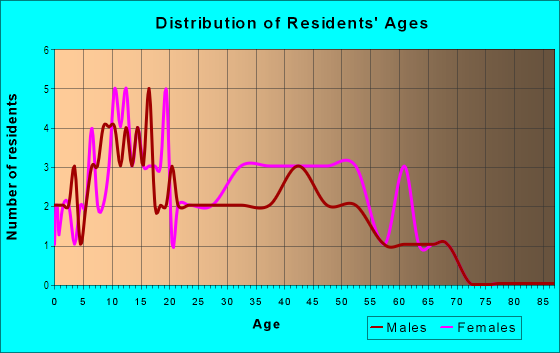
| Males: | 517 |
| Females: | 527 |
Males:
| This neighborhood: | 32.6 years |
| Whole city: | 35.0 years |
| This neighborhood: | 39.9 years |
| Whole city: | 38.2 years |
Average household size:
| Clifton Park: | 3.0 people |
| Baltimore: | 2.2 people |
Percentage of family households:
| Clifton Park: | 58.0% |
| Baltimore: | 34.2% |
| Here: | 47.6% |
| Baltimore: | 23.3% |
Percentage of married-couple families with children (among all households):
| Clifton Park: | 31.2% |
| Baltimore: | 22.4% |
Percentage of single-mother households (among all households):
| Clifton Park: | 5.6% |
| Baltimore: | 18.7% |
Percentage of never married males 15 years old and over:
Percentage of never married females 15 years old and over:
| Clifton Park: | 19.9% |
| Baltimore: | 25.1% |
Percentage of never married females 15 years old and over:
| Clifton Park: | 11.2% |
| city: | 27.5% |
Percentage of people that speak English not well or not at all:
| Clifton Park: | 0.0% |
| Baltimore: | 2.3% |
Percentage of people born in this state:
Percentage of people born in another U.S. state:
Percentage of native residents but born outside the U.S.:
Percentage of foreign born residents:
| Here: | 74.0% |
| Baltimore: | 64.4% |
Percentage of people born in another U.S. state:
| Clifton Park: | 18.2% |
| Baltimore: | 25.0% |
Percentage of native residents but born outside the U.S.:
| Here: | 2.1% |
| city: | 0.9% |
Percentage of foreign born residents:
| Here: | 6.2% |
| Baltimore: | 9.7% |
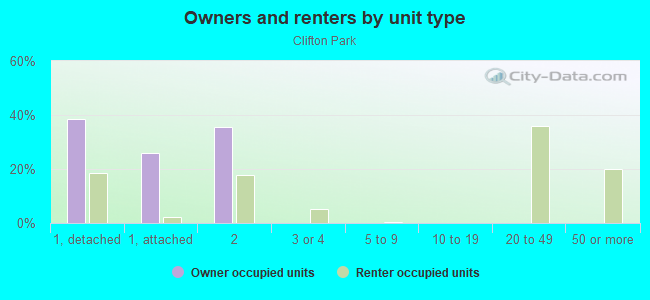
Owner-occupied
Renter-occupied

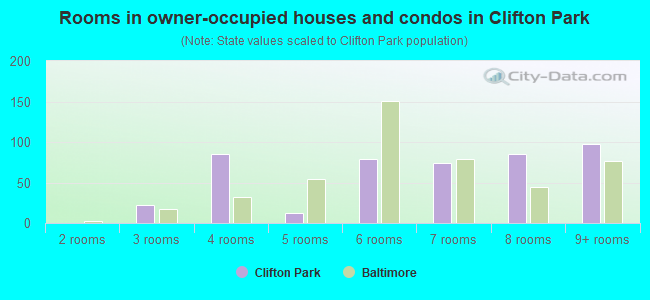
- Rooms in owner-occupied houses and condos in Clifton Park
- 01 room
- 02 rooms
- 223 rooms
- 854 rooms
- 125 rooms
- 796 rooms
- 747 rooms
- 858 rooms
- 989+ rooms
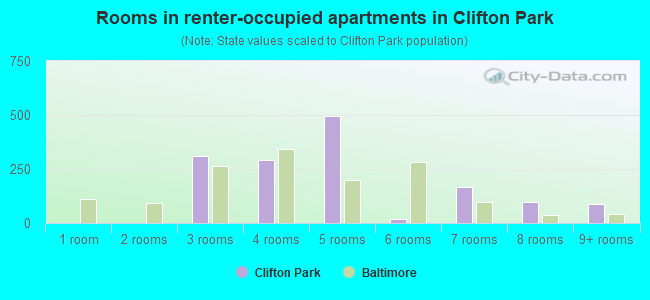
- Rooms in renter-occupied apartments in Clifton Park
- 01 room
- 02 rooms
- 3113 rooms
- 2904 rooms
- 4945 rooms
- 186 rooms
- 1657 rooms
- 998 rooms
- 869+ rooms
Owner-occupied
Renter-occupied
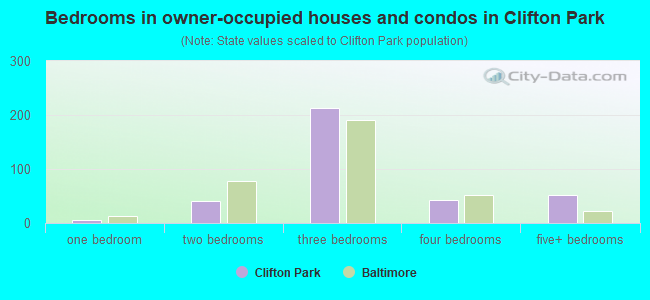
- Bedrooms in owner-occupied houses and condos in Clifton Park
- 0no bedroom
- 61 bedroom
- 412 bedrooms
- 2133 bedrooms
- 434 bedrooms
- 525+ bedrooms
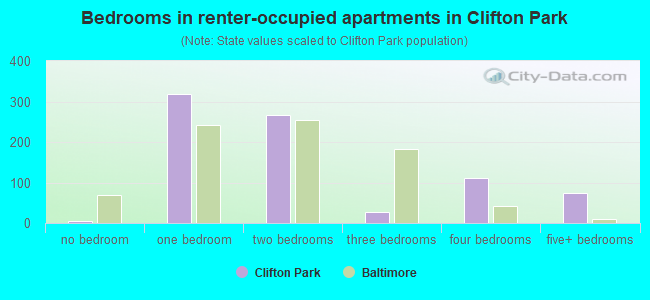
- Bedrooms in renter-occupied apartments in Clifton Park
- 4no bedroom
- 3191 bedroom
- 2662 bedrooms
- 273 bedrooms
- 1114 bedrooms
- 735+ bedrooms
Average number of cars or other vehicles available in houses/condos:
Average number of cars or other vehicles available in apartments:
| This neighborhood: | 8.0 |
| Baltimore: | 1.5 |
Average number of cars or other vehicles available in apartments:
| Here: | |
| city: |
Percentage of units with a mortgage:
| Clifton Park: | 84.5% |
| Baltimore: | 64.3% |
Average estimated value of townhouses or other attached units in 2022 (48.1% of all units):
| This neighborhood: | $251,223 |
| city: | $206,258 |
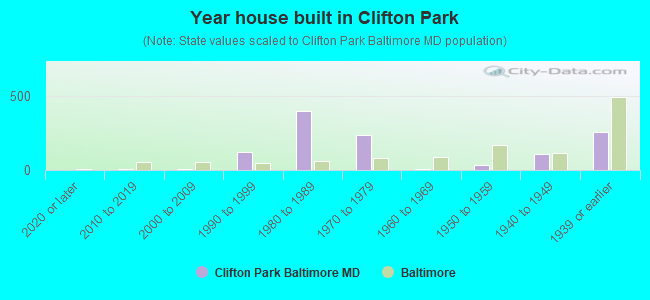
- Year house built in Clifton Park
- 02020 or later
- 52010 to 2019
- 42000 to 2009
- 1181990 to 1999
- 3941980 to 1989
- 2371970 to 1979
- 81960 to 1969
- 351950 to 1959
- 1061940 to 1949
- 2581939 or earlier
Travel time to work (commute)
![Travel time to work (commute)]()
- 19Less than 5 minutes
- 125 to 9 minutes
- 5310 to 14 minutes
- 5115 to 19 minutes
- 11320 to 24 minutes
- 3925 to 29 minutes
- 7730 to 34 minutes
- 3135 to 39 minutes
- 1540 to 44 minutes
- 3345 to 59 minutes
- 2560 to 89 minutes
- 1790 or more minutes

Means of transportation to work
![Means of transportation to work]()
- 58.3%313Drove a car alone
- 8.4%45Carpooled
- 107.4%577Bus
- 1.3%7Long-distance train or commuter rail
- 0.9%5Light rail, streetcar or trolley
- 46.9%252Taxi
- 63.9%343Bicycle
- 10.8%58Walked
- 59.8%321Other means
- 17.7%95Worked at home

Time leaving home to go to work
![Time leaving home to go to work]()
- 4012:00 a.m. to 4:59 a.m.
- 105:00 a.m. to 5:29 a.m.
- 65:30 a.m. to 5:59 a.m.
- 196:00 a.m. to 6:29 a.m.
- 526:30 a.m. to 6:59 a.m.
- 567:00 a.m. to 7:29 a.m.
- 357:30 a.m. to 7:59 a.m.
- 308:00 a.m. to 8:29 a.m.
- 588:30 a.m. to 8:59 a.m.
- 879:00 a.m. to 9:59 a.m.
- 1210:00 a.m. to 10:59 a.m.
- 911:00 a.m. to 11:59 a.m.
- 3412:00 p.m. to 3:59 p.m.
- 174:00 p.m. to 11:59 p.m.

Occupations of males:
- Percentage of males in management occupations (except farmers):
Here: 11.8% city: 10.7%
- Percentage of males in business and financial operations occupations:
Here: 5.6% city: 5.9%
- Percentage of males in computer and mathematical occupations:
Here: 1.5% city: 6.1%
- Percentage of males in architecture and engineering occupations:
Here: 2.0% city: 2.9%
- Percentage of males in education, training, and library occupations:
Here: 18.0% city: 5.4%
- Percentage of males in healthcare practitioners and technical occupations:
Here: 12.4% city: 4.0%
- Percentage of males in service occupations:
Here: 5.6% city: 14.7%
- Percentage of males in sales and office occupations:
Here: 19.2% city: 14.2%
- Percentage of males in construction, extraction, and maintenance occupations:
Here: 4.0% city: 5.6%
- Percentage of males in transportation occupations:
Here: 1.5% city: 6.8%
- Percentage of males in material moving occupations:
Here: 4.9% city: 7.0%
Occupations of females:
- Percentage of females in management occupations (except farmers):
Here: 11.4% city: 10.1%
- Percentage of females in business and financial operations occupations:
Here: 9.3% city: 6.6%
- Percentage of females in architecture and engineering occupations:
Here: 2.6% city: 0.9%
- Percentage of females in life, physical, and social science occupations:
Here: 2.9% city: 2.5%
- Percentage of females in education, training, and library occupations:
Here: 13.5% city: 10.7%
- Percentage of females in arts, design, entertainment, sports, and media occupations:
Here: 12.0% city: 2.4%
- Percentage of females in healthcare practitioners and technical occupations:
Here: 16.9% city: 9.8%
- Percentage of females in service occupations:
Here: 13.1% city: 20.4%
- Percentage of females in sales and office occupations:
Here: 13.3% city: 22.3%
- Percentage of females in production occupations:
Here: 3.2% city: 2.3%
- Percentage of females in material moving occupations:
Here: 1.3% city: 1.9%
Percentage of people 16-64 in Armed Forces:
| Clifton Park: | 0.9% |
| Baltimore: | 0.4% |
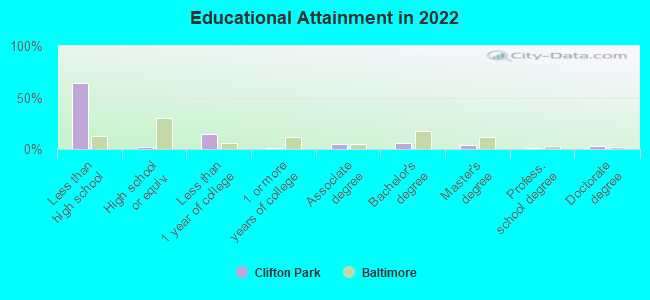
Education in this neighborhood (subdivision or community):
- Percentage of people 3 years and older in K-12 schools:
Clifton Park: 36.5% Baltimore: 14.7%
- Percentage of people 3 years and older in undergraduate colleges:
Clifton Park: 78.4% Baltimore: 6.0%
- Percentage of people 3 years and older in grad. or professional schools:
Clifton Park: 1.5% Baltimore: 2.8%
- Percentage of students K-12 enrolled in private schools:
Clifton Park: 184.5% Baltimore: 12.7%
Percentage of population below poverty level:
| Clifton Park: | 13.9% |
| Baltimore: | 18.5% |
Median year owner moved in (as recorded in 2022):
| Clifton Park: | 1999 |
| Baltimore: | 2009 |
Percentage of married-couple families with both working:
| Clifton Park: | 98.1% |
| Baltimore: | 79.2% |
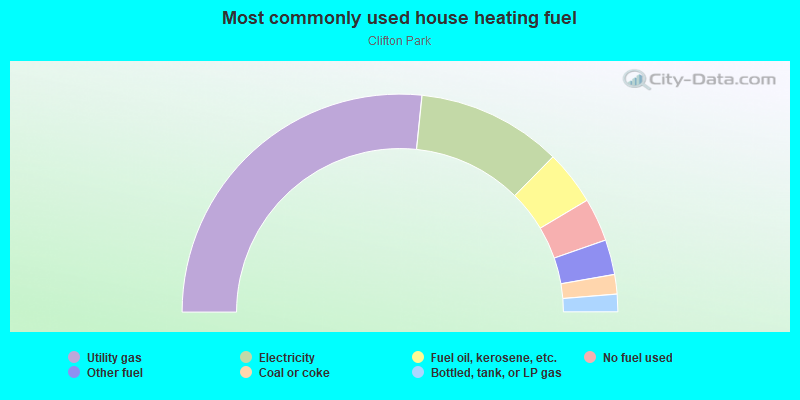
- 53.2%Utility gas
- 21.5%Electricity
- 8.1%Fuel oil, kerosene, etc.
- 6.4%No fuel used
- 5.2%Other fuel
- 2.9%Coal or coke
- 2.6%Bottled, tank, or LP gas
Highways in this neighborhood:
US Hwy 1 (Belair Rd)
Length: 0.46 miles
Direction: SW-NE
Address range: 2001 to 2999
Direction: SW-NE
Address range: 2001 to 2999
State Hwy 147 (Harford Rd)
Length: 0.12 miles
Direction: SW-NE
Address range: 2574 to 2979
Direction: SW-NE
Address range: 2574 to 2979
Roads and streets:
Sinclair Ln
Length: 0.57 miles
Direction: E-W
Address range: 2000 to 2499
Direction: E-W
Address range: 2000 to 2499
Erdman Ave
Length: 0.56 miles
Direction: SE-NW
Address range: 2218 to 2799
Direction: SE-NW
Address range: 2218 to 2799
N Rose St
Length: 0.45 miles
Direction: N-S
Address range: 2003 to 2701
Direction: N-S
Address range: 2003 to 2701
St Lo Dr
Length: 0.29 miles
Directions: N-S, SE-NW, SW-NE
Address range: 2701 to 2853
Directions: N-S, SE-NW, SW-NE
Address range: 2701 to 2853
Clifton Park Ter
Length: 0.14 miles
Direction: SE-NW
Address range: 2800 to 2999
Direction: SE-NW
Address range: 2800 to 2999
Lyndale Ave
Length: 0.02 miles
Direction: E-W
Address range: 3100 to 3127
Direction: E-W
Address range: 3100 to 3127
Railroad features:
Baltimore and Ohio RR
Length: 0.53 miles
Direction: E-W
Direction: E-W