Clearpointe neighborhood in Vallejo, California (CA), 94591 detailed profile
Settings
X

Business Search - 14 Million verified businesses
Area: 0.058 square miles
Population: 284
Population density:
| Clearpointe: | 4,921 people per square mile |
| Vallejo: | 4,094 people per square mile |

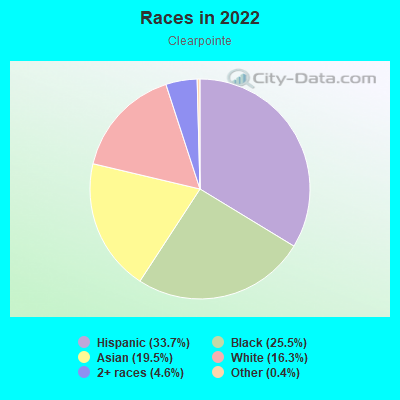
- 9533.7%Hispanic or Latino
- 7225.5%Black
- 5519.5%Asian
- 4616.3%White
- 134.6%Two or more races
- 10.4%Some other race
Median household income in 2022:
| Clearpointe: | $100,698 |
| Vallejo: | $88,063 |
Distribution of median household income
![Distribution of median household income]()
- 6Less than $10,000
- 13$10,000 to $19,999
- 4$20,000 to $29,999
- 3$30,000 to $39,999
- 5$40,000 to $49,999
- 5$50,000 to $59,999
- 4$60,000 to $74,999
- 8$75,000 to $99,999
- 20$100,000 to $124,999
- 4$125,000 to $149,999
- 15$150,000 to $199,999
- 11$200,000 or more

Distribution of owner-occupied house/condo value
![Distribution of owner-occupied house/condo value]()
- 3Less than $50,000
- 2$50,000 to $99,999
- 1$100,000 to $149,999
- 6$200,000 to $249,999
- 3$250,000 to $299,999
- 11$300,000 to $399,999
- 32$400,000 to $499,999
- 28$500,000 to $749,999

Distribution of rent paid by renters
![Distribution of rent paid by renters]()
- 2$1,000 to $1,249
- 3$1,250 to $1,499
- 9$1,500 to $1,999
- 10$2,000 or more

Median rent in 2022:
| Clearpointe: | $1,819 |
| Vallejo: | $1,780 |
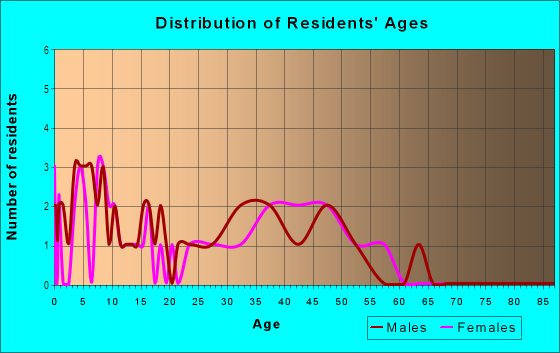
| Males: | 148 |
| Females: | 136 |
Males:
| This neighborhood: | 42.1 years |
| Whole city: | 39.4 years |
| This neighborhood: | 39.8 years |
| Whole city: | 43.4 years |
Average household size:
| Clearpointe: | 3.1 people |
| Vallejo: | 2.6 people |
Percentage of family households:
| Clearpointe: | 46.2% |
| Vallejo: | 44.4% |
| Here: | 50.4% |
| Vallejo: | 39.4% |
Percentage of married-couple families with children (among all households):
| Clearpointe: | 22.6% |
| Vallejo: | 19.6% |
Percentage of single-mother households (among all households):
| Clearpointe: | 3.6% |
| Vallejo: | 13.8% |
Percentage of never married males 15 years old and over:
Percentage of never married females 15 years old and over:
| Clearpointe: | 24.6% |
| Vallejo: | 21.9% |
Percentage of never married females 15 years old and over:
| Clearpointe: | 20.2% |
| city: | 16.3% |
Percentage of people that speak English not well or not at all:
| Clearpointe: | 4.9% |
| Vallejo: | 7.3% |
Percentage of people born in this state:
Percentage of people born in another U.S. state:
Percentage of native residents but born outside the U.S.:
Percentage of foreign born residents:
| Here: | 60.4% |
| Vallejo: | 53.4% |
Percentage of people born in another U.S. state:
| Clearpointe: | 12.8% |
| Vallejo: | 13.0% |
Percentage of native residents but born outside the U.S.:
| Here: | 2.0% |
| city: | 2.1% |
Percentage of foreign born residents:
| Here: | 24.8% |
| Vallejo: | 31.5% |
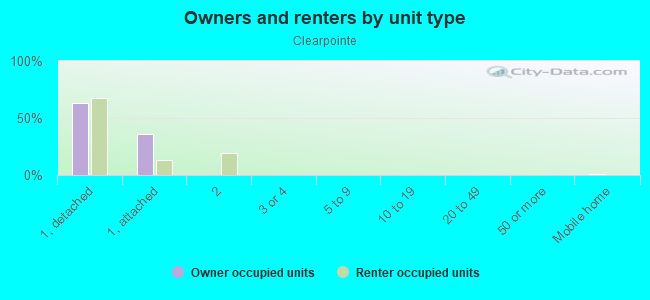
Owner-occupied
Renter-occupied

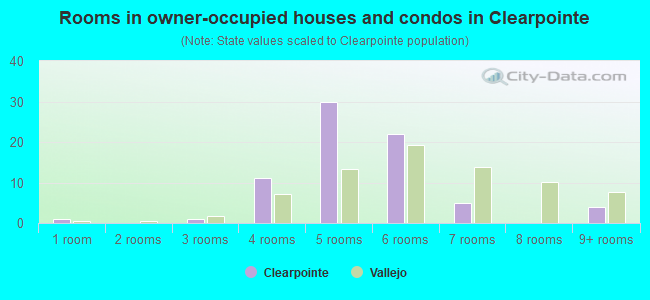
- Rooms in owner-occupied houses and condos in Clearpointe
- 11 room
- 02 rooms
- 13 rooms
- 114 rooms
- 305 rooms
- 226 rooms
- 57 rooms
- 08 rooms
- 49+ rooms
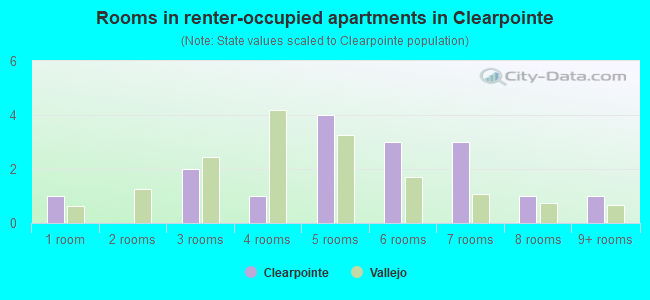
- Rooms in renter-occupied apartments in Clearpointe
- 11 room
- 02 rooms
- 23 rooms
- 14 rooms
- 45 rooms
- 36 rooms
- 37 rooms
- 18 rooms
- 19+ rooms
Owner-occupied
Renter-occupied
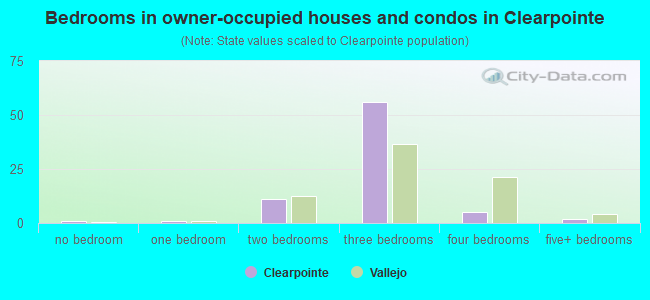
- Bedrooms in owner-occupied houses and condos in Clearpointe
- 1no bedroom
- 11 bedroom
- 112 bedrooms
- 563 bedrooms
- 54 bedrooms
- 25+ bedrooms
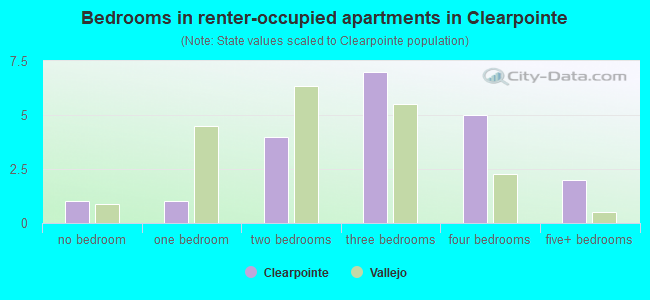
- Bedrooms in renter-occupied apartments in Clearpointe
- 1no bedroom
- 11 bedroom
- 42 bedrooms
- 73 bedrooms
- 54 bedrooms
- 25+ bedrooms
Average number of cars or other vehicles available in houses/condos:
Average number of cars or other vehicles available in apartments:
| This neighborhood: | 2.3 |
| Vallejo: | 2.2 |
Average number of cars or other vehicles available in apartments:
| Here: | 2.5 |
| city: | 1.8 |
Percentage of units with a mortgage:
| Clearpointe: | 63.1% |
| Vallejo: | 72.1% |
Housing prices:
- Average estimated value of detached houses in 2022 (70.2% of all units):
Clearpointe: $434,176 Vallejo: $530,848
- Average estimated value of townhouses or other attached units in 2022 (29.8% of all units):
This neighborhood: $466,889 city: $462,369
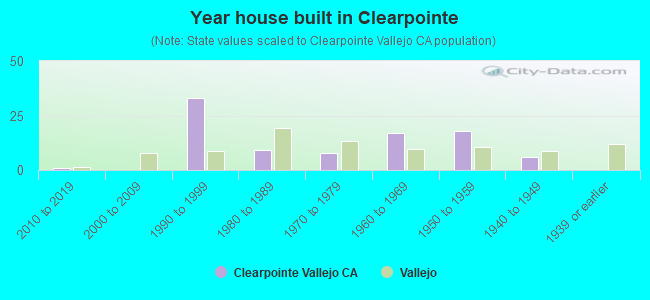
- Year house built in Clearpointe
- 02020 or later
- 12010 to 2019
- 02000 to 2009
- 331990 to 1999
- 91980 to 1989
- 81970 to 1979
- 171960 to 1969
- 181950 to 1959
- 61940 to 1949
- 01939 or earlier
City-data.com crime index for city in 2020 (higher means more crime):
| City: | 542.0 |
| U.S. average: | 219.5 |
Travel time to work (commute)
![Travel time to work (commute)]()
- 1Less than 5 minutes
- 105 to 9 minutes
- 1310 to 14 minutes
- 1715 to 19 minutes
- 620 to 24 minutes
- 825 to 29 minutes
- 930 to 34 minutes
- 535 to 39 minutes
- 140 to 44 minutes
- 445 to 59 minutes
- 1660 to 89 minutes
- 690 or more minutes

Means of transportation to work
![Means of transportation to work]()
- 72.7%97Drove a car alone
- 11.2%15Carpooled
- 0.7%1Bus
- 0.7%1Ferryboat
- 0.7%1Motorcycle
- 3.7%5Other means
- 9.0%12Worked at home

Time leaving home to go to work
![Time leaving home to go to work]()
- 212:00 a.m. to 4:59 a.m.
- 65:00 a.m. to 5:29 a.m.
- 65:30 a.m. to 5:59 a.m.
- 176:00 a.m. to 6:29 a.m.
- 46:30 a.m. to 6:59 a.m.
- 97:00 a.m. to 7:29 a.m.
- 67:30 a.m. to 7:59 a.m.
- 148:00 a.m. to 8:29 a.m.
- 68:30 a.m. to 8:59 a.m.
- 159:00 a.m. to 9:59 a.m.
- 410:00 a.m. to 10:59 a.m.
- 1012:00 p.m. to 3:59 p.m.
- 64:00 p.m. to 11:59 p.m.

Occupations of males:
- Percentage of males in management occupations (except farmers):
Here: 2.6% city: 7.0%
- Percentage of males in business and financial operations occupations:
Here: 1.2% city: 3.6%
- Percentage of males in computer and mathematical occupations:
Here: 1.3% city: 3.5%
- Percentage of males in legal occupations:
Here: 8.0% city: 0.8%
- Percentage of males in education, training, and library occupations:
Here: 5.9% city: 2.0%
- Percentage of males in arts, design, entertainment, sports, and media occupations:
Here: 1.7% city: 2.6%
- Percentage of males in service occupations:
Here: 21.1% city: 16.8%
- Percentage of males in sales and office occupations:
Here: 18.3% city: 17.5%
- Percentage of males in farming, fishing, and forestry occupations:
Here: 4.7% city: 0.9%
- Percentage of males in construction, extraction, and maintenance occupations:
Here: 7.6% city: 11.1%
- Percentage of males in production occupations:
Here: 4.0% city: 6.9%
- Percentage of males in transportation occupations:
Here: 16.2% city: 7.9%
- Percentage of males in material moving occupations:
Here: 1.9% city: 6.0%
Occupations of females:
- Percentage of females in management occupations (except farmers):
Here: 3.3% city: 8.8%
- Percentage of females in business and financial operations occupations:
Here: 4.4% city: 5.8%
- Percentage of females in life, physical, and social science occupations:
Here: 5.3% city: 1.5%
- Percentage of females in community and social services occupations:
Here: 8.4% city: 3.7%
- Percentage of females in legal occupations:
Here: 2.0% city: 1.2%
- Percentage of females in education, training, and library occupations:
Here: 1.3% city: 6.4%
- Percentage of females in healthcare practitioners and technical occupations:
Here: 5.7% city: 10.2%
- Percentage of females in service occupations:
Here: 20.7% city: 23.2%
- Percentage of females in sales and office occupations:
Here: 39.7% city: 27.3%
- Percentage of females in transportation occupations:
Here: 7.7% city: 1.1%
- Percentage of females in material moving occupations:
Here: 2.3% city: 3.0%
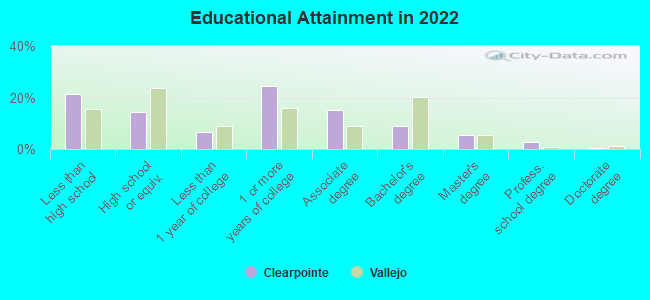
Education in this neighborhood (subdivision or community):
- Percentage of people 3 years and older in K-12 schools:
Clearpointe: 13.0% Vallejo: 15.1%
- Percentage of people 3 years and older in undergraduate colleges:
Clearpointe: 10.5% Vallejo: 4.9%
- Percentage of people 3 years and older in grad. or professional schools:
Clearpointe: 0.4% Vallejo: 1.2%
- Percentage of students K-12 enrolled in private schools:
Clearpointe: 19.4% Vallejo: 14.5%
Percentage of population below poverty level:
| Clearpointe: | 23.6% |
| Vallejo: | 11.2% |
Median year owner moved in (as recorded in 2022):
Median year renter moved in (as recorded in 2022):
| Clearpointe: | 2006 |
| Vallejo: | 2011 |
Median year renter moved in (as recorded in 2022):
| Clearpointe: | 2016 |
| Vallejo: | 2019 |
Percentage of married-couple families with both working:
| Clearpointe: | 71.8% |
| Vallejo: | 57.4% |
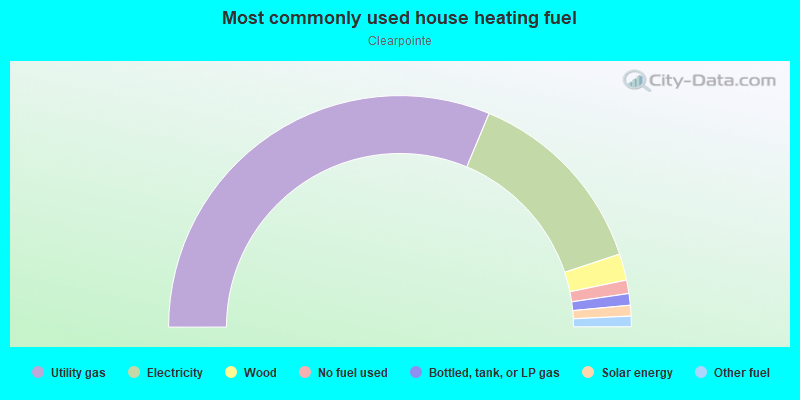
- 62.6%Utility gas
- 27.2%Electricity
- 3.7%Wood
- 1.9%No fuel used
- 1.6%Bottled, tank, or LP gas
- 1.5%Solar energy
- 1.5%Other fuel
Roads and streets:
Clearpointe Dr
Length: 0.33 miles
Directions: E-W, SE-NW
Address range: 200 to 399
Directions: E-W, SE-NW
Address range: 200 to 399
del Sur St
Length: 0.14 miles
Directions: E-W, N-S, SE-NW, SW-NE
Address range: 1 to 106
Directions: E-W, N-S, SE-NW, SW-NE
Address range: 1 to 106
Swanzy Ct
Length: 0.05 miles
Direction: SE-NW
Address range: 1 to 199
Direction: SE-NW
Address range: 1 to 199