Clayton South neighborhood in San Jose, California (CA), 95127, 95148 detailed profile
Settings
X


Business Search - 14 Million verified businesses
Area: 0.102 square miles
Population: 312
Population density:
| Clayton South: | 3,054 people per square mile |
| San Jose: | 5,554 people per square mile |

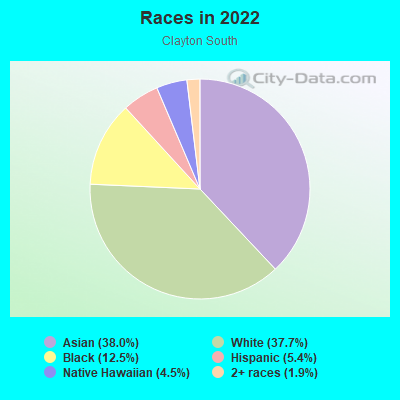
- 11938.0%Asian
- 11837.7%White
- 3912.5%Black
- 175.4%Hispanic or Latino
- 144.5%Native Hawaiian and Other
Pacific Islander - 61.9%Two or more races

Median household income in 2022:
| Clayton South: | $156,957 |
| San Jose: | $133,835 |
Distribution of median household income
![Distribution of median household income]()
- 1Less than $10,000
- 1$10,000 to $19,999
- 13$20,000 to $29,999
- 9$30,000 to $39,999
- 1$40,000 to $49,999
- 1$50,000 to $59,999
- 8$60,000 to $74,999
- 2$75,000 to $99,999
- 34$100,000 to $124,999
- 11$125,000 to $149,999
- 14$150,000 to $199,999
- 38$200,000 or more

Distribution of owner-occupied house/condo value
![Distribution of owner-occupied house/condo value]()
- 7Less than $50,000
- 7$50,000 to $99,999
- 1$100,000 to $149,999
- 10$200,000 to $249,999
- 1$250,000 to $299,999
- 4$300,000 to $399,999
- 23$500,000 to $749,999
- 69$750,000 to $999,999
- 24$1,000,000 or more

Distribution of rent paid by renters
![Distribution of rent paid by renters]()
- 1Less than $100
- 1$100 to $199
- 1$200 to $299
- 1$500 to $599
- 1$600 to $699
- 16$1,000 to $1,249
- 1$1,250 to $1,499
- 1$1,500 to $1,999
- 11$2,000 or more

| Males: | 169 |
| Females: | 143 |
Males:
| This neighborhood: | 37.4 years |
| Whole city: | 37.6 years |
| This neighborhood: | 42.4 years |
| Whole city: | 39.1 years |
Average household size:
| Clayton South: | 3.7 people |
| San Jose: | 2.9 people |
Percentage of family households:
| Clayton South: | 39.6% |
| San Jose: | 49.9% |
| Here: | 43.5% |
| San Jose: | 53.0% |
Percentage of married-couple families with children (among all households):
| Clayton South: | 33.7% |
| San Jose: | 25.8% |
Percentage of single-mother households (among all households):
| Clayton South: | 1.7% |
| San Jose: | 5.2% |
Percentage of never married males 15 years old and over:
Percentage of never married females 15 years old and over:
| Clayton South: | 18.8% |
| San Jose: | 20.9% |
Percentage of never married females 15 years old and over:
| Clayton South: | 13.9% |
| city: | 16.7% |
Percentage of people that speak English not well or not at all:
| Clayton South: | 5.0% |
| San Jose: | 11.4% |
Percentage of people born in this state:
Percentage of people born in another U.S. state:
Percentage of native residents but born outside the U.S.:
Percentage of foreign born residents:
| Here: | 57.4% |
| San Jose: | 46.1% |
Percentage of people born in another U.S. state:
| Clayton South: | 11.0% |
| San Jose: | 10.4% |
Percentage of native residents but born outside the U.S.:
| Here: | 1.2% |
| city: | 1.7% |
Percentage of foreign born residents:
| Here: | 30.4% |
| San Jose: | 41.8% |
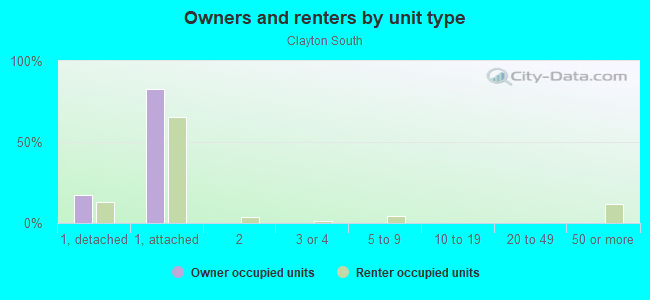
Owner-occupied
Renter-occupied

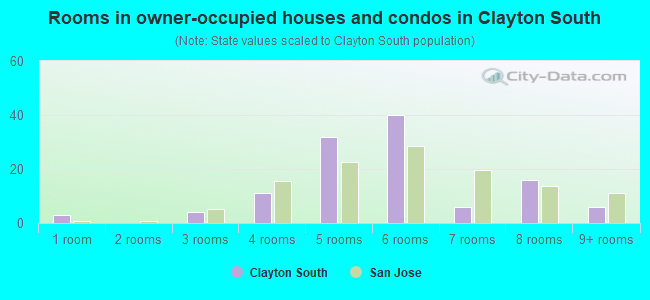
- Rooms in owner-occupied houses and condos in Clayton South
- 31 room
- 02 rooms
- 43 rooms
- 114 rooms
- 325 rooms
- 406 rooms
- 67 rooms
- 168 rooms
- 69+ rooms
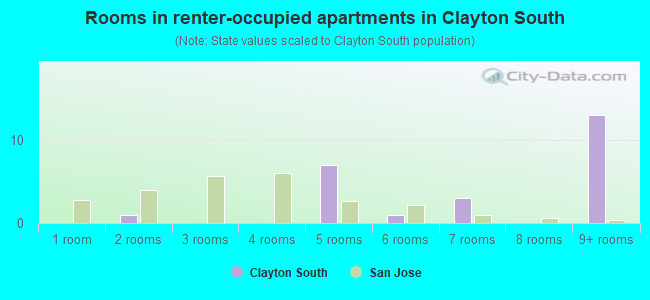
- Rooms in renter-occupied apartments in Clayton South
- 01 room
- 12 rooms
- 03 rooms
- 04 rooms
- 75 rooms
- 16 rooms
- 37 rooms
- 08 rooms
- 139+ rooms
Owner-occupied
Renter-occupied
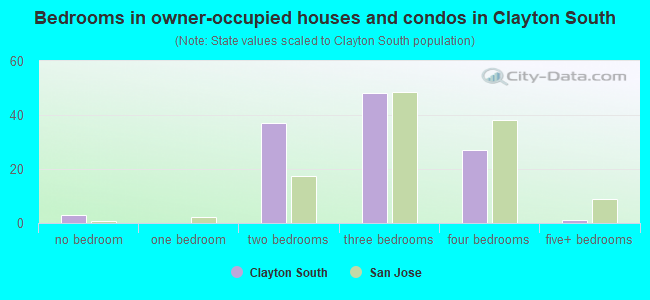
- Bedrooms in owner-occupied houses and condos in Clayton South
- 3no bedroom
- 01 bedroom
- 372 bedrooms
- 483 bedrooms
- 274 bedrooms
- 15+ bedrooms
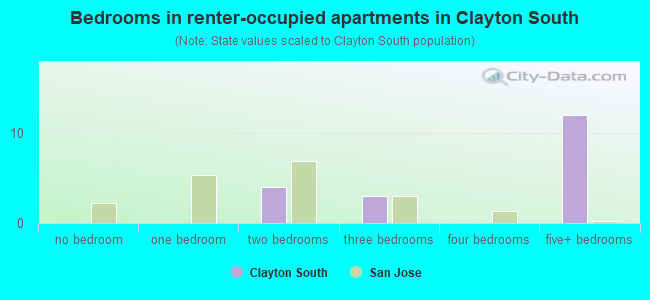
- Bedrooms in renter-occupied apartments in Clayton South
- 0no bedroom
- 01 bedroom
- 42 bedrooms
- 33 bedrooms
- 04 bedrooms
- 125+ bedrooms
Average number of cars or other vehicles available in houses/condos:
Average number of cars or other vehicles available in apartments:
| This neighborhood: | 0.3 |
| San Jose: | 2.3 |
Average number of cars or other vehicles available in apartments:
| Here: | 0.9 |
| city: | 1.6 |
Percentage of units with a mortgage:
| Clayton South: | 69.3% |
| San Jose: | 66.9% |
Housing prices:
- Average estimated value of detached houses in 2022 (16.5% of all units):
Clayton South: $1,992,957 San Jose: $1,532,815
- Average estimated value of townhouses or other attached units in 2022 (83.5% of all units):
This neighborhood: $658,536 city: $1,024,857
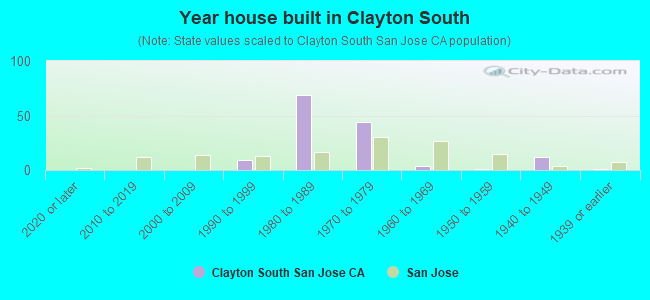
- Year house built in Clayton South
- 02020 or later
- 02010 to 2019
- 02000 to 2009
- 91990 to 1999
- 691980 to 1989
- 441970 to 1979
- 41960 to 1969
- 11950 to 1959
- 121940 to 1949
- 11939 or earlier
City-data.com crime index for city in 2020 (higher means more crime):
| City: | 268.4 |
| U.S. average: | 219.5 |
Travel time to work (commute)
![Travel time to work (commute)]()
- 35 to 9 minutes
- 310 to 14 minutes
- 2715 to 19 minutes
- 2520 to 24 minutes
- 1625 to 29 minutes
- 4330 to 34 minutes
- 935 to 39 minutes
- 1040 to 44 minutes
- 1245 to 59 minutes
- 960 to 89 minutes
- 490 or more minutes

Means of transportation to work
![Means of transportation to work]()
- 82.6%121Drove a car alone
- 2.0%3Carpooled
- 2.7%4Long-distance train or commuter rail
- 2.0%3Other means
- 11.6%17Worked at home

Time leaving home to go to work
![Time leaving home to go to work]()
- 612:00 a.m. to 4:59 a.m.
- 35:00 a.m. to 5:29 a.m.
- 115:30 a.m. to 5:59 a.m.
- 56:00 a.m. to 6:29 a.m.
- 206:30 a.m. to 6:59 a.m.
- 267:00 a.m. to 7:29 a.m.
- 177:30 a.m. to 7:59 a.m.
- 298:00 a.m. to 8:29 a.m.
- 68:30 a.m. to 8:59 a.m.
- 99:00 a.m. to 9:59 a.m.
- 710:00 a.m. to 10:59 a.m.
- 111:00 a.m. to 11:59 a.m.
- 1412:00 p.m. to 3:59 p.m.
- 24:00 p.m. to 11:59 p.m.

Occupations of males:
- Percentage of males in management occupations (except farmers):
Here: 16.7% city: 13.0%
- Percentage of males in computer and mathematical occupations:
Here: 23.4% city: 13.6%
- Percentage of males in architecture and engineering occupations:
Here: 24.3% city: 10.2%
- Percentage of males in arts, design, entertainment, sports, and media occupations:
Here: 8.2% city: 1.8%
- Percentage of males in sales and office occupations:
Here: 5.1% city: 12.8%
- Percentage of males in construction, extraction, and maintenance occupations:
Here: 8.7% city: 7.8%
Occupations of females:
- Percentage of females in management occupations (except farmers):
Here: 5.3% city: 11.0%
- Percentage of females in business and financial operations occupations:
Here: 18.1% city: 8.6%
- Percentage of females in computer and mathematical occupations:
Here: 10.4% city: 5.4%
- Percentage of females in education, training, and library occupations:
Here: 6.3% city: 8.1%
- Percentage of females in service occupations:
Here: 39.4% city: 21.7%
- Percentage of females in sales and office occupations:
Here: 19.6% city: 22.0%
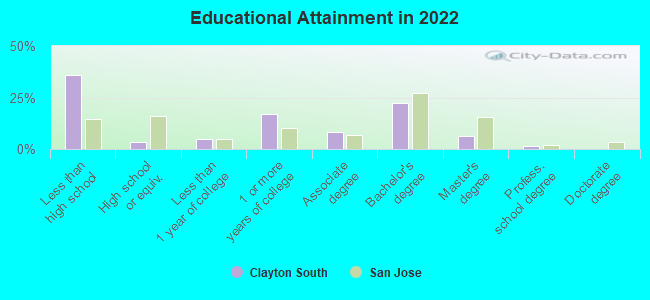
Education in this neighborhood (subdivision or community):
- Percentage of people 3 years and older in K-12 schools:
Clayton South: 10.4% San Jose: 16.1%
- Percentage of people 3 years and older in undergraduate colleges:
Clayton South: 1.4% San Jose: 6.5%
- Percentage of people 3 years and older in grad. or professional schools:
Clayton South: 1.4% San Jose: 2.0%
- Percentage of students K-12 enrolled in private schools:
Clayton South: 0.0% San Jose: 14.9%
Percentage of population below poverty level:
| Clayton South: | 2.8% |
| San Jose: | 9.0% |
Median year owner moved in (as recorded in 2022):
| Clayton South: | 2005 |
| San Jose: | 2008 |
Percentage of married-couple families with both working:
| Clayton South: | 30.1% |
| San Jose: | 72.5% |
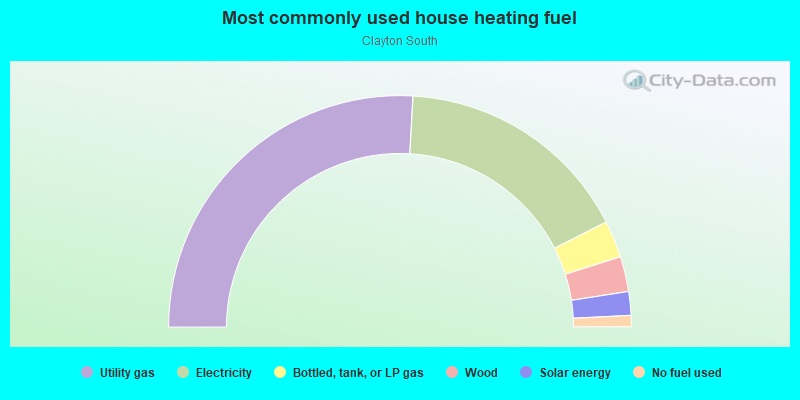
- 51.8%Utility gas
- 33.2%Electricity
- 5.2%Bottled, tank, or LP gas
- 4.9%Wood
- 3.3%Solar energy
- 1.6%No fuel used
Roads and streets:
Clayton Rd
Length: 0.63 miles
Directions: E-W, SE-NW
Address range: 1580 to 11953
Directions: E-W, SE-NW
Address range: 1580 to 11953
Columbine Dr
Length: 0.44 miles
Direction: E-W
Address range: 3500 to 3599
Direction: E-W
Address range: 3500 to 3599
Fall Ave
Length: 0.22 miles
Directions: E-W, N-S, SW-NE
Address range: 1500 to 1599
Directions: E-W, N-S, SW-NE
Address range: 1500 to 1599
Oakleaf Dr
Length: 0.20 miles
Directions: E-W, N-S, SE-NW
Address range: 3500 to 3599
Directions: E-W, N-S, SE-NW
Address range: 3500 to 3599
Mount Pleasant Rd
Length: 0.15 miles
Direction: N-S
Address range: 1500 to 1598
Direction: N-S
Address range: 1500 to 1598
Marten Ave
Length: 0.05 miles
Direction: N-S
Address range: 3550 to 3599
Direction: N-S
Address range: 3550 to 3599
Osprey Ct
Length: 0.05 miles
Direction: N-S
Address range: 1500 to 1599
Direction: N-S
Address range: 1500 to 1599