Clark Park neighborhood in Tempe, Arizona (AZ), 85281 detailed profile
Settings
X


Business Search - 14 Million verified businesses
Area: 0.125 square miles
Population: 559
Population density:
| Clark Park: | 4,472 people per square mile |
| Tempe: | 4,641 people per square mile |

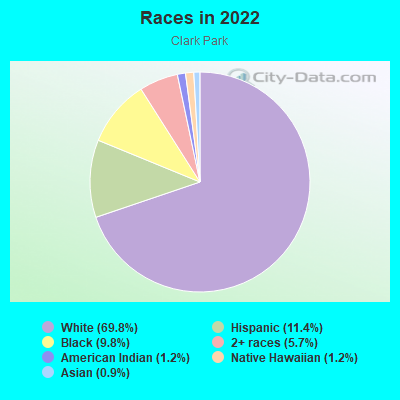
- 39369.8%White
- 6411.4%Hispanic or Latino
- 559.8%Black
- 325.7%Two or more races
- 71.2%American Indian
- 71.2%Native Hawaiian and Other
Pacific Islander - 50.9%Asian
Median household income in 2022:
| Clark Park: | $65,125 |
| Tempe: | $76,007 |
Distribution of median household income
![Distribution of median household income]()
- 16Less than $10,000
- 8$10,000 to $19,999
- 50$20,000 to $29,999
- 37$30,000 to $39,999
- 18$40,000 to $49,999
- 67$50,000 to $59,999
- 42$60,000 to $74,999
- 38$75,000 to $99,999
- 38$100,000 to $124,999
- 7$125,000 to $149,999
- 17$150,000 to $199,999
- 14$200,000 or more

Distribution of owner-occupied house/condo value
![Distribution of owner-occupied house/condo value]()
- 11Less than $50,000
- 3$150,000 to $199,999
- 8$200,000 to $249,999
- 9$250,000 to $299,999
- 48$300,000 to $399,999
- 21$400,000 to $499,999
- 17$500,000 to $749,999

Distribution of rent paid by renters
![Distribution of rent paid by renters]()
- 5$500 to $599
- 6$600 to $699
- 10$700 to $799
- 18$800 to $899
- 35$900 to $999
- 107$1,000 to $1,249
- 24$1,250 to $1,499
- 14$1,500 to $1,999
- 13$2,000 or more

Median rent in 2022:
| Clark Park: | $1,104 |
| Tempe: | $1,566 |
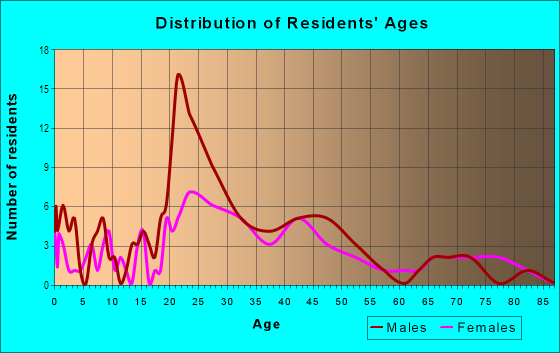
| Males: | 348 |
| Females: | 211 |
Males:
| This neighborhood: | 31.9 years |
| Whole city: | 28.9 years |
| This neighborhood: | 22.7 years |
| Whole city: | 30.5 years |
Average household size:
| Clark Park: | 2.1 people |
| Tempe: | 2.3 people |
Percentage of family households:
| Clark Park: | 9.2% |
| Tempe: | 36.3% |
| Here: | 2.5% |
| Tempe: | 32.6% |
Percentage of married-couple families with children (among all households):
| Clark Park: | 13.7% |
| Tempe: | 26.9% |
Percentage of single-mother households (among all households):
| Clark Park: | 33.5% |
| Tempe: | 8.3% |
Percentage of never married males 15 years old and over:
Percentage of never married females 15 years old and over:
| Clark Park: | 39.2% |
| Tempe: | 32.9% |
Percentage of never married females 15 years old and over:
| Clark Park: | 28.4% |
| city: | 21.7% |
Percentage of people that speak English not well or not at all:
| Clark Park: | 0.9% |
| Tempe: | 2.0% |
Percentage of people born in this state:
Percentage of people born in another U.S. state:
Percentage of native residents but born outside the U.S.:
Percentage of foreign born residents:
| Here: | 44.4% |
| Tempe: | 39.3% |
Percentage of people born in another U.S. state:
| Clark Park: | 43.5% |
| Tempe: | 46.0% |
Percentage of native residents but born outside the U.S.:
| Here: | 2.2% |
| city: | 1.8% |
Percentage of foreign born residents:
| Here: | 9.9% |
| Tempe: | 12.9% |
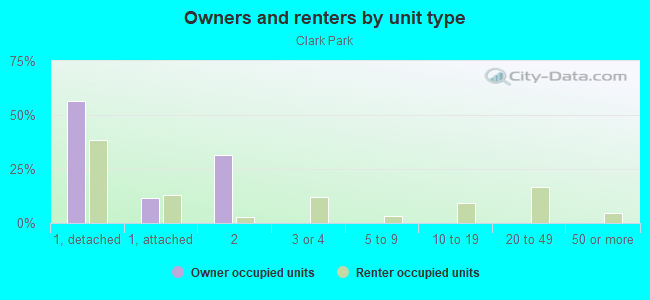
Owner-occupied
Renter-occupied

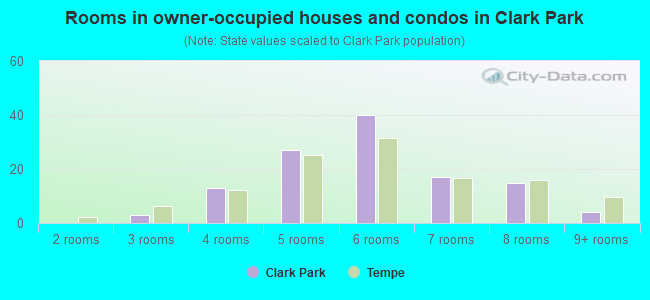
- Rooms in owner-occupied houses and condos in Clark Park
- 01 room
- 02 rooms
- 33 rooms
- 134 rooms
- 275 rooms
- 406 rooms
- 177 rooms
- 158 rooms
- 49+ rooms
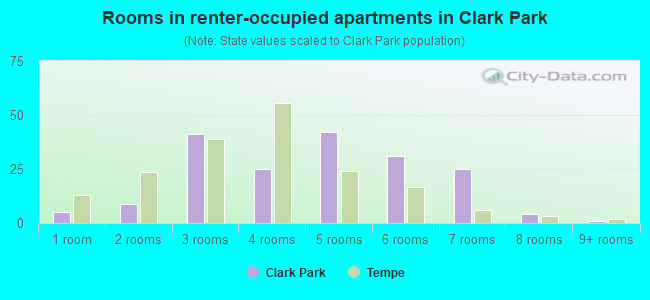
- Rooms in renter-occupied apartments in Clark Park
- 51 room
- 92 rooms
- 413 rooms
- 254 rooms
- 425 rooms
- 316 rooms
- 257 rooms
- 48 rooms
- 19+ rooms
Owner-occupied
Renter-occupied
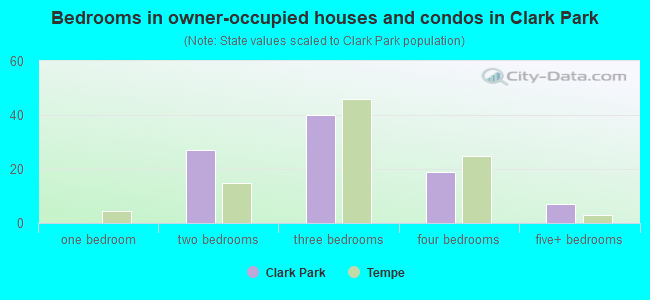
- Bedrooms in owner-occupied houses and condos in Clark Park
- 0no bedroom
- 01 bedroom
- 272 bedrooms
- 403 bedrooms
- 194 bedrooms
- 75+ bedrooms
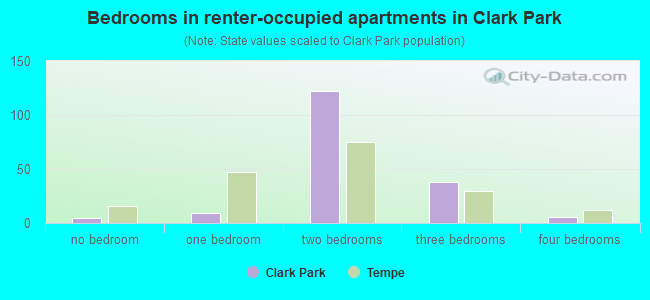
- Bedrooms in renter-occupied apartments in Clark Park
- 5no bedroom
- 91 bedroom
- 1222 bedrooms
- 383 bedrooms
- 64 bedrooms
- 05+ bedrooms
Average number of cars or other vehicles available in houses/condos:
Average number of cars or other vehicles available in apartments:
| This neighborhood: | 1.5 |
| Tempe: | 2.0 |
Average number of cars or other vehicles available in apartments:
| Here: | 1.8 |
| city: | 1.6 |
Percentage of units with a mortgage:
| Clark Park: | 54.7% |
| Tempe: | 69.2% |
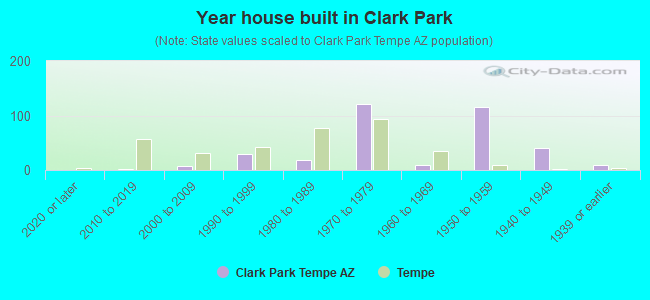
- Year house built in Clark Park
- 02020 or later
- 12010 to 2019
- 82000 to 2009
- 301990 to 1999
- 181980 to 1989
- 1211970 to 1979
- 101960 to 1969
- 1161950 to 1959
- 411940 to 1949
- 101939 or earlier
City-data.com crime index for city in 2020 (higher means more crime):
| City: | 347.1 |
| U.S. average: | 219.5 |
Travel time to work (commute)
![Travel time to work (commute)]()
- 5Less than 5 minutes
- 565 to 9 minutes
- 4410 to 14 minutes
- 7415 to 19 minutes
- 8720 to 24 minutes
- 5125 to 29 minutes
- 3930 to 34 minutes
- 935 to 39 minutes
- 540 to 44 minutes
- 1645 to 59 minutes
- 660 to 89 minutes
- 890 or more minutes

Means of transportation to work
![Means of transportation to work]()
- 63.1%193Drove a car alone
- 4.6%14Carpooled
- 5.2%16Bus
- 1.0%3Motorcycle
- 5.2%16Bicycle
- 4.6%14Walked
- 1.3%4Other means
- 21.3%65Worked at home

Time leaving home to go to work
![Time leaving home to go to work]()
- 1712:00 a.m. to 4:59 a.m.
- 55:00 a.m. to 5:29 a.m.
- 285:30 a.m. to 5:59 a.m.
- 276:00 a.m. to 6:29 a.m.
- 106:30 a.m. to 6:59 a.m.
- 777:00 a.m. to 7:29 a.m.
- 417:30 a.m. to 7:59 a.m.
- 248:00 a.m. to 8:29 a.m.
- 448:30 a.m. to 8:59 a.m.
- 329:00 a.m. to 9:59 a.m.
- 1010:00 a.m. to 10:59 a.m.
- 1211:00 a.m. to 11:59 a.m.
- 3312:00 p.m. to 3:59 p.m.
- 294:00 p.m. to 11:59 p.m.

Occupations of males:
- Percentage of males in management occupations (except farmers):
Here: 16.8% city: 10.2%
- Percentage of males in business and financial operations occupations:
Here: 9.3% city: 6.5%
- Percentage of males in computer and mathematical occupations:
Here: 2.7% city: 8.4%
- Percentage of males in architecture and engineering occupations:
Here: 9.5% city: 5.0%
- Percentage of males in life, physical, and social science occupations:
Here: 14.3% city: 1.9%
- Percentage of males in education, training, and library occupations:
Here: 10.4% city: 6.1%
- Percentage of males in arts, design, entertainment, sports, and media occupations:
Here: 8.6% city: 2.8%
- Percentage of males in healthcare practitioners and technical occupations:
Here: 2.0% city: 2.8%
- Percentage of males in service occupations:
Here: 4.8% city: 14.4%
- Percentage of males in sales and office occupations:
Here: 5.2% city: 19.0%
- Percentage of males in construction, extraction, and maintenance occupations:
Here: 20.4% city: 5.1%
- Percentage of males in production occupations:
Here: 17.3% city: 4.4%
- Percentage of males in transportation occupations:
Here: 2.7% city: 3.9%
- Percentage of males in material moving occupations:
Here: 6.6% city: 3.5%
Occupations of females:
- Percentage of females in management occupations (except farmers):
Here: 4.8% city: 7.5%
- Percentage of females in business and financial operations occupations:
Here: 18.1% city: 9.3%
- Percentage of females in computer and mathematical occupations:
Here: 3.7% city: 3.3%
- Percentage of females in life, physical, and social science occupations:
Here: 15.6% city: 1.5%
- Percentage of females in community and social services occupations:
Here: 4.6% city: 3.4%
- Percentage of females in legal occupations:
Here: 3.7% city: 1.4%
- Percentage of females in education, training, and library occupations:
Here: 15.6% city: 12.0%
- Percentage of females in arts, design, entertainment, sports, and media occupations:
Here: 3.7% city: 3.1%
- Percentage of females in healthcare practitioners and technical occupations:
Here: 1.9% city: 7.4%
- Percentage of females in service occupations:
Here: 38.9% city: 18.9%
- Percentage of females in sales and office occupations:
Here: 17.8% city: 26.9%
- Percentage of females in material moving occupations:
Here: 1.2% city: 1.4%
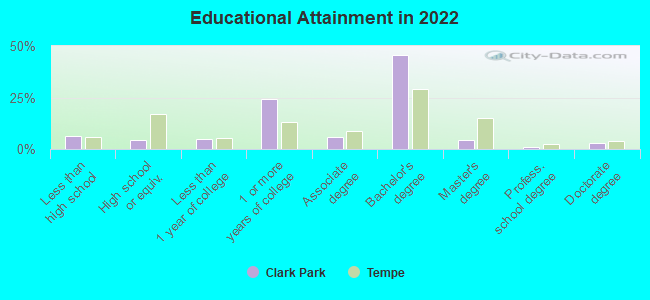
Education in this neighborhood (subdivision or community):
- Percentage of people 3 years and older in K-12 schools:
Clark Park: 12.6% Tempe: 12.5%
- Percentage of people 3 years and older in undergraduate colleges:
Clark Park: 16.8% Tempe: 15.4%
- Percentage of people 3 years and older in grad. or professional schools:
Clark Park: 9.7% Tempe: 6.3%
- Percentage of students K-12 enrolled in private schools:
Clark Park: 15.9% Tempe: 9.2%
Percentage of population below poverty level:
| Clark Park: | 20.2% |
| Tempe: | 15.0% |
Median year owner moved in (as recorded in 2022):
Median year renter moved in (as recorded in 2022):
| Clark Park: | 2003 |
| Tempe: | 2013 |
Median year renter moved in (as recorded in 2022):
| Clark Park: | 2019 |
| Tempe: | 2022 |
Percentage of married-couple families with both working:
| Clark Park: | 274.8% |
| Tempe: | 77.6% |
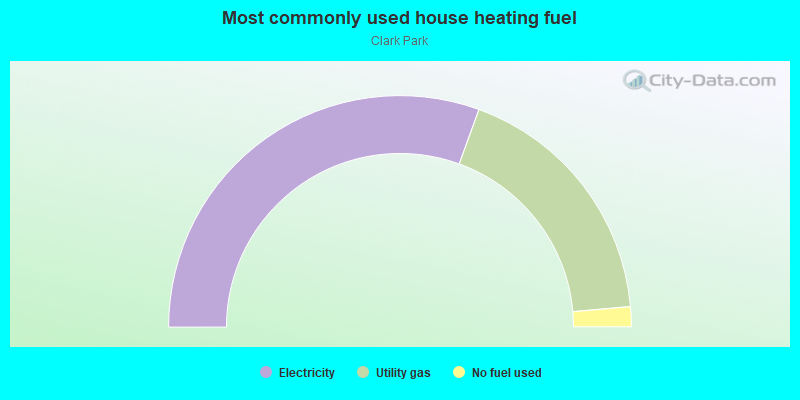
- 61.1%Electricity
- 36.1%Utility gas
- 2.8%No fuel used
Roads and streets:
S Farmer Ave
Length: 0.46 miles
Directions: E-W, N-S, SE-NW
Address range: 1400 to 1999
Directions: E-W, N-S, SE-NW
Address range: 1400 to 1999
W 14th St
Length: 0.10 miles
Direction: E-W
Address range: 300 to 420
Direction: E-W
Address range: 300 to 420
S Wilson St
Length: 0.10 miles
Directions: N-S, SW-NE
Address range: 1400 to 1599
Directions: N-S, SW-NE
Address range: 1400 to 1599
W Parkway Blvd
Length: 0.06 miles
Direction: E-W
Address range: 400 to 499
Direction: E-W
Address range: 400 to 499
W Broadway Rd
Length: 0.03 miles
Direction: E-W
Address range: 264 to 299
Direction: E-W
Address range: 264 to 299
Railroad features:
Southern Pacific RR
Length: 0.45 miles
Direction: N-S
Direction: N-S