Civic Center neighborhood in Westminster, California (CA), 92683 detailed profile
Settings
X


Business Search - 14 Million verified businesses
Area: 0.219 square miles
Population: 2,574
Population density:
| Civic Center: | 11,730 people per square mile |
| Westminster: | 8,842 people per square mile |

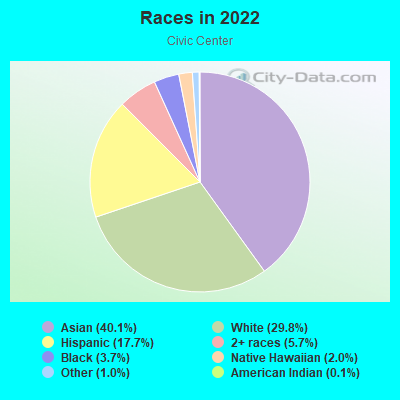
- 1,50455.3%Asian
- 78829.0%Hispanic or Latino
- 2057.5%White
- 1214.5%Native Hawaiian and Other
Pacific Islander - 381.4%Two or more races
- 271.0%American Indian
- 240.9%Some other race
- 120.4%Black
Median household income in 2022:
| Civic Center: | $66,380 |
| Westminster: | $85,229 |
Distribution of median household income
![Distribution of median household income]()
- 91Less than $10,000
- 119$10,000 to $19,999
- 158$20,000 to $29,999
- 123$30,000 to $39,999
- 59$40,000 to $49,999
- 39$50,000 to $59,999
- 97$60,000 to $74,999
- 68$75,000 to $99,999
- 25$100,000 to $124,999
- 47$125,000 to $149,999
- 42$150,000 to $199,999
- 31$200,000 or more

Distribution of owner-occupied house/condo value
![Distribution of owner-occupied house/condo value]()
- 135Less than $50,000
- 79$50,000 to $99,999
- 41$100,000 to $149,999
- 11$150,000 to $199,999
- 9$200,000 to $249,999
- 13$250,000 to $299,999
- 16$300,000 to $399,999
- 15$400,000 to $499,999
- 56$500,000 to $749,999
- 42$750,000 to $999,999
- 45$1,000,000 or more

Distribution of rent paid by renters
![Distribution of rent paid by renters]()
- 11Less than $100
- 13$100 to $199
- 93$200 to $299
- 29$300 to $399
- 71$400 to $499
- 53$500 to $599
- 11$600 to $699
- 22$700 to $799
- 22$800 to $899
- 8$900 to $999
- 125$1,000 to $1,249
- 99$1,250 to $1,499
- 137$1,500 to $1,999
- 114$2,000 or more

Median rent in 2022:
| Civic Center: | $1,334 |
| Westminster: | $1,943 |
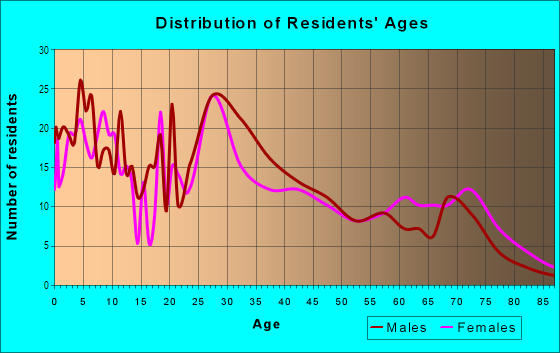
| Males: | 1,284 |
| Females: | 1,290 |
Males:
| This neighborhood: | 39.4 years |
| Whole city: | 47.3 years |
| This neighborhood: | 41.6 years |
| Whole city: | 47.8 years |
Average household size:
| Civic Center: | 3.7 people |
| Westminster: | 3.1 people |
Percentage of family households:
| Civic Center: | 40.4% |
| Westminster: | 40.1% |
| Here: | 46.8% |
| Westminster: | 56.1% |
Percentage of married-couple families with children (among all households):
| Civic Center: | 26.5% |
| Westminster: | 26.2% |
Percentage of single-mother households (among all households):
| Civic Center: | 6.2% |
| Westminster: | 4.3% |
Percentage of never married males 15 years old and over:
Percentage of never married females 15 years old and over:
| Civic Center: | 14.0% |
| Westminster: | 19.9% |
Percentage of never married females 15 years old and over:
| Civic Center: | 14.9% |
| city: | 13.4% |
Percentage of people that speak English not well or not at all:
| Civic Center: | 40.0% |
| Westminster: | 21.1% |
Percentage of people born in this state:
Percentage of people born in another U.S. state:
Percentage of native residents but born outside the U.S.:
Percentage of foreign born residents:
| Here: | 34.1% |
| Westminster: | 43.9% |
Percentage of people born in another U.S. state:
| Civic Center: | 4.6% |
| Westminster: | 8.2% |
Percentage of native residents but born outside the U.S.:
| Here: | 1.2% |
| city: | 0.9% |
Percentage of foreign born residents:
| Here: | 60.1% |
| Westminster: | 47.0% |
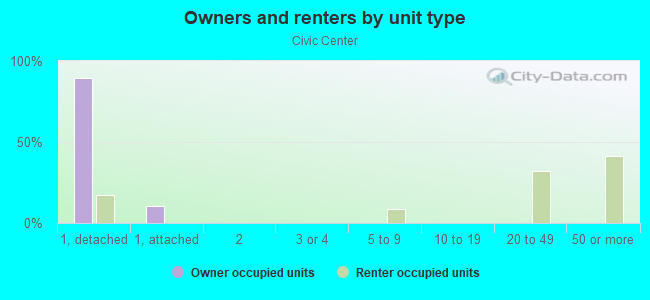
Owner-occupied
Renter-occupied

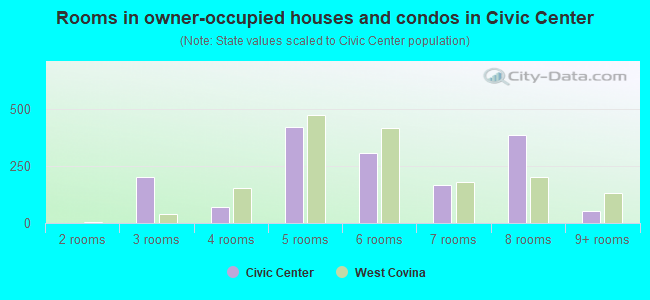
- Rooms in owner-occupied houses and condos in Civic Center
- 01 room
- 222 rooms
- 253 rooms
- 354 rooms
- 775 rooms
- 526 rooms
- 207 rooms
- 208 rooms
- 279+ rooms
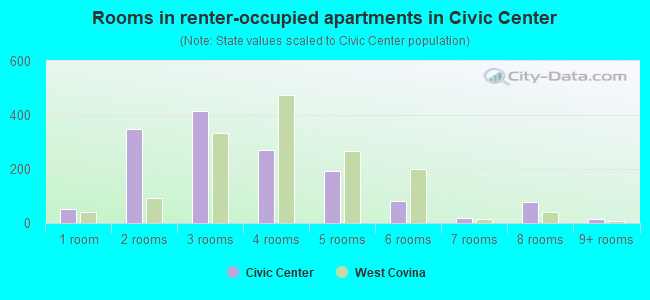
- Rooms in renter-occupied apartments in Civic Center
- 1311 room
- 1252 rooms
- 1733 rooms
- 1224 rooms
- 545 rooms
- 336 rooms
- 187 rooms
- 158 rooms
- 59+ rooms
Owner-occupied
Renter-occupied
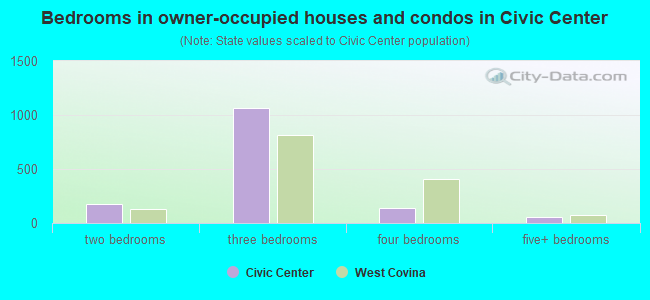
- Bedrooms in owner-occupied houses and condos in Civic Center
- 0no bedroom
- 201 bedroom
- 522 bedrooms
- 1043 bedrooms
- 554 bedrooms
- 185+ bedrooms
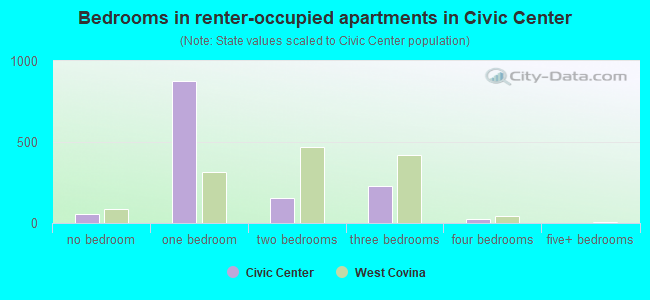
- Bedrooms in renter-occupied apartments in Civic Center
- 143no bedroom
- 2711 bedroom
- 1362 bedrooms
- 883 bedrooms
- 554 bedrooms
- 55+ bedrooms
Average number of cars or other vehicles available in houses/condos:
Average number of cars or other vehicles available in apartments:
| This neighborhood: | 2.3 |
| Westminster: | 2.4 |
Average number of cars or other vehicles available in apartments:
| Here: | 1.5 |
| city: | 2.0 |
Percentage of units with a mortgage:
| Civic Center: | 55.9% |
| Westminster: | 58.7% |
Average estimated value of detached houses in 2022 (19.4% of all units):
| Civic Center: | $701,425 |
| California: | $988,808 |
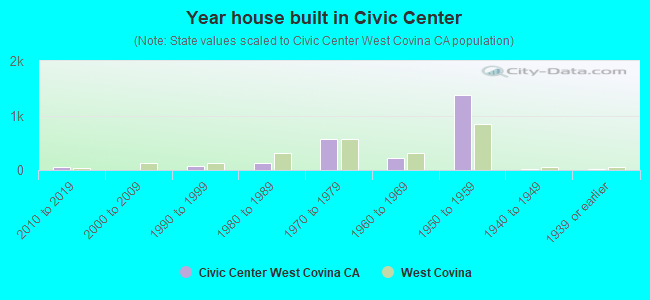
- Year house built in Civic Center
- 02020 or later
- 262010 to 2019
- 842000 to 2009
- 2161990 to 1999
- 851980 to 1989
- 1441970 to 1979
- 1831960 to 1969
- 831950 to 1959
- 541940 to 1949
- 621939 or earlier
City-data.com crime index for city in 2020 (higher means more crime):
| City: | 228.8 |
| U.S. average: | 219.5 |
Travel time to work (commute)
![Travel time to work (commute)]()
- 18Less than 5 minutes
- 765 to 9 minutes
- 16610 to 14 minutes
- 20315 to 19 minutes
- 17620 to 24 minutes
- 12925 to 29 minutes
- 26030 to 34 minutes
- 1435 to 39 minutes
- 4240 to 44 minutes
- 7545 to 59 minutes
- 4160 to 89 minutes
- 590 or more minutes

Means of transportation to work
![Means of transportation to work]()
- 68.4%773Drove a car alone
- 14.0%158Carpooled
- 3.8%43Bus
- 1.9%21Long-distance train or commuter rail
- 1.1%12Motorcycle
- 0.6%7Bicycle
- 4.7%53Walked
- 6.5%74Other means
- 4.2%47Worked at home

Time leaving home to go to work
![Time leaving home to go to work]()
- 8112:00 a.m. to 4:59 a.m.
- 475:00 a.m. to 5:29 a.m.
- 625:30 a.m. to 5:59 a.m.
- 756:00 a.m. to 6:29 a.m.
- 956:30 a.m. to 6:59 a.m.
- 1277:00 a.m. to 7:29 a.m.
- 597:30 a.m. to 7:59 a.m.
- 1828:00 a.m. to 8:29 a.m.
- 548:30 a.m. to 8:59 a.m.
- 1319:00 a.m. to 9:59 a.m.
- 3110:00 a.m. to 10:59 a.m.
- 1411:00 a.m. to 11:59 a.m.
- 9012:00 p.m. to 3:59 p.m.
- 1924:00 p.m. to 11:59 p.m.

Occupations of males:
- Percentage of males in management occupations (except farmers):
Here: 1.5% city: 9.1%
- Percentage of males in business and financial operations occupations:
Here: 2.2% city: 3.9%
- Percentage of males in computer and mathematical occupations:
Here: 3.0% city: 6.2%
- Percentage of males in architecture and engineering occupations:
Here: 3.0% city: 5.0%
- Percentage of males in community and social services occupations:
Here: 2.0% city: 0.6%
- Percentage of males in legal occupations:
Here: 1.7% city: 0.1%
- Percentage of males in education, training, and library occupations:
Here: 2.8% city: 2.6%
- Percentage of males in healthcare practitioners and technical occupations:
Here: 1.9% city: 4.1%
- Percentage of males in service occupations:
Here: 13.7% city: 15.7%
- Percentage of males in sales and office occupations:
Here: 19.2% city: 15.7%
- Percentage of males in construction, extraction, and maintenance occupations:
Here: 9.3% city: 8.2%
- Percentage of males in production occupations:
Here: 26.1% city: 12.5%
- Percentage of males in transportation occupations:
Here: 3.1% city: 4.7%
Occupations of females:
- Percentage of females in life, physical, and social science occupations:
Here: 2.0% city: 1.5%
- Percentage of females in education, training, and library occupations:
Here: 1.9% city: 7.1%
- Percentage of females in healthcare practitioners and technical occupations:
Here: 4.6% city: 8.2%
- Percentage of females in service occupations:
Here: 44.5% city: 27.5%
- Percentage of females in sales and office occupations:
Here: 29.1% city: 26.1%
- Percentage of females in production occupations:
Here: 4.5% city: 6.2%
- Percentage of females in material moving occupations:
Here: 10.6% city: 2.3%
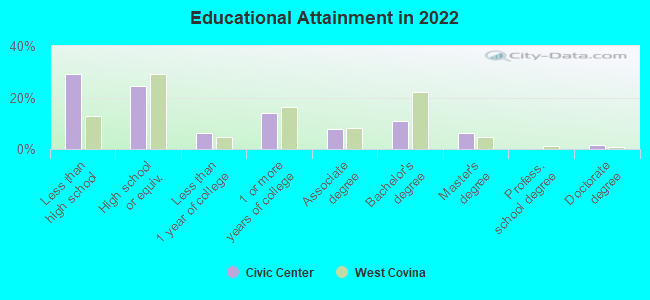
Education in this neighborhood (subdivision or community):
- Percentage of people 3 years and older in K-12 schools:
Civic Center: 19.8% Westminster: 16.2%
- Percentage of people 3 years and older in undergraduate colleges:
Civic Center: 5.6% Westminster: 7.5%
- Percentage of people 3 years and older in grad. or professional schools:
Civic Center: 1.2% Westminster: 1.1%
- Percentage of students K-12 enrolled in private schools:
Civic Center: 11.8% Westminster: 7.8%
Percentage of population below poverty level:
| Civic Center: | 16.4% |
| Westminster: | 13.4% |
Median year owner moved in (as recorded in 2022):
Median year renter moved in (as recorded in 2022):
| Civic Center: | 2005 |
| Westminster: | 2002 |
Median year renter moved in (as recorded in 2022):
| Civic Center: | 2013 |
| Westminster: | 2018 |
Percentage of married-couple families with both working:
| Civic Center: | 52.6% |
| Westminster: | 69.7% |
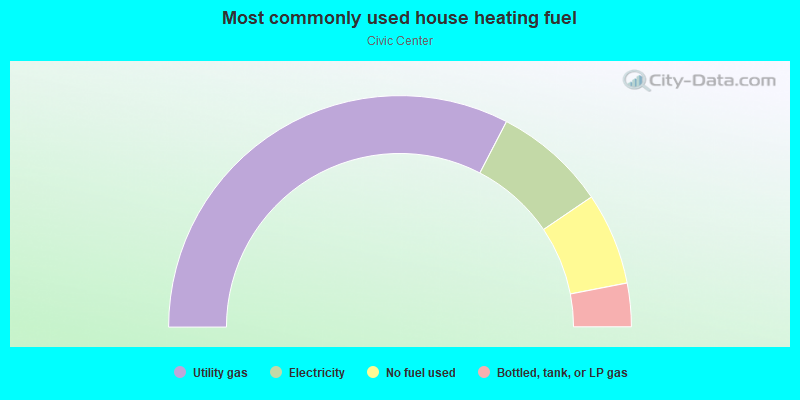
- 53.7%Utility gas
- 20.7%Electricity
- 20.5%No fuel used
- 3.8%Bottled, tank, or LP gas
- 1.2%Solar energy
Highways in this neighborhood:
State Hwy 39 (Beach Blvd)
Length: 0.35 miles
Direction: N-S
Address range: 14119 to 14449
Direction: N-S
Address range: 14119 to 14449
Roads and streets:
15th St
Length: 0.45 miles
Direction: E-W
Address range: 7986 to 8499
Direction: E-W
Address range: 7986 to 8499
Westminster Blvd
Length: 0.45 miles
Direction: E-W
Address range: 8130 to 8490
Direction: E-W
Address range: 8130 to 8490
Newland St
Length: 0.29 miles
Direction: N-S
Address range: 13948 to 14269
Direction: N-S
Address range: 13948 to 14269
13th St
Length: 0.28 miles
Directions: E-W, SW-NE
Address range: 8000 to 8199
Directions: E-W, SW-NE
Address range: 8000 to 8199
All American Way
Length: 0.25 miles
Directions: N-S, SW-NE
Directions: N-S, SW-NE
Weber Ave
Length: 0.13 miles
Direction: E-W
Direction: E-W
Jackson St
Length: 0.13 miles
Direction: N-S
Address range: 14000 to 14119
Direction: N-S
Address range: 14000 to 14119
16th St
Length: 0.10 miles
Direction: E-W
Address range: 8032 to 8129
Direction: E-W
Address range: 8032 to 8129
Riata St
Length: 0.08 miles
Direction: N-S
Address range: 14100 to 14221
Direction: N-S
Address range: 14100 to 14221
Middletown Ln
Length: 0.08 miles
Direction: E-W
Address range: 12351 to 14398
Direction: E-W
Address range: 12351 to 14398
Un Named Rd
Length: 0.06 miles
Direction: N-S
Direction: N-S
Sumi Ave
Length: 0.05 miles
Direction: N-S
Direction: N-S
Mariner Ln
Length: 0.04 miles
Direction: N-S
Address range: 14200 to 14357
Direction: N-S
Address range: 14200 to 14357
Oasis Ave
Length: 0.04 miles
Direction: E-W
Address range: 8500 to 8557
Direction: E-W
Address range: 8500 to 8557
Lily Ave
Length: 0.04 miles
Direction: E-W
Direction: E-W
Other features:
Westminster Channel (Flood Control)
Length: 0.37 miles
Directions: E-W, SW-NE
Directions: E-W, SW-NE