Civic Center neighborhood in La Palma, California (CA), 90623 detailed profile
Settings
X


Business Search - 14 Million verified businesses
Area: 0.062 square miles
Population: 397
Population density:
| Civic Center: | 6,408 people per square mile |
| La Palma: | 8,562 people per square mile |

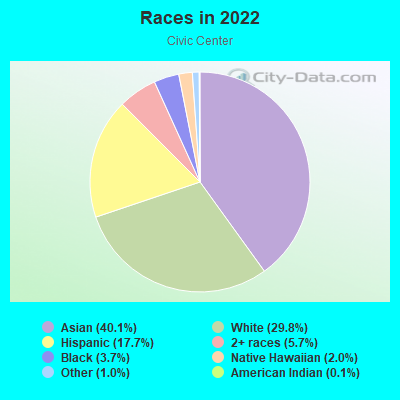
- 25564.7%Asian
- 6115.5%White
- 4511.4%Black
- 215.3%Hispanic or Latino
- 123.0%Two or more races
Median household income in 2022:
| Civic Center: | $119,681 |
| La Palma: | $113,398 |
Distribution of median household income
![Distribution of median household income]()
- 26Less than $10,000
- 4$10,000 to $19,999
- 6$20,000 to $29,999
- 10$30,000 to $39,999
- 10$40,000 to $49,999
- 5$50,000 to $59,999
- 9$60,000 to $74,999
- 5$75,000 to $99,999
- 14$100,000 to $124,999
- 12$125,000 to $149,999
- 8$150,000 to $199,999
- 46$200,000 or more

Distribution of owner-occupied house/condo value
![Distribution of owner-occupied house/condo value]()
- 1Less than $50,000
- 1$50,000 to $99,999
- 3$150,000 to $199,999
- 10$500,000 to $749,999
- 66$750,000 to $999,999
- 25$1,000,000 or more

Distribution of rent paid by renters
![Distribution of rent paid by renters]()
- 3$300 to $399
- 1$800 to $899
- 1$1,000 to $1,249
- 4$1,250 to $1,499
- 4$1,500 to $1,999
- 29$2,000 or more

Median rent in 2022:
| Civic Center: | $3,501 |
| La Palma: | $2,001 |
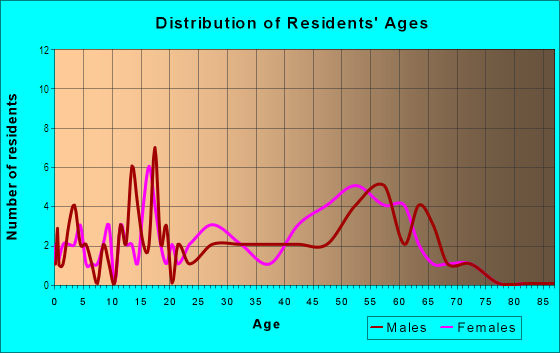
| Males: | 174 |
| Females: | 222 |
Males:
| This neighborhood: | 40.5 years |
| Whole city: | 43.8 years |
| This neighborhood: | 47.3 years |
| Whole city: | 45.1 years |
Average household size:
| Civic Center: | 3.0 people |
| La Palma: | 35.0 people |
Percentage of family households:
| Civic Center: | 40.4% |
| La Palma: | 45.8% |
| Here: | 63.3% |
| La Palma: | 61.9% |
Percentage of married-couple families with children (among all households):
| Civic Center: | 31.7% |
| La Palma: | 28.9% |
Percentage of single-mother households (among all households):
| Civic Center: | 1.6% |
| La Palma: | 2.0% |
Percentage of never married males 15 years old and over:
Percentage of never married females 15 years old and over:
| Civic Center: | 14.8% |
| La Palma: | 13.4% |
Percentage of never married females 15 years old and over:
| Civic Center: | 19.8% |
| city: | 15.5% |
Percentage of people that speak English not well or not at all:
| Civic Center: | 4.4% |
| La Palma: | 5.6% |
Percentage of people born in this state:
Percentage of people born in another U.S. state:
Percentage of native residents but born outside the U.S.:
Percentage of foreign born residents:
| Here: | 55.9% |
| La Palma: | 50.8% |
Percentage of people born in another U.S. state:
| Civic Center: | 9.3% |
| La Palma: | 11.8% |
Percentage of native residents but born outside the U.S.:
| Here: | 1.1% |
| city: | 1.8% |
Percentage of foreign born residents:
| Here: | 33.7% |
| La Palma: | 35.6% |
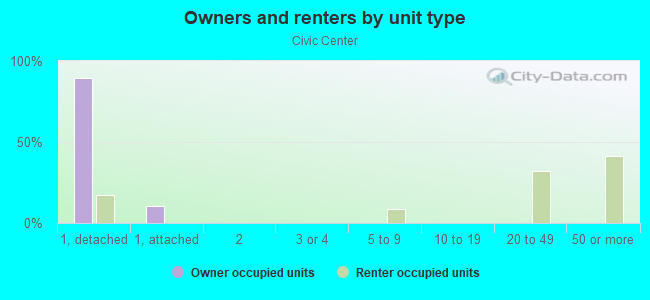
Owner-occupied
Renter-occupied

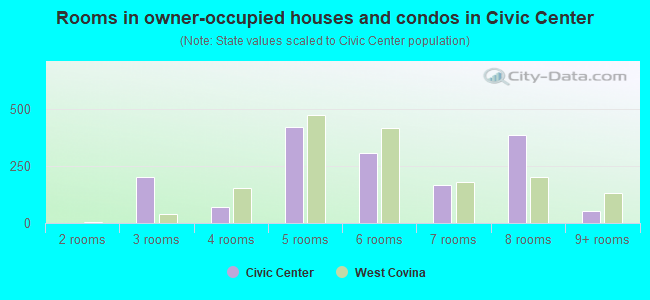
- Rooms in owner-occupied houses and condos in Civic Center
- 01 room
- 02 rooms
- 03 rooms
- 64 rooms
- 75 rooms
- 306 rooms
- 217 rooms
- 198 rooms
- 149+ rooms
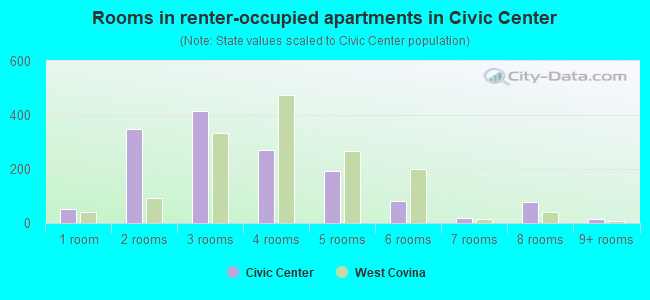
- Rooms in renter-occupied apartments in Civic Center
- 271 room
- 22 rooms
- 63 rooms
- 134 rooms
- 25 rooms
- 36 rooms
- 07 rooms
- 08 rooms
- 19+ rooms
Owner-occupied
Renter-occupied
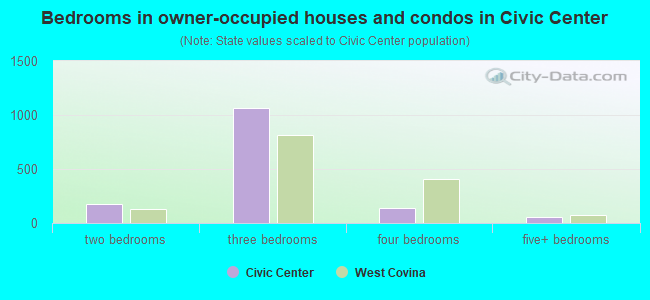
- Bedrooms in owner-occupied houses and condos in Civic Center
- 0no bedroom
- 01 bedroom
- 12 bedrooms
- 373 bedrooms
- 404 bedrooms
- 205+ bedrooms
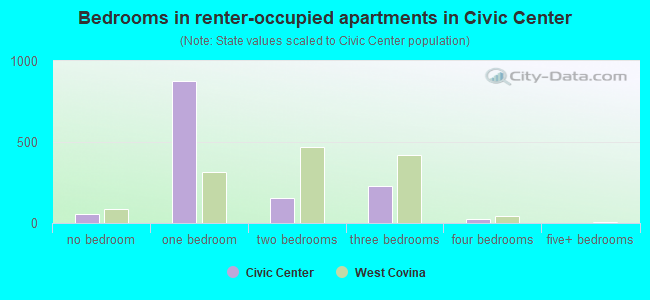
- Bedrooms in renter-occupied apartments in Civic Center
- 27no bedroom
- 21 bedroom
- 212 bedrooms
- 33 bedrooms
- 04 bedrooms
- 15+ bedrooms
Average number of cars or other vehicles available in houses/condos:
Average number of cars or other vehicles available in apartments:
| This neighborhood: | 2.3 |
| La Palma: | 2.4 |
Average number of cars or other vehicles available in apartments:
| Here: | 1.8 |
| city: | 1.7 |
Percentage of units with a mortgage:
| Civic Center: | 64.7% |
| La Palma: | 63.2% |
Average estimated value of detached houses in 2022 (76.1% of all units):
| Civic Center: | $899,877 |
| California: | $988,808 |
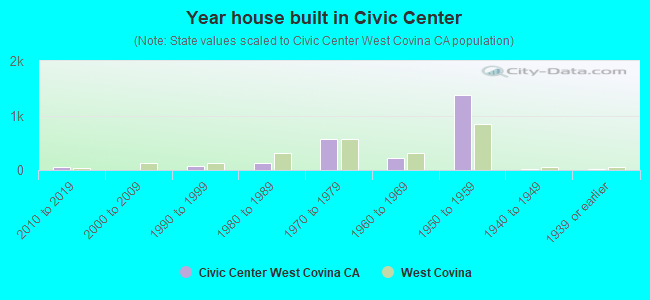
- Year house built in Civic Center
- 02020 or later
- 12010 to 2019
- 262000 to 2009
- 81990 to 1999
- 51980 to 1989
- 521970 to 1979
- 391960 to 1969
- 11950 to 1959
- 01940 to 1949
- 01939 or earlier
City-data.com crime index for city in 2020 (higher means more crime):
| City: | 129.5 |
| U.S. average: | 219.5 |
Travel time to work (commute)
![Travel time to work (commute)]()
- 155 to 9 minutes
- 1910 to 14 minutes
- 2415 to 19 minutes
- 3020 to 24 minutes
- 1025 to 29 minutes
- 2630 to 34 minutes
- 1035 to 39 minutes
- 940 to 44 minutes
- 2245 to 59 minutes
- 2160 to 89 minutes
- 490 or more minutes

Means of transportation to work
![Means of transportation to work]()
- 70.0%164Drove a car alone
- 9.8%23Carpooled
- 2.6%6Long-distance train or commuter rail
- 16.6%39Worked at home

Time leaving home to go to work
![Time leaving home to go to work]()
- 312:00 a.m. to 4:59 a.m.
- 55:00 a.m. to 5:29 a.m.
- 55:30 a.m. to 5:59 a.m.
- 166:00 a.m. to 6:29 a.m.
- 106:30 a.m. to 6:59 a.m.
- 347:00 a.m. to 7:29 a.m.
- 157:30 a.m. to 7:59 a.m.
- 268:00 a.m. to 8:29 a.m.
- 168:30 a.m. to 8:59 a.m.
- 179:00 a.m. to 9:59 a.m.
- 810:00 a.m. to 10:59 a.m.
- 211:00 a.m. to 11:59 a.m.
- 2212:00 p.m. to 3:59 p.m.
- 54:00 p.m. to 11:59 p.m.

Occupations of males:
- Percentage of males in management occupations (except farmers):
Here: 8.6% city: 18.0%
- Percentage of males in business and financial operations occupations:
Here: 4.7% city: 5.0%
- Percentage of males in computer and mathematical occupations:
Here: 2.6% city: 4.3%
- Percentage of males in architecture and engineering occupations:
Here: 3.9% city: 7.4%
- Percentage of males in life, physical, and social science occupations:
Here: 1.0% city: 1.3%
- Percentage of males in legal occupations:
Here: 3.5% city: 1.1%
- Percentage of males in education, training, and library occupations:
Here: 7.5% city: 4.8%
- Percentage of males in arts, design, entertainment, sports, and media occupations:
Here: 1.1% city: 0.9%
- Percentage of males in healthcare practitioners and technical occupations:
Here: 3.9% city: 6.8%
- Percentage of males in service occupations:
Here: 26.2% city: 11.2%
- Percentage of males in sales and office occupations:
Here: 24.3% city: 15.9%
- Percentage of males in construction, extraction, and maintenance occupations:
Here: 10.1% city: 5.6%
- Percentage of males in production occupations:
Here: 1.7% city: 5.3%
- Percentage of males in transportation occupations:
Here: 2.8% city: 3.1%
- Percentage of males in material moving occupations:
Here: 1.7% city: 3.4%
Occupations of females:
- Percentage of females in management occupations (except farmers):
Here: 19.3% city: 13.8%
- Percentage of females in business and financial operations occupations:
Here: 6.6% city: 6.7%
- Percentage of females in community and social services occupations:
Here: 1.5% city: 1.4%
- Percentage of females in legal occupations:
Here: 3.3% city: 2.0%
- Percentage of females in education, training, and library occupations:
Here: 6.2% city: 11.6%
- Percentage of females in arts, design, entertainment, sports, and media occupations:
Here: 7.9% city: 3.4%
- Percentage of females in healthcare practitioners and technical occupations:
Here: 13.9% city: 13.8%
- Percentage of females in service occupations:
Here: 23.5% city: 12.2%
- Percentage of females in sales and office occupations:
Here: 9.4% city: 26.5%
- Percentage of females in production occupations:
Here: 8.9% city: 1.8%
- Percentage of females in material moving occupations:
Here: 1.2% city: 1.3%
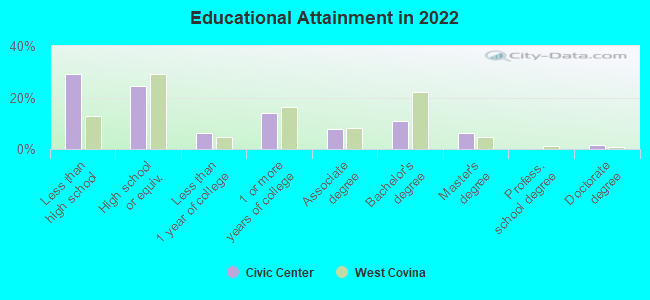
Education in this neighborhood (subdivision or community):
- Percentage of people 3 years and older in K-12 schools:
Civic Center: 13.6% La Palma: 15.4%
- Percentage of people 3 years and older in undergraduate colleges:
Civic Center: 11.5% La Palma: 7.7%
- Percentage of people 3 years and older in grad. or professional schools:
Civic Center: 0.8% La Palma: 1.9%
- Percentage of students K-12 enrolled in private schools:
Civic Center: 43.4% La Palma: 21.1%
Percentage of population below poverty level:
| Civic Center: | 7.1% |
| La Palma: | 6.2% |
Median year owner moved in (as recorded in 2022):
Median year renter moved in (as recorded in 2022):
| Civic Center: | 2003 |
| La Palma: | 2001 |
Median year renter moved in (as recorded in 2022):
| Civic Center: | 2019 |
| La Palma: | 2014 |
Percentage of married-couple families with both working:
| Civic Center: | 90.8% |
| La Palma: | 75.3% |
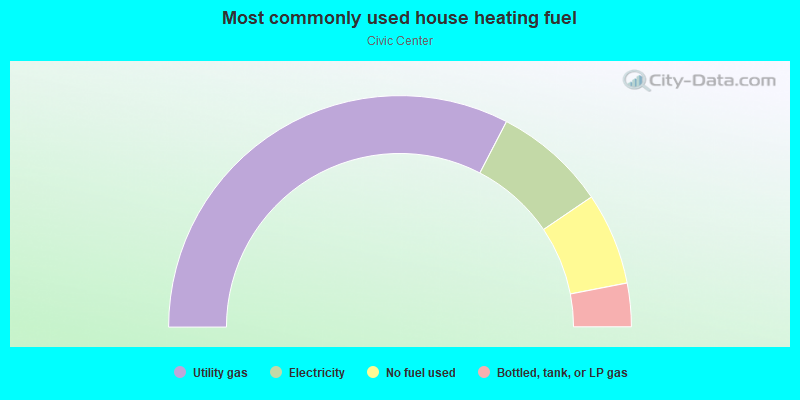
- 61.3%Utility gas
- 31.1%Electricity
- 3.7%Solar energy
- 2.3%No fuel used
- 1.7%Bottled, tank, or LP gas
Roads and streets:
Walker St
Length: 0.19 miles
Direction: N-S
Address range: 7736 to 7973
Direction: N-S
Address range: 7736 to 7973
Byrne Dr
Length: 0.12 miles
Directions: E-W, N-S
Address range: 5500 to 5599
Directions: E-W, N-S
Address range: 5500 to 5599
Bouma Cir
Length: 0.09 miles
Direction: N-S
Address range: 7746 to 7876
Direction: N-S
Address range: 7746 to 7876
Birchwood Cir
Length: 0.09 miles
Directions: N-S, SW-NE
Address range: 7800 to 7985
Directions: N-S, SW-NE
Address range: 7800 to 7985
Comstock Cir
Length: 0.08 miles
Direction: N-S
Address range: 7867 to 7962
Direction: N-S
Address range: 7867 to 7962
Camden Cir
Length: 0.08 miles
Direction: N-S
Address range: 7866 to 7956
Direction: N-S
Address range: 7866 to 7956
Lemonwood Cir
Length: 0.08 miles
Directions: N-S, SE-NW
Address range: 7885 to 7998
Directions: N-S, SE-NW
Address range: 7885 to 7998
Maplewood Ave
Length: 0.08 miles
Direction: E-W
Address range: 5567 to 5618
Direction: E-W
Address range: 5567 to 5618
Driftwood Ave
Length: 0.08 miles
Direction: E-W
Address range: 5546 to 5626
Direction: E-W
Address range: 5546 to 5626
San Simeon Dr
Length: 0.05 miles
Direction: E-W
Address range: 5678 to 5699
Direction: E-W
Address range: 5678 to 5699