Cinnabar neighborhood in San Jose, California (CA), 95118, 95124 detailed profile
Settings
X

Business Search - 14 Million verified businesses
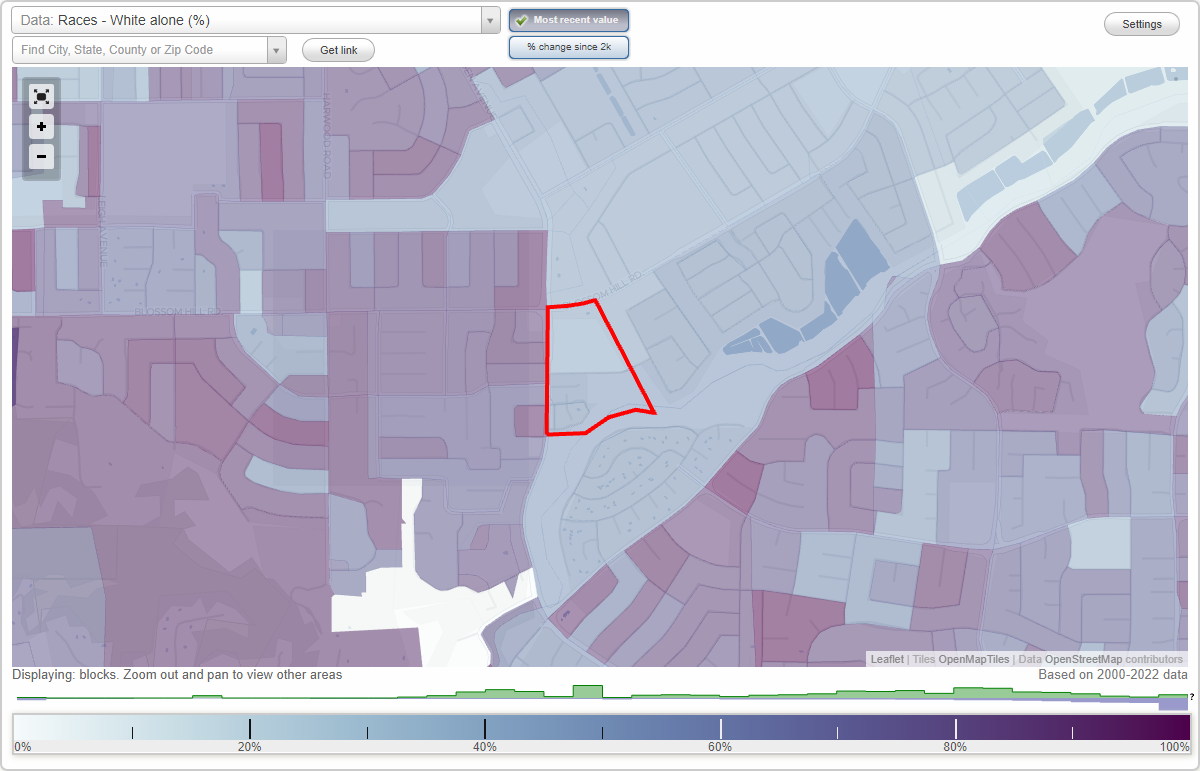
Area: 0.053 square miles
Population: 456
Population density:
| Cinnabar: | 8,525 people per square mile |
| San Jose: | 5,554 people per square mile |

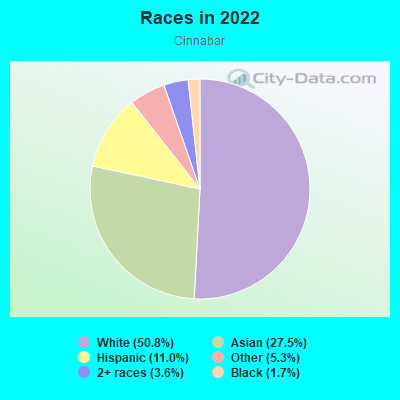
- 24050.8%White
- 13027.5%Asian
- 5211.0%Hispanic or Latino
- 255.3%Some other race
- 173.6%Two or more races
- 81.7%Black
Median household income in 2022:
| Cinnabar: | $162,650 |
| San Jose: | $133,835 |
Distribution of median household income
![Distribution of median household income]()
- 3Less than $10,000
- 11$10,000 to $19,999
- 10$20,000 to $29,999
- 4$40,000 to $49,999
- 5$50,000 to $59,999
- 4$60,000 to $74,999
- 6$75,000 to $99,999
- 16$100,000 to $124,999
- 7$125,000 to $149,999
- 23$150,000 to $199,999
- 69$200,000 or more

Distribution of owner-occupied house/condo value
![Distribution of owner-occupied house/condo value]()
- 6Less than $50,000
- 8$50,000 to $99,999
- 1$100,000 to $149,999
- 3$150,000 to $199,999
- 3$200,000 to $249,999
- 1$400,000 to $499,999
- 16$750,000 to $999,999
- 106$1,000,000 or more

Distribution of rent paid by renters
![Distribution of rent paid by renters]()
- 1$1,250 to $1,499
- 1$1,500 to $1,999
- 33$2,000 or more

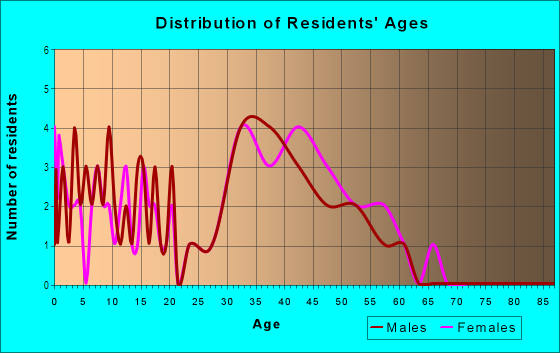
| Males: | 204 |
| Females: | 251 |
Males:
| This neighborhood: | 45.7 years |
| Whole city: | 37.6 years |
| This neighborhood: | 35.9 years |
| Whole city: | 39.1 years |
Average household size:
| Cinnabar: | 3.0 people |
| San Jose: | 2.9 people |
Percentage of family households:
| Cinnabar: | 66.5% |
| San Jose: | 49.9% |
| Here: | 74.2% |
| San Jose: | 53.0% |
Percentage of married-couple families with children (among all households):
| Cinnabar: | 30.5% |
| San Jose: | 25.8% |
Percentage of single-mother households (among all households):
| Cinnabar: | 1.8% |
| San Jose: | 5.2% |
Percentage of never married males 15 years old and over:
Percentage of never married females 15 years old and over:
| Cinnabar: | 11.3% |
| San Jose: | 20.9% |
Percentage of never married females 15 years old and over:
| Cinnabar: | 14.2% |
| city: | 16.7% |
Percentage of people that speak English not well or not at all:
| Cinnabar: | 0.0% |
| San Jose: | 11.4% |
Percentage of people born in this state:
Percentage of people born in another U.S. state:
Percentage of native residents but born outside the U.S.:
Percentage of foreign born residents:
| Here: | 58.7% |
| San Jose: | 46.1% |
Percentage of people born in another U.S. state:
| Cinnabar: | 17.8% |
| San Jose: | 10.4% |
Percentage of native residents but born outside the U.S.:
| Here: | 1.1% |
| city: | 1.7% |
Percentage of foreign born residents:
| Here: | 22.3% |
| San Jose: | 41.8% |
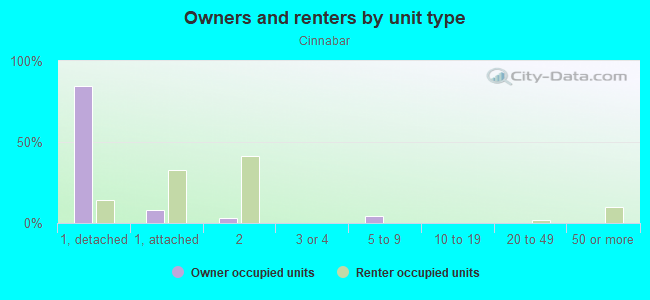
Owner-occupied
Renter-occupied

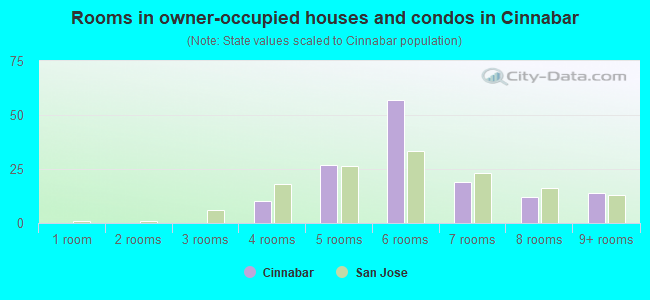
- Rooms in owner-occupied houses and condos in Cinnabar
- 01 room
- 02 rooms
- 03 rooms
- 104 rooms
- 275 rooms
- 576 rooms
- 197 rooms
- 128 rooms
- 149+ rooms
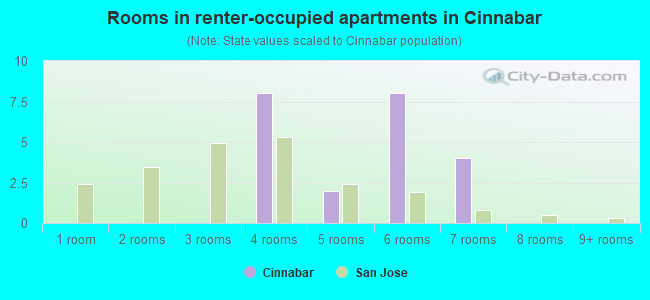
- Rooms in renter-occupied apartments in Cinnabar
- 01 room
- 02 rooms
- 03 rooms
- 84 rooms
- 25 rooms
- 86 rooms
- 47 rooms
- 08 rooms
- 09+ rooms
Owner-occupied
Renter-occupied
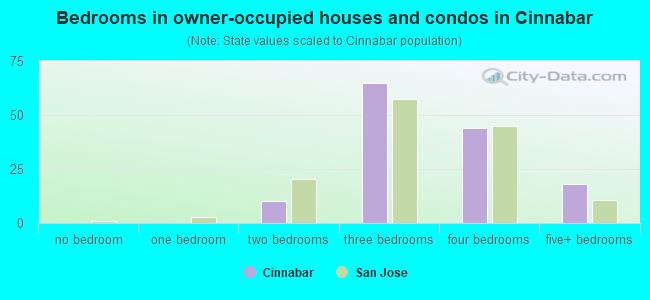
- Bedrooms in owner-occupied houses and condos in Cinnabar
- 0no bedroom
- 01 bedroom
- 102 bedrooms
- 653 bedrooms
- 444 bedrooms
- 185+ bedrooms
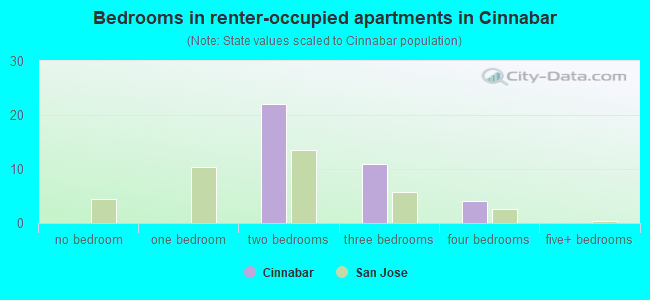
- Bedrooms in renter-occupied apartments in Cinnabar
- 0no bedroom
- 01 bedroom
- 222 bedrooms
- 113 bedrooms
- 44 bedrooms
- 05+ bedrooms
Average number of cars or other vehicles available in houses/condos:
Average number of cars or other vehicles available in apartments:
| This neighborhood: | 2.4 |
| San Jose: | 2.3 |
Average number of cars or other vehicles available in apartments:
| Here: | 1.9 |
| city: | 1.6 |
Percentage of units with a mortgage:
| Cinnabar: | 71.4% |
| San Jose: | 66.9% |
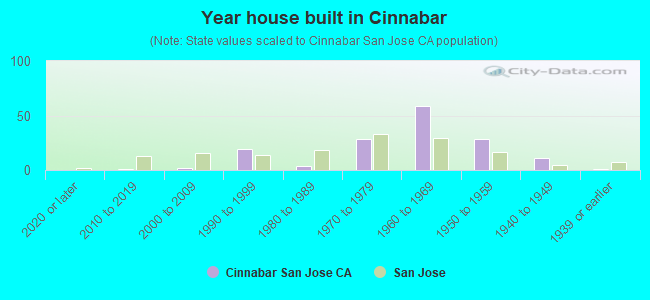
- Year house built in Cinnabar
- 02020 or later
- 12010 to 2019
- 22000 to 2009
- 191990 to 1999
- 41980 to 1989
- 281970 to 1979
- 591960 to 1969
- 281950 to 1959
- 111940 to 1949
- 11939 or earlier
City-data.com crime index for city in 2020 (higher means more crime):
| City: | 268.4 |
| U.S. average: | 219.5 |
Travel time to work (commute)
![Travel time to work (commute)]()
- 25 to 9 minutes
- 210 to 14 minutes
- 315 to 19 minutes
- 420 to 24 minutes
- 425 to 29 minutes
- 530 to 34 minutes
- 235 to 39 minutes
- 140 to 44 minutes
- 2245 to 59 minutes
- 260 to 89 minutes
- 190 or more minutes

Means of transportation to work
![Means of transportation to work]()
- 77.5%159Drove a car alone
- 4.9%10Carpooled
- 2.4%5Bus
- 1.5%3Walked
- 12.2%25Worked at home

Time leaving home to go to work
![Time leaving home to go to work]()
- 112:00 a.m. to 4:59 a.m.
- 36:30 a.m. to 6:59 a.m.
- 77:00 a.m. to 7:29 a.m.
- 37:30 a.m. to 7:59 a.m.
- 58:00 a.m. to 8:29 a.m.
- 28:30 a.m. to 8:59 a.m.
- 59:00 a.m. to 9:59 a.m.
- 110:00 a.m. to 10:59 a.m.

Occupations of males:
- Percentage of males in management occupations (except farmers):
Here: 11.5% city: 13.0%
- Percentage of males in business and financial operations occupations:
Here: 3.6% city: 4.6%
- Percentage of males in computer and mathematical occupations:
Here: 17.0% city: 13.6%
- Percentage of males in architecture and engineering occupations:
Here: 10.6% city: 10.2%
- Percentage of males in life, physical, and social science occupations:
Here: 1.4% city: 1.1%
- Percentage of males in education, training, and library occupations:
Here: 6.5% city: 2.8%
- Percentage of males in arts, design, entertainment, sports, and media occupations:
Here: 2.8% city: 1.8%
- Percentage of males in healthcare practitioners and technical occupations:
Here: 4.8% city: 2.0%
- Percentage of males in service occupations:
Here: 14.1% city: 12.7%
- Percentage of males in sales and office occupations:
Here: 14.3% city: 12.8%
- Percentage of males in construction, extraction, and maintenance occupations:
Here: 10.1% city: 7.8%
- Percentage of males in production occupations:
Here: 1.1% city: 5.5%
Occupations of females:
- Percentage of females in management occupations (except farmers):
Here: 12.9% city: 11.0%
- Percentage of females in business and financial operations occupations:
Here: 21.5% city: 8.6%
- Percentage of females in architecture and engineering occupations:
Here: 2.5% city: 2.8%
- Percentage of females in education, training, and library occupations:
Here: 23.4% city: 8.1%
- Percentage of females in arts, design, entertainment, sports, and media occupations:
Here: 1.3% city: 2.0%
- Percentage of females in healthcare practitioners and technical occupations:
Here: 7.7% city: 6.8%
- Percentage of females in service occupations:
Here: 21.7% city: 21.7%
- Percentage of females in sales and office occupations:
Here: 7.5% city: 22.0%
- Percentage of females in transportation occupations:
Here: 1.4% city: 0.7%
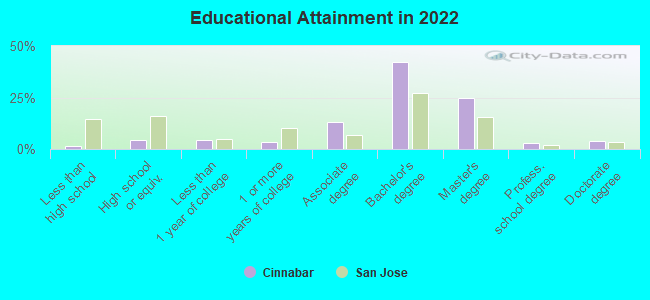
Education in this neighborhood (subdivision or community):
- Percentage of people 3 years and older in K-12 schools:
Cinnabar: 24.6% San Jose: 16.1%
- Percentage of people 3 years and older in undergraduate colleges:
Cinnabar: 6.4% San Jose: 6.5%
- Percentage of people 3 years and older in grad. or professional schools:
Cinnabar: 0.0% San Jose: 2.0%
- Percentage of students K-12 enrolled in private schools:
Cinnabar: 38.7% San Jose: 14.9%
Percentage of population below poverty level:
| Cinnabar: | 2.3% |
| San Jose: | 9.0% |
Median year owner moved in (as recorded in 2022):
Median year renter moved in (as recorded in 2022):
| Cinnabar: | 2006 |
| San Jose: | 2008 |
Median year renter moved in (as recorded in 2022):
| Cinnabar: | 2019 |
| San Jose: | 2020 |
Percentage of married-couple families with both working:
| Cinnabar: | 51.1% |
| San Jose: | 72.5% |
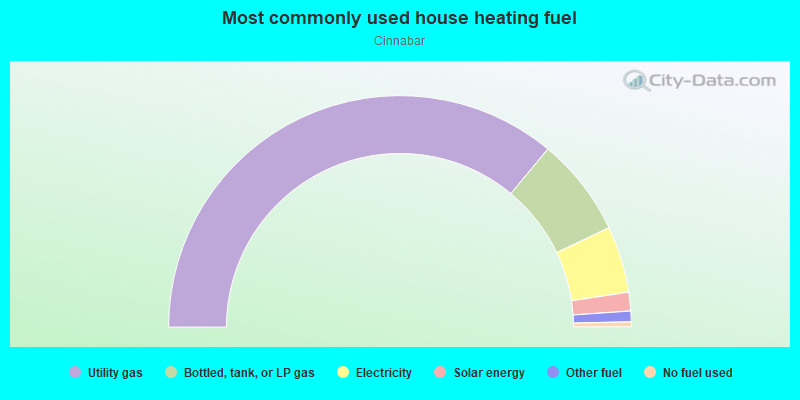
- 72.1%Utility gas
- 13.8%Bottled, tank, or LP gas
- 9.3%Electricity
- 2.6%Solar energy
- 1.5%Other fuel
- 0.7%No fuel used
Roads and streets:
Camden Village Cir
Length: 0.24 miles
Directions: E-W, N-S, SE-NW, SW-NE
Address range: 1540 to 1596
Directions: E-W, N-S, SE-NW, SW-NE
Address range: 1540 to 1596
Camden Village Way
Length: 0.06 miles
Direction: N-S
Address range: 5700 to 5798
Direction: N-S
Address range: 5700 to 5798
Camden Village Ct
Length: 0.04 miles
Directions: N-S, SE-NW
Address range: 5701 to 5799
Directions: N-S, SE-NW
Address range: 5701 to 5799