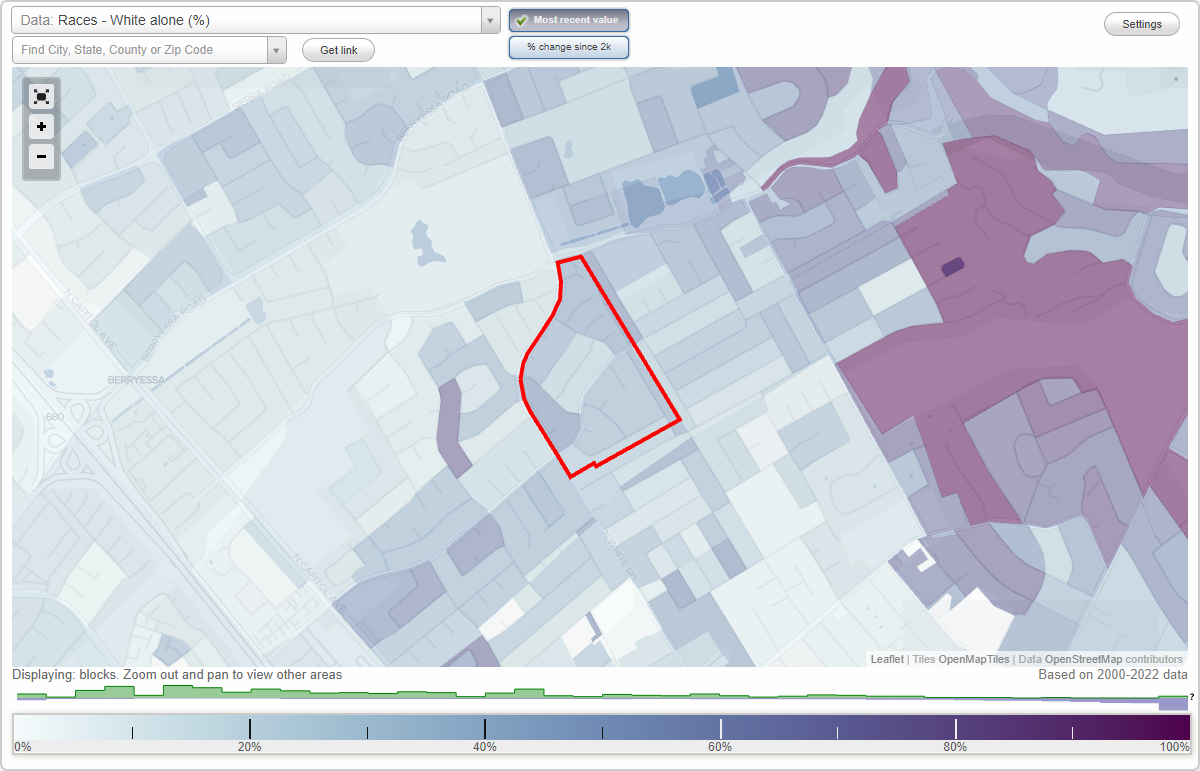
Cimarron neighborhood in San Jose, California (CA), 95127 detailed profile
Settings
X

Business Search - 14 Million verified businesses
Area: 0.104 square miles
Population: 469
Population density:
| Cimarron: | 4,502 people per square mile |
| San Jose: | 5,554 people per square mile |

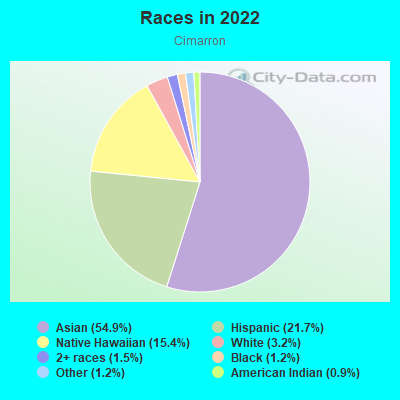
- 32254.9%Asian
- 12721.7%Hispanic or Latino
- 9015.4%Native Hawaiian and Other
Pacific Islander - 193.2%White
- 91.5%Two or more races
- 71.2%Black
- 71.2%Some other race
- 50.9%American Indian
Median household income in 2022:
| Cimarron: | $138,528 |
| San Jose: | $133,835 |
Distribution of median household income
![Distribution of median household income]()
- 11Less than $10,000
- 6$10,000 to $19,999
- 10$20,000 to $29,999
- 15$30,000 to $39,999
- 21$40,000 to $49,999
- 11$50,000 to $59,999
- 4$60,000 to $74,999
- 15$75,000 to $99,999
- 12$100,000 to $124,999
- 9$125,000 to $149,999
- 13$150,000 to $199,999
- 52$200,000 or more

Distribution of owner-occupied house/condo value
![Distribution of owner-occupied house/condo value]()
- 3Less than $50,000
- 8$50,000 to $99,999
- 2$150,000 to $199,999
- 3$200,000 to $249,999
- 24$300,000 to $399,999
- 29$400,000 to $499,999
- 62$500,000 to $749,999
- 8$750,000 to $999,999
- 67$1,000,000 or more

Distribution of rent paid by renters
![Distribution of rent paid by renters]()
- 3$200 to $299
- 4$700 to $799
- 11$900 to $999
- 2$1,250 to $1,499
- 14$1,500 to $1,999
- 120$2,000 or more

Median rent in 2022:
| Cimarron: | $3,500 |
| San Jose: | $2,001 |
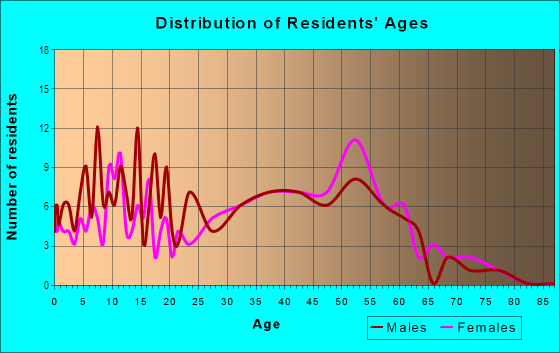
| Males: | 226 |
| Females: | 242 |
Males:
| This neighborhood: | 42.6 years |
| Whole city: | 37.6 years |
| This neighborhood: | 44.1 years |
| Whole city: | 39.1 years |
Average household size:
| Cimarron: | 4.1 people |
| San Jose: | 2.9 people |
Percentage of family households:
| Cimarron: | 23.5% |
| San Jose: | 49.9% |
| Here: | 78.1% |
| San Jose: | 53.0% |
Percentage of married-couple families with children (among all households):
| Cimarron: | 13.8% |
| San Jose: | 25.8% |
Percentage of single-mother households (among all households):
| Cimarron: | 9.2% |
| San Jose: | 5.2% |
Percentage of never married males 15 years old and over:
Percentage of never married females 15 years old and over:
| Cimarron: | 24.2% |
| San Jose: | 20.9% |
Percentage of never married females 15 years old and over:
| Cimarron: | 12.8% |
| city: | 16.7% |
Percentage of people that speak English not well or not at all:
| Cimarron: | 11.8% |
| San Jose: | 11.4% |
Percentage of people born in this state:
Percentage of people born in another U.S. state:
Percentage of native residents but born outside the U.S.:
Percentage of foreign born residents:
| Here: | 49.8% |
| San Jose: | 46.1% |
Percentage of people born in another U.S. state:
| Cimarron: | 6.0% |
| San Jose: | 10.4% |
Percentage of native residents but born outside the U.S.:
| Here: | 1.8% |
| city: | 1.7% |
Percentage of foreign born residents:
| Here: | 42.4% |
| San Jose: | 41.8% |
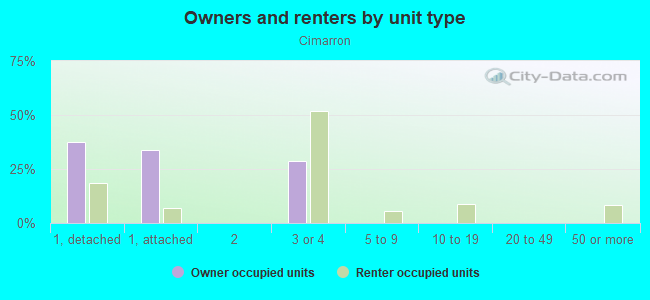
Owner-occupied
Renter-occupied

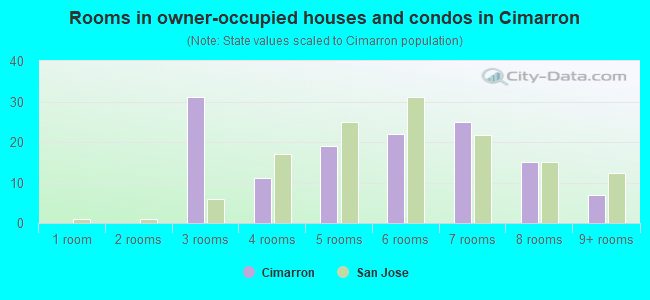
- Rooms in owner-occupied houses and condos in Cimarron
- 01 room
- 02 rooms
- 313 rooms
- 114 rooms
- 195 rooms
- 226 rooms
- 257 rooms
- 158 rooms
- 79+ rooms
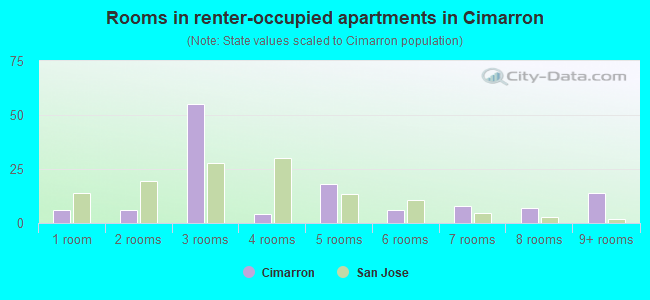
- Rooms in renter-occupied apartments in Cimarron
- 61 room
- 62 rooms
- 553 rooms
- 44 rooms
- 185 rooms
- 66 rooms
- 87 rooms
- 78 rooms
- 149+ rooms
Owner-occupied
Renter-occupied
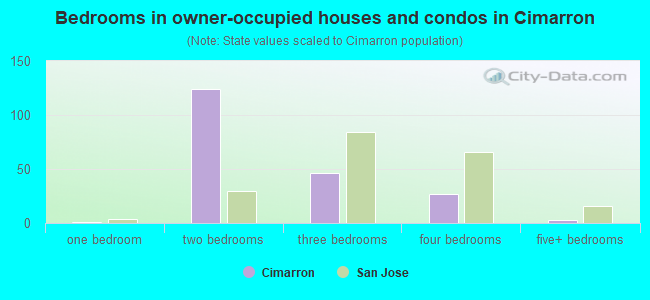
- Bedrooms in owner-occupied houses and condos in Cimarron
- 0no bedroom
- 11 bedroom
- 1242 bedrooms
- 463 bedrooms
- 274 bedrooms
- 35+ bedrooms
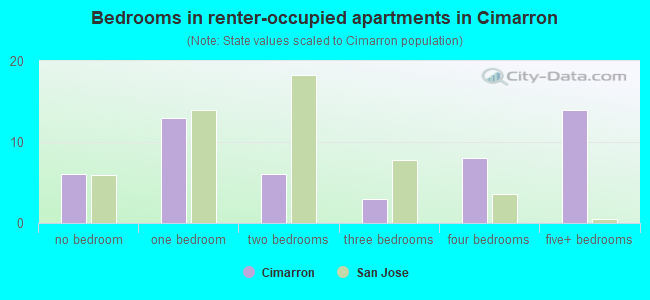
- Bedrooms in renter-occupied apartments in Cimarron
- 6no bedroom
- 131 bedroom
- 62 bedrooms
- 33 bedrooms
- 84 bedrooms
- 145+ bedrooms
Average number of cars or other vehicles available in houses/condos:
Average number of cars or other vehicles available in apartments:
| This neighborhood: | 2.9 |
| San Jose: | 2.3 |
Average number of cars or other vehicles available in apartments:
| Here: | 2.9 |
| city: | 1.6 |
Percentage of units with a mortgage:
| Cimarron: | 64.4% |
| San Jose: | 66.9% |
Average estimated value of detached houses in 2022 (100.0% of all units):
| Cimarron: | $2,179,847 |
| San Jose: | $1,532,815 |
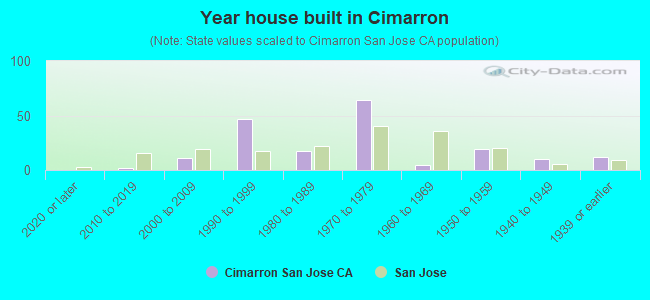
- Year house built in Cimarron
- 02020 or later
- 22010 to 2019
- 112000 to 2009
- 471990 to 1999
- 171980 to 1989
- 641970 to 1979
- 51960 to 1969
- 191950 to 1959
- 101940 to 1949
- 121939 or earlier
City-data.com crime index for city in 2020 (higher means more crime):
| City: | 268.4 |
| U.S. average: | 219.5 |
Travel time to work (commute)
![Travel time to work (commute)]()
- 1Less than 5 minutes
- 55 to 9 minutes
- 2910 to 14 minutes
- 8015 to 19 minutes
- 9620 to 24 minutes
- 1925 to 29 minutes
- 11030 to 34 minutes
- 435 to 39 minutes
- 1640 to 44 minutes
- 645 to 59 minutes
- 4660 to 89 minutes
- 690 or more minutes

Means of transportation to work
![Means of transportation to work]()
- 74.5%172Drove a car alone
- 2.2%5Carpooled
- 10.0%23Bus
- 0.9%2Subway or elevated rail
- 0.4%1Long-distance train or commuter rail
- 2.2%5Light rail, streetcar or trolley
- 0.9%2Taxi
- 5.2%12Walked
- 7.8%18Other means
- 17.3%40Worked at home

Time leaving home to go to work
![Time leaving home to go to work]()
- 2412:00 a.m. to 4:59 a.m.
- 235:00 a.m. to 5:29 a.m.
- 225:30 a.m. to 5:59 a.m.
- 696:00 a.m. to 6:29 a.m.
- 466:30 a.m. to 6:59 a.m.
- 427:00 a.m. to 7:29 a.m.
- 337:30 a.m. to 7:59 a.m.
- 498:00 a.m. to 8:29 a.m.
- 98:30 a.m. to 8:59 a.m.
- 599:00 a.m. to 9:59 a.m.
- 1710:00 a.m. to 10:59 a.m.
- 611:00 a.m. to 11:59 a.m.
- 2612:00 p.m. to 3:59 p.m.
- 184:00 p.m. to 11:59 p.m.

Occupations of males:
- Percentage of males in management occupations (except farmers):
Here: 7.1% city: 13.0%
- Percentage of males in computer and mathematical occupations:
Here: 10.6% city: 13.6%
- Percentage of males in architecture and engineering occupations:
Here: 31.0% city: 10.2%
- Percentage of males in life, physical, and social science occupations:
Here: 4.0% city: 1.1%
- Percentage of males in education, training, and library occupations:
Here: 4.7% city: 2.8%
- Percentage of males in healthcare practitioners and technical occupations:
Here: 2.1% city: 2.0%
- Percentage of males in service occupations:
Here: 15.7% city: 12.7%
- Percentage of males in sales and office occupations:
Here: 15.9% city: 12.8%
- Percentage of males in farming, fishing, and forestry occupations:
Here: 2.8% city: 0.4%
- Percentage of males in construction, extraction, and maintenance occupations:
Here: 4.5% city: 7.8%
- Percentage of males in production occupations:
Here: 7.3% city: 5.5%
- Percentage of males in transportation occupations:
Here: 7.8% city: 3.6%
Occupations of females:
- Percentage of females in management occupations (except farmers):
Here: 13.6% city: 11.0%
- Percentage of females in business and financial operations occupations:
Here: 21.5% city: 8.6%
- Percentage of females in computer and mathematical occupations:
Here: 8.9% city: 5.4%
- Percentage of females in architecture and engineering occupations:
Here: 2.3% city: 2.8%
- Percentage of females in community and social services occupations:
Here: 1.5% city: 1.8%
- Percentage of females in education, training, and library occupations:
Here: 5.1% city: 8.1%
- Percentage of females in arts, design, entertainment, sports, and media occupations:
Here: 10.8% city: 2.0%
- Percentage of females in healthcare practitioners and technical occupations:
Here: 8.9% city: 6.8%
- Percentage of females in service occupations:
Here: 28.3% city: 21.7%
- Percentage of females in production occupations:
Here: 3.4% city: 4.0%
- Percentage of females in material moving occupations:
Here: 10.2% city: 1.5%
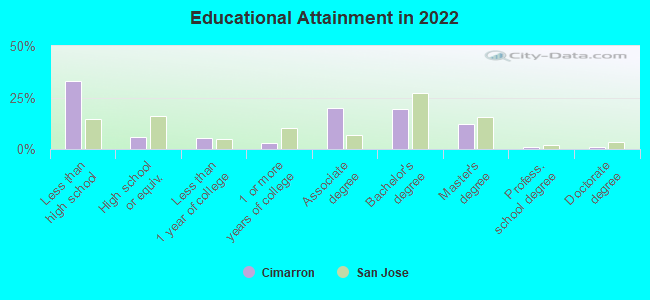
Education in this neighborhood (subdivision or community):
- Percentage of people 3 years and older in K-12 schools:
Cimarron: 27.7% San Jose: 16.1%
- Percentage of people 3 years and older in undergraduate colleges:
Cimarron: 13.4% San Jose: 6.5%
- Percentage of people 3 years and older in grad. or professional schools:
Cimarron: 1.1% San Jose: 2.0%
- Percentage of students K-12 enrolled in private schools:
Cimarron: 10.0% San Jose: 14.9%
Percentage of population below poverty level:
| Cimarron: | 4.6% |
| San Jose: | 9.0% |
Median year owner moved in (as recorded in 2022):
Median year renter moved in (as recorded in 2022):
| Cimarron: | 2004 |
| San Jose: | 2008 |
Median year renter moved in (as recorded in 2022):
| Cimarron: | 2011 |
| San Jose: | 2020 |
Percentage of married-couple families with both working:
| Cimarron: | 99.9% |
| San Jose: | 72.5% |
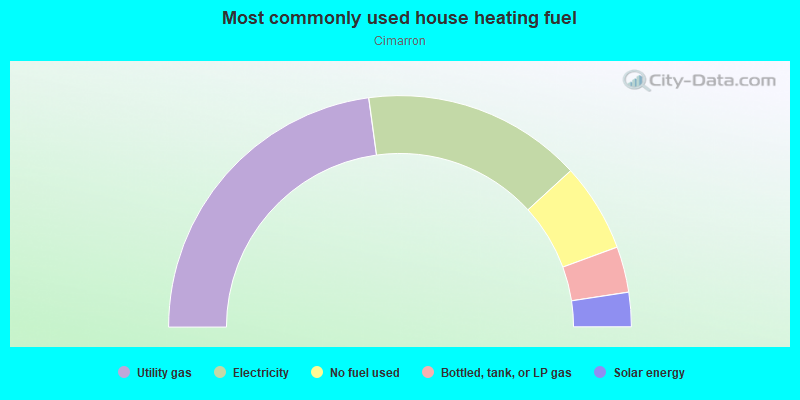
- 45.7%Utility gas
- 30.7%Electricity
- 12.4%No fuel used
- 6.4%Bottled, tank, or LP gas
- 4.8%Solar energy
Roads and streets:
Mabury Rd
Length: 0.30 miles
Directions: N-S, SW-NE
Address range: 3118 to 3299
Directions: N-S, SW-NE
Address range: 3118 to 3299
Orange St
Length: 0.30 miles
Directions: E-W, SE-NW, SW-NE
Address range: 3100 to 3299
Directions: E-W, SE-NW, SW-NE
Address range: 3100 to 3299
Pelleas Ln
Length: 0.19 miles
Direction: SE-NW
Address range: 716 to 799
Direction: SE-NW
Address range: 716 to 799
Kawalker Ln
Length: 0.19 miles
Directions: N-S, SW-NE
Address range: 3100 to 3299
Directions: N-S, SW-NE
Address range: 3100 to 3299
Fiji Dr
Length: 0.17 miles
Directions: E-W, SE-NW
Address range: 700 to 826
Directions: E-W, SE-NW
Address range: 700 to 826
Salem Dr
Length: 0.17 miles
Direction: SW-NE
Address range: 3100 to 3299
Direction: SW-NE
Address range: 3100 to 3299
Pride St
Length: 0.16 miles
Directions: E-W, SE-NW
Address range: 700 to 799
Directions: E-W, SE-NW
Address range: 700 to 799
Kyle St
Length: 0.15 miles
Directions: E-W, SE-NW
Address range: 701 to 798
Directions: E-W, SE-NW
Address range: 701 to 798
Almansa Ct
Length: 0.11 miles
Direction: SW-NE
Address range: 3200 to 3299
Direction: SW-NE
Address range: 3200 to 3299
Segovia Ct
Length: 0.08 miles
Direction: SW-NE
Address range: 3200 to 3299
Direction: SW-NE
Address range: 3200 to 3299
Timor Ct
Length: 0.08 miles
Direction: SE-NW
Address range: 700 to 799
Direction: SE-NW
Address range: 700 to 799
Janku Ct
Length: 0.04 miles
Direction: SW-NE
Address range: 3200 to 3299
Direction: SW-NE
Address range: 3200 to 3299
Franklin Ct
Length: 0.04 miles
Direction: E-W
Address range: 700 to 799
Direction: E-W
Address range: 700 to 799
Pride Ct
Length: 0.03 miles
Direction: SW-NE
Address range: 3200 to 3299
Direction: SW-NE
Address range: 3200 to 3299
Indus Ct
Length: 0.03 miles
Directions: N-S, SE-NW, SW-NE
Address range: 3241 to 3299
Directions: N-S, SE-NW, SW-NE
Address range: 3241 to 3299
Hedda Ct
Length: 0.02 miles
Direction: SE-NW
Address range: 3200 to 3299
Direction: SE-NW
Address range: 3200 to 3299