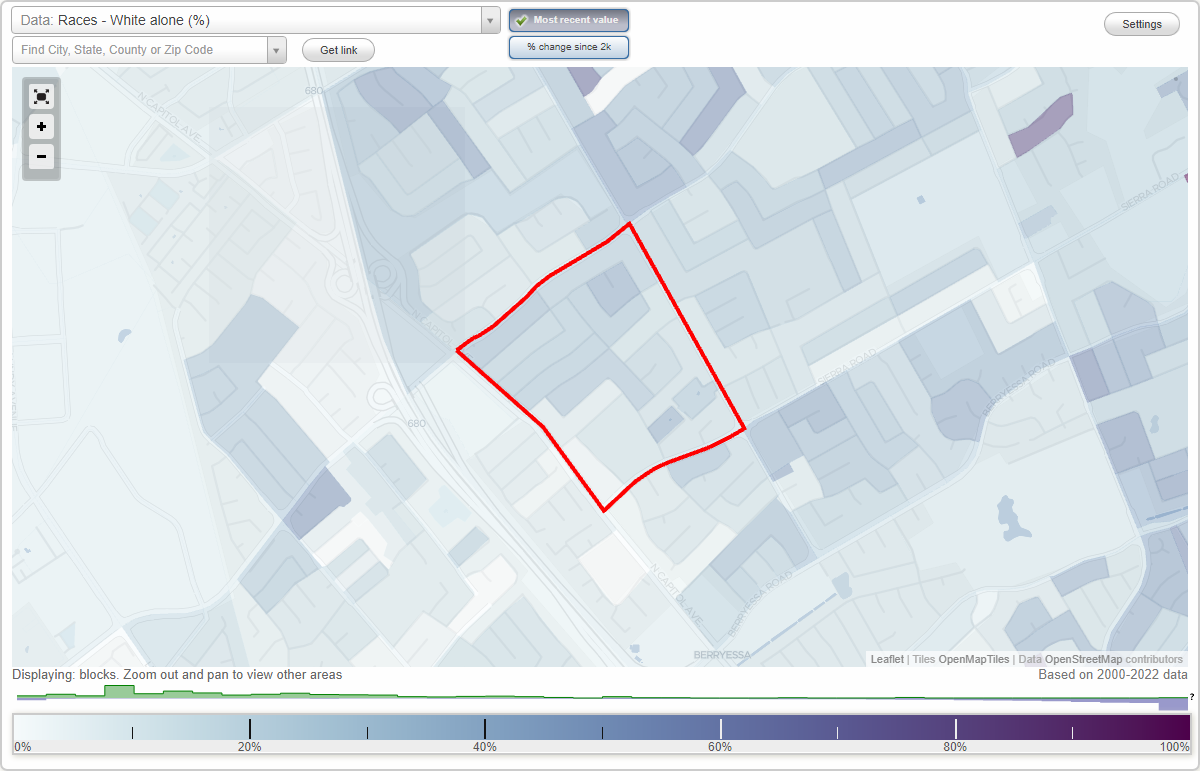
Cherrywood neighborhood in San Jose, California (CA), 95132 detailed profile
Settings
X

Business Search - 14 Million verified businesses
Area: 0.224 square miles
Population: 2,651
Population density:
| Cherrywood: | 11,837 people per square mile |
| San Jose: | 5,554 people per square mile |

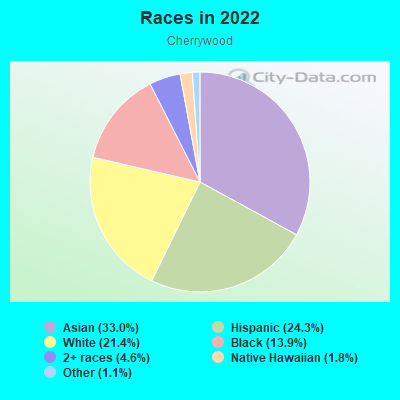
- 1,76266.2%Asian
- 51419.3%Hispanic or Latino
- 2579.7%White
- 782.9%Two or more races
- 371.4%Black
- 130.5%Some other race
Median household income in 2022:
| Cherrywood: | $163,224 |
| San Jose: | $133,835 |
Distribution of median household income
![Distribution of median household income]()
- 21Less than $10,000
- 46$10,000 to $19,999
- 16$20,000 to $29,999
- 34$30,000 to $39,999
- 57$40,000 to $49,999
- 30$50,000 to $59,999
- 90$60,000 to $74,999
- 59$75,000 to $99,999
- 64$100,000 to $124,999
- 18$125,000 to $149,999
- 83$150,000 to $199,999
- 335$200,000 or more

Distribution of owner-occupied house/condo value
![Distribution of owner-occupied house/condo value]()
- 30Less than $50,000
- 10$50,000 to $99,999
- 23$100,000 to $149,999
- 7$300,000 to $399,999
- 15$400,000 to $499,999
- 41$500,000 to $749,999
- 26$750,000 to $999,999
- 530$1,000,000 or more

Distribution of rent paid by renters
![Distribution of rent paid by renters]()
- 10$500 to $599
- 6$1,250 to $1,499
- 10$1,500 to $1,999
- 145$2,000 or more

Median rent in 2022:
| Cherrywood: | $3,313 |
| San Jose: | $2,001 |
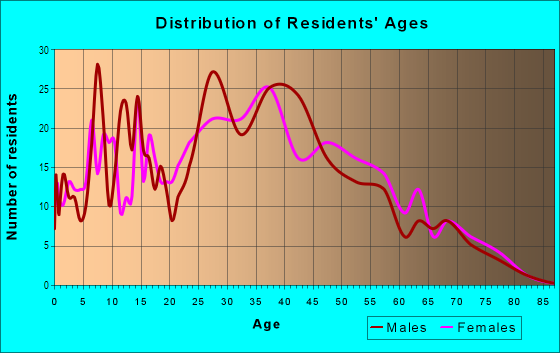
| Males: | 1,472 |
| Females: | 1,178 |
Males:
| This neighborhood: | 42.4 years |
| Whole city: | 37.6 years |
| This neighborhood: | 45.7 years |
| Whole city: | 39.1 years |
Average household size:
| Cherrywood: | 10.2 people |
| San Jose: | 2.9 people |
Percentage of family households:
| Cherrywood: | 50.7% |
| San Jose: | 49.9% |
| Here: | 58.0% |
| San Jose: | 53.0% |
Percentage of married-couple families with children (among all households):
| Cherrywood: | 28.6% |
| San Jose: | 25.8% |
Percentage of single-mother households (among all households):
| Cherrywood: | 0.9% |
| San Jose: | 5.2% |
Percentage of never married males 15 years old and over:
Percentage of never married females 15 years old and over:
| Cherrywood: | 23.5% |
| San Jose: | 20.9% |
Percentage of never married females 15 years old and over:
| Cherrywood: | 15.3% |
| city: | 16.7% |
Percentage of people that speak English not well or not at all:
| Cherrywood: | 10.7% |
| San Jose: | 11.4% |
Percentage of people born in this state:
Percentage of people born in another U.S. state:
Percentage of native residents but born outside the U.S.:
Percentage of foreign born residents:
| Here: | 40.2% |
| San Jose: | 46.1% |
Percentage of people born in another U.S. state:
| Cherrywood: | 3.3% |
| San Jose: | 10.4% |
Percentage of native residents but born outside the U.S.:
| Here: | 2.4% |
| city: | 1.7% |
Percentage of foreign born residents:
| Here: | 54.2% |
| San Jose: | 41.8% |
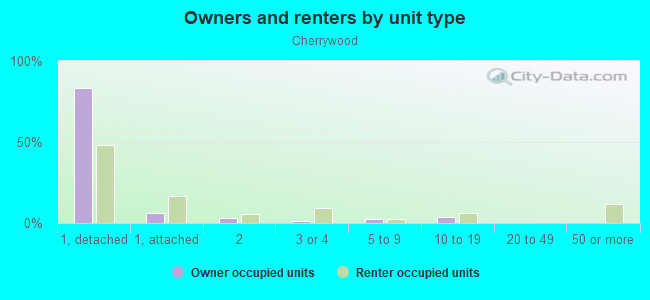
Owner-occupied
Renter-occupied

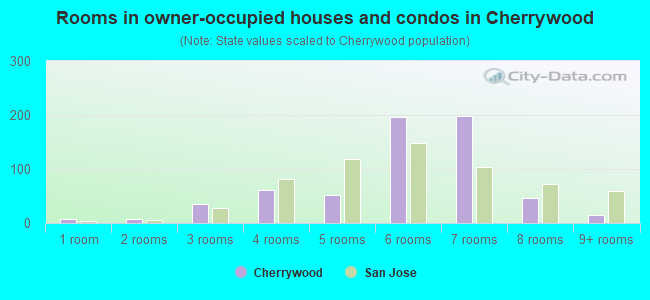
- Rooms in owner-occupied houses and condos in Cherrywood
- 71 room
- 72 rooms
- 363 rooms
- 624 rooms
- 515 rooms
- 1976 rooms
- 1997 rooms
- 478 rooms
- 149+ rooms
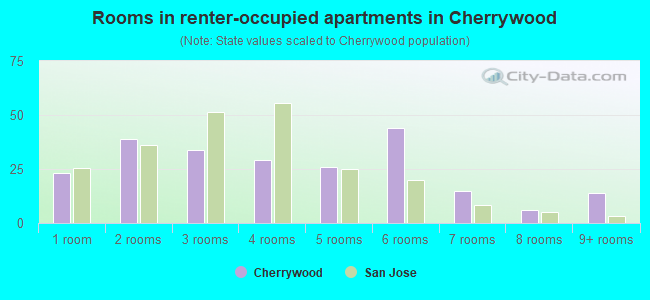
- Rooms in renter-occupied apartments in Cherrywood
- 231 room
- 392 rooms
- 343 rooms
- 294 rooms
- 265 rooms
- 446 rooms
- 157 rooms
- 68 rooms
- 149+ rooms
Owner-occupied
Renter-occupied
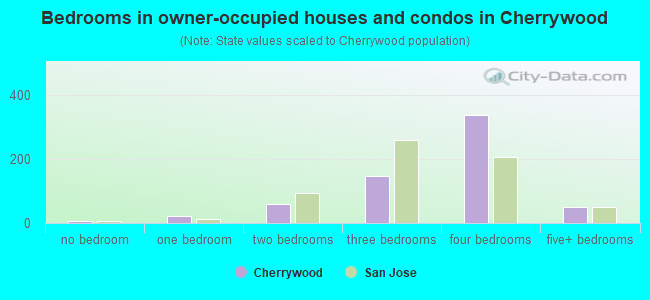
- Bedrooms in owner-occupied houses and condos in Cherrywood
- 7no bedroom
- 231 bedroom
- 602 bedrooms
- 1483 bedrooms
- 3384 bedrooms
- 495+ bedrooms
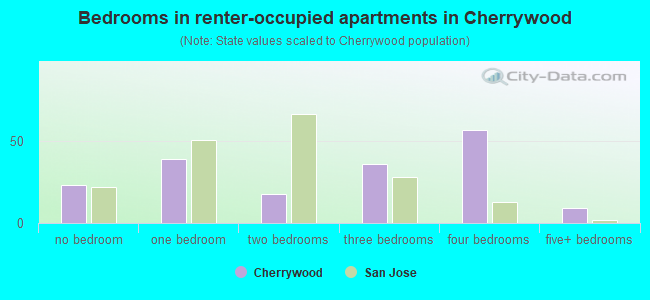
- Bedrooms in renter-occupied apartments in Cherrywood
- 23no bedroom
- 391 bedroom
- 182 bedrooms
- 363 bedrooms
- 574 bedrooms
- 95+ bedrooms
Average number of cars or other vehicles available in houses/condos:
Average number of cars or other vehicles available in apartments:
| This neighborhood: | 2.6 |
| San Jose: | 2.3 |
Average number of cars or other vehicles available in apartments:
| Here: | 2.5 |
| city: | 1.6 |
Percentage of units with a mortgage:
| Cherrywood: | 79.0% |
| San Jose: | 66.9% |
Average estimated value of detached houses in 2022 (80.8% of all units):
| Cherrywood: | $1,394,278 |
| San Jose: | $1,532,815 |
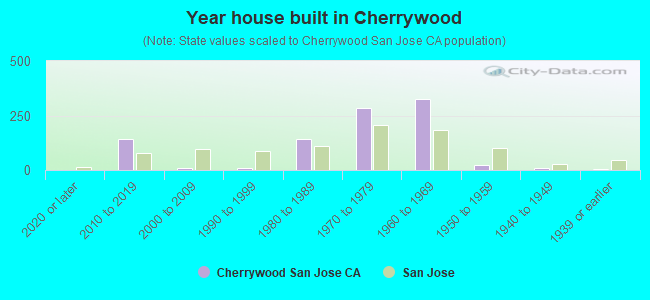
- Year house built in Cherrywood
- 22020 or later
- 1422010 to 2019
- 72000 to 2009
- 91990 to 1999
- 1401980 to 1989
- 2861970 to 1979
- 3261960 to 1969
- 251950 to 1959
- 91940 to 1949
- 61939 or earlier
City-data.com crime index for city in 2020 (higher means more crime):
| City: | 268.4 |
| U.S. average: | 219.5 |
Travel time to work (commute)
![Travel time to work (commute)]()
- 21Less than 5 minutes
- 375 to 9 minutes
- 18410 to 14 minutes
- 15915 to 19 minutes
- 31520 to 24 minutes
- 11425 to 29 minutes
- 26330 to 34 minutes
- 4535 to 39 minutes
- 1240 to 44 minutes
- 10945 to 59 minutes
- 9960 to 89 minutes
- 4890 or more minutes

Means of transportation to work
![Means of transportation to work]()
- 67.8%1,033Drove a car alone
- 9.8%149Carpooled
- 2.0%31Bus
- 0.6%9Subway or elevated rail
- 0.2%3Long-distance train or commuter rail
- 0.8%12Light rail, streetcar or trolley
- 5.6%86Motorcycle
- 3.3%51Walked
- 3.9%59Other means
- 15.7%239Worked at home

Time leaving home to go to work
![Time leaving home to go to work]()
- 7712:00 a.m. to 4:59 a.m.
- 685:00 a.m. to 5:29 a.m.
- 535:30 a.m. to 5:59 a.m.
- 926:00 a.m. to 6:29 a.m.
- 1136:30 a.m. to 6:59 a.m.
- 1297:00 a.m. to 7:29 a.m.
- 617:30 a.m. to 7:59 a.m.
- 2348:00 a.m. to 8:29 a.m.
- 1258:30 a.m. to 8:59 a.m.
- 1969:00 a.m. to 9:59 a.m.
- 6210:00 a.m. to 10:59 a.m.
- 3511:00 a.m. to 11:59 a.m.
- 11812:00 p.m. to 3:59 p.m.
- 494:00 p.m. to 11:59 p.m.

Occupations of males:
- Percentage of males in management occupations (except farmers):
Here: 8.6% city: 13.0%
- Percentage of males in business and financial operations occupations:
Here: 2.4% city: 4.6%
- Percentage of males in computer and mathematical occupations:
Here: 10.3% city: 13.6%
- Percentage of males in architecture and engineering occupations:
Here: 13.0% city: 10.2%
- Percentage of males in life, physical, and social science occupations:
Here: 8.0% city: 1.1%
- Percentage of males in community and social services occupations:
Here: 1.6% city: 0.8%
- Percentage of males in education, training, and library occupations:
Here: 3.6% city: 2.8%
- Percentage of males in service occupations:
Here: 15.0% city: 12.7%
- Percentage of males in sales and office occupations:
Here: 12.5% city: 12.8%
- Percentage of males in construction, extraction, and maintenance occupations:
Here: 11.5% city: 7.8%
- Percentage of males in production occupations:
Here: 3.3% city: 5.5%
- Percentage of males in transportation occupations:
Here: 1.4% city: 3.6%
- Percentage of males in material moving occupations:
Here: 3.9% city: 3.1%
Occupations of females:
- Percentage of females in management occupations (except farmers):
Here: 8.0% city: 11.0%
- Percentage of females in business and financial operations occupations:
Here: 19.0% city: 8.6%
- Percentage of females in computer and mathematical occupations:
Here: 6.7% city: 5.4%
- Percentage of females in architecture and engineering occupations:
Here: 5.8% city: 2.8%
- Percentage of females in legal occupations:
Here: 1.0% city: 1.3%
- Percentage of females in education, training, and library occupations:
Here: 2.4% city: 8.1%
- Percentage of females in arts, design, entertainment, sports, and media occupations:
Here: 1.1% city: 2.0%
- Percentage of females in healthcare practitioners and technical occupations:
Here: 8.4% city: 6.8%
- Percentage of females in service occupations:
Here: 30.8% city: 21.7%
- Percentage of females in sales and office occupations:
Here: 7.4% city: 22.0%
- Percentage of females in production occupations:
Here: 9.2% city: 4.0%
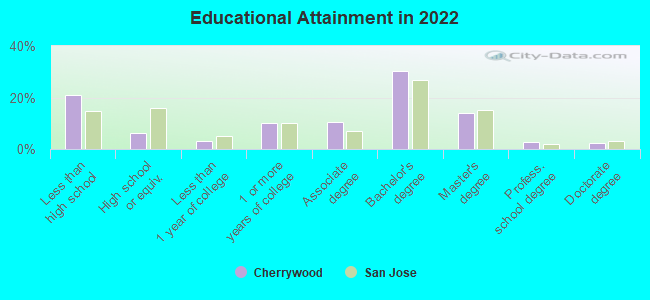
Education in this neighborhood (subdivision or community):
- Percentage of people 3 years and older in K-12 schools:
Cherrywood: 11.4% San Jose: 16.1%
- Percentage of people 3 years and older in undergraduate colleges:
Cherrywood: 9.4% San Jose: 6.5%
- Percentage of people 3 years and older in grad. or professional schools:
Cherrywood: 1.4% San Jose: 2.0%
- Percentage of students K-12 enrolled in private schools:
Cherrywood: 41.6% San Jose: 14.9%
Percentage of population below poverty level:
| Cherrywood: | 5.9% |
| San Jose: | 9.0% |
Median year owner moved in (as recorded in 2022):
Median year renter moved in (as recorded in 2022):
| Cherrywood: | 2001 |
| San Jose: | 2008 |
Median year renter moved in (as recorded in 2022):
| Cherrywood: | 2015 |
| San Jose: | 2020 |
Percentage of married-couple families with both working:
| Cherrywood: | 62.6% |
| San Jose: | 72.5% |
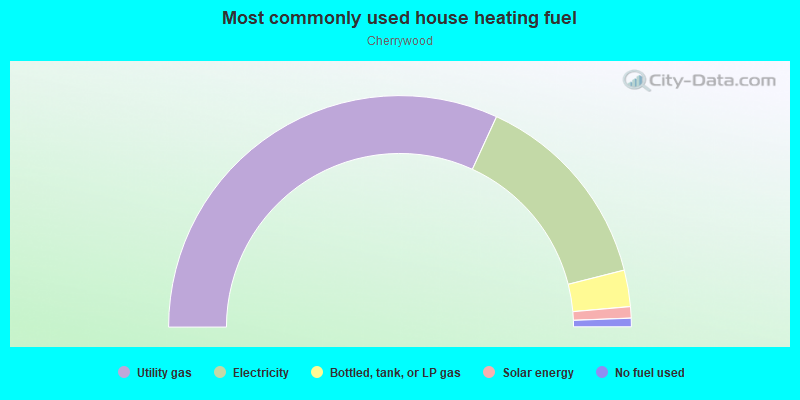
- 63.7%Utility gas
- 28.4%Electricity
- 5.1%Bottled, tank, or LP gas
- 1.6%Solar energy
- 1.2%No fuel used
Roads and streets:
Cam del Rey
Length: 0.37 miles
Direction: SW-NE
Address range: 2714 to 2899
Direction: SW-NE
Address range: 2714 to 2899
Sierra Rd
Length: 0.37 miles
Directions: E-W, SW-NE
Address range: 2500 to 2899
Directions: E-W, SW-NE
Address range: 2500 to 2899
Cabrillo Ave
Length: 0.37 miles
Directions: E-W, SE-NW, SW-NE
Address range: 1200 to 1499
Directions: E-W, SE-NW, SW-NE
Address range: 1200 to 1499
Somerset Park Cir
Length: 0.36 miles
Directions: E-W, N-S, SE-NW, SW-NE
Address range: 2601 to 2774
Directions: E-W, N-S, SE-NW, SW-NE
Address range: 2601 to 2774
Morrill Ave
Length: 0.36 miles
Direction: SE-NW
Address range: 1300 to 1399
Direction: SE-NW
Address range: 1300 to 1399
San Marcos Dr
Length: 0.35 miles
Direction: SE-NW
Address range: 1300 to 1499
Direction: SE-NW
Address range: 1300 to 1499
Mosswood Dr
Length: 0.28 miles
Directions: N-S, SE-NW, SW-NE
Address range: 2600 to 2799
Directions: N-S, SE-NW, SW-NE
Address range: 2600 to 2799
Monte Cresta Way
Length: 0.25 miles
Directions: E-W, SE-NW, SW-NE
Address range: 2800 to 2899
Directions: E-W, SE-NW, SW-NE
Address range: 2800 to 2899
Lucena Dr
Length: 0.24 miles
Directions: E-W, SW-NE
Address range: 2771 to 2899
Directions: E-W, SW-NE
Address range: 2771 to 2899
Heritage Park Cir
Length: 0.24 miles
Directions: E-W, N-S, SE-NW, SW-NE
Address range: 2600 to 2699
Directions: E-W, N-S, SE-NW, SW-NE
Address range: 2600 to 2699
Gomes Dr
Length: 0.20 miles
Directions: E-W, SW-NE
Address range: 2600 to 2799
Directions: E-W, SW-NE
Address range: 2600 to 2799
Havenwood Dr
Length: 0.19 miles
Direction: SE-NW
Address range: 1300 to 1399
Direction: SE-NW
Address range: 1300 to 1399
Greengate Dr
Length: 0.17 miles
Direction: SW-NE
Address range: 2455 to 2599
Direction: SW-NE
Address range: 2455 to 2599
Caliente Way
Length: 0.14 miles
Directions: E-W, N-S, SE-NW
Address range: 1400 to 1499
Directions: E-W, N-S, SE-NW
Address range: 1400 to 1499
Lodestone Dr
Length: 0.13 miles
Directions: N-S, SE-NW
Address range: 1277 to 1299
Directions: N-S, SE-NW
Address range: 1277 to 1299
Bonnet Ct
Length: 0.08 miles
Directions: N-S, SE-NW, SW-NE
Address range: 1300 to 1399
Directions: N-S, SE-NW, SW-NE
Address range: 1300 to 1399
San Marcos Ct
Length: 0.06 miles
Direction: SW-NE
Address range: 700 to 2699
Direction: SW-NE
Address range: 700 to 2699
Lucena Ct
Length: 0.05 miles
Direction: SE-NW
Address range: 1400 to 1499
Direction: SE-NW
Address range: 1400 to 1499