Cheesman Park neighborhood in Denver, Colorado (CO), 80206, 80218 detailed profile
Settings
X


Business Search - 14 Million verified businesses
Area: 0.519 square miles
Population: 8,742
Population density:
| Cheesman Park: | 16,829 people per square mile |
| Denver: | 4,651 people per square mile |

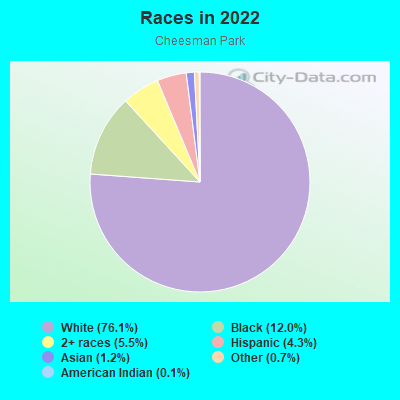
- 7,21476.1%White
- 1,13612.0%Black
- 5195.5%Two or more races
- 4094.3%Hispanic or Latino
- 1181.2%Asian
- 700.7%Some other race
- 120.1%American Indian
Median household income in 2022:
| Cheesman Park: | $63,569 |
| Denver: | $88,213 |
Distribution of median household income
![Distribution of median household income]()
- 656Less than $10,000
- 487$10,000 to $19,999
- 455$20,000 to $29,999
- 500$30,000 to $39,999
- 755$40,000 to $49,999
- 353$50,000 to $59,999
- 597$60,000 to $74,999
- 714$75,000 to $99,999
- 329$100,000 to $124,999
- 547$125,000 to $149,999
- 552$150,000 to $199,999
- 512$200,000 or more

Distribution of owner-occupied house/condo value
![Distribution of owner-occupied house/condo value]()
- 108$100,000 to $149,999
- 55$150,000 to $199,999
- 29$200,000 to $249,999
- 236$250,000 to $299,999
- 712$300,000 to $399,999
- 346$400,000 to $499,999
- 359$500,000 to $749,999
- 170$750,000 to $999,999
- 492$1,000,000 or more

Distribution of rent paid by renters
![Distribution of rent paid by renters]()
- 128$100 to $199
- 300$200 to $299
- 109$300 to $399
- 340$400 to $499
- 443$600 to $699
- 42$700 to $799
- 759$800 to $899
- 544$900 to $999
- 499$1,000 to $1,249
- 927$1,250 to $1,499
- 1,129$1,500 to $1,999
- 1,191$2,000 or more

Median rent in 2022:
| Cheesman Park: | $1,594 |
| Denver: | $1,623 |
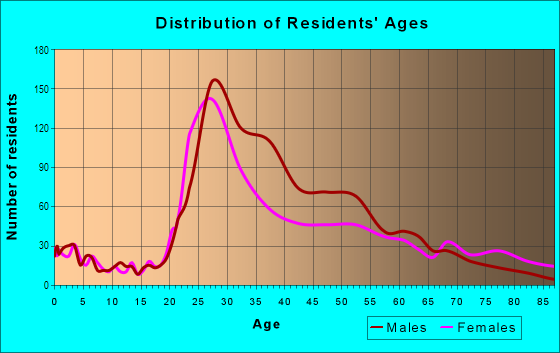
| Males: | 4,523 |
| Females: | 4,219 |
Males:
| This neighborhood: | 41.4 years |
| Whole city: | 35.2 years |
| This neighborhood: | 43.9 years |
| Whole city: | 35.1 years |
Average household size:
| Cheesman Park: | 1.4 people |
| Denver: | 28.0 people |
Percentage of family households:
| Cheesman Park: | 14.4% |
| Denver: | 35.1% |
| Here: | 19.7% |
| Denver: | 32.5% |
Percentage of married-couple families with children (among all households):
| Cheesman Park: | 64.6% |
| Denver: | 32.4% |
Percentage of single-mother households (among all households):
| Cheesman Park: | 69.1% |
| Denver: | 10.3% |
Percentage of never married males 15 years old and over:
Percentage of never married females 15 years old and over:
| Cheesman Park: | 26.4% |
| Denver: | 25.0% |
Percentage of never married females 15 years old and over:
| Cheesman Park: | 25.0% |
| city: | 20.8% |
Percentage of people that speak English not well or not at all:
| Cheesman Park: | 0.0% |
| Denver: | 3.9% |
Percentage of people born in this state:
Percentage of people born in another U.S. state:
Percentage of native residents but born outside the U.S.:
Percentage of foreign born residents:
| Here: | 19.4% |
| Denver: | 38.5% |
Percentage of people born in another U.S. state:
| Cheesman Park: | 74.2% |
| Denver: | 46.1% |
Percentage of native residents but born outside the U.S.:
| Here: | 1.6% |
| city: | 1.7% |
Percentage of foreign born residents:
| Here: | 4.8% |
| Denver: | 13.8% |
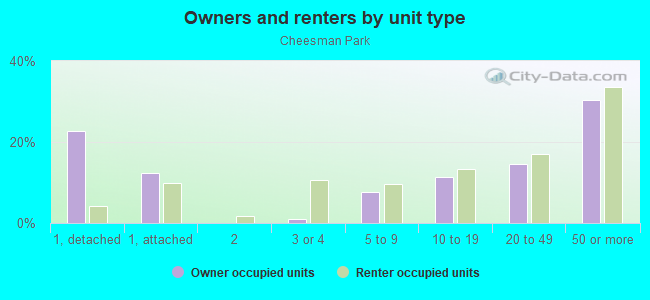
Owner-occupied
Renter-occupied

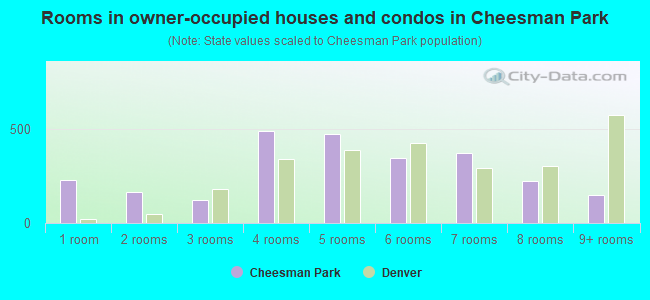
- Rooms in owner-occupied houses and condos in Cheesman Park
- 2291 room
- 1682 rooms
- 1253 rooms
- 4944 rooms
- 4755 rooms
- 3476 rooms
- 3757 rooms
- 2238 rooms
- 1499+ rooms
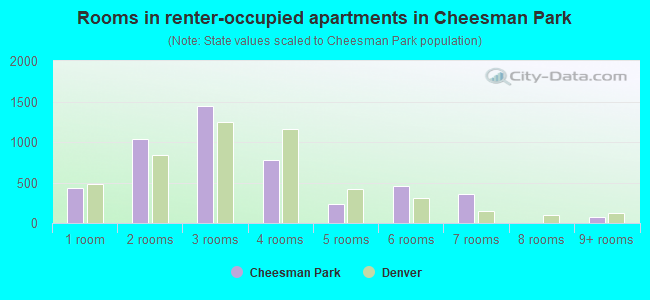
- Rooms in renter-occupied apartments in Cheesman Park
- 4371 room
- 1,0422 rooms
- 1,4413 rooms
- 7764 rooms
- 2405 rooms
- 4526 rooms
- 3647 rooms
- 08 rooms
- 689+ rooms
Owner-occupied
Renter-occupied
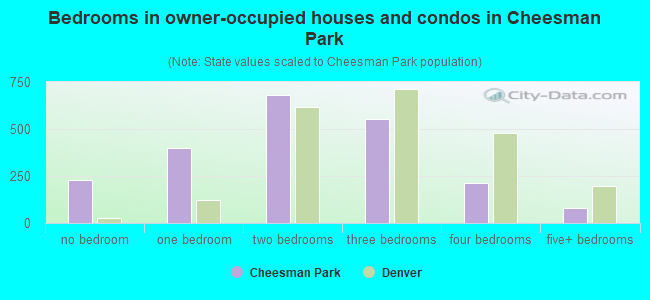
- Bedrooms in owner-occupied houses and condos in Cheesman Park
- 229no bedroom
- 4011 bedroom
- 6792 bedrooms
- 5553 bedrooms
- 2124 bedrooms
- 805+ bedrooms
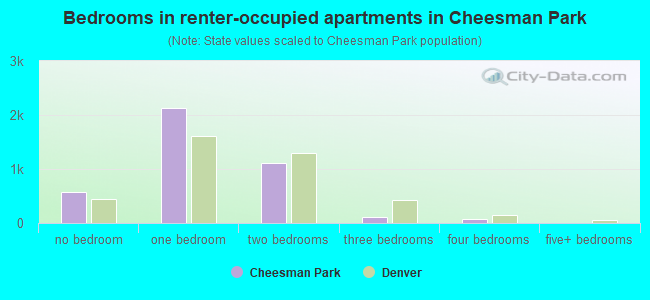
- Bedrooms in renter-occupied apartments in Cheesman Park
- 569no bedroom
- 2,1231 bedroom
- 1,1192 bedrooms
- 1053 bedrooms
- 684 bedrooms
- 05+ bedrooms
Average number of cars or other vehicles available in houses/condos:
Average number of cars or other vehicles available in apartments:
| This neighborhood: | 1.6 |
| Denver: | 1.9 |
Average number of cars or other vehicles available in apartments:
| Here: | 1.1 |
| city: | 1.3 |
Percentage of units with a mortgage:
| Cheesman Park: | 77.5% |
| Denver: | 75.6% |
Housing prices:
- Average estimated value of detached houses in 2022 (11.6% of all units):
Cheesman Park: $1,141,545 Colorado: $676,667
- Average estimated '22 value of housing units in 5-or-more-unit structures (39.5% of all units):
Cheesman Park: $346,951 Colorado: $417,586
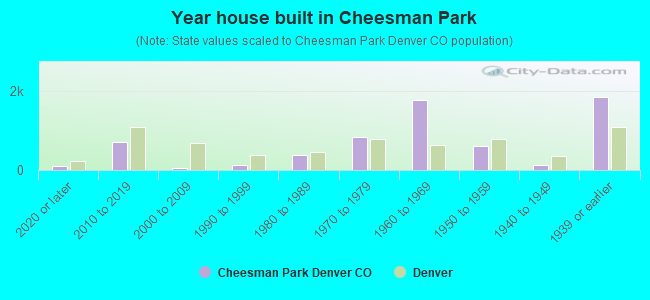
- Year house built in Cheesman Park
- 1072020 or later
- 7032010 to 2019
- 492000 to 2009
- 1381990 to 1999
- 3721980 to 1989
- 8241970 to 1979
- 1,7531960 to 1969
- 5941950 to 1959
- 1141940 to 1949
- 1,8301939 or earlier
City-data.com crime index for city in 2020 (higher means more crime):
| City: | 519.0 |
| U.S. average: | 219.5 |
Travel time to work (commute)
![Travel time to work (commute)]()
- 61Less than 5 minutes
- 3805 to 9 minutes
- 1,13310 to 14 minutes
- 1,18115 to 19 minutes
- 1,01920 to 24 minutes
- 44425 to 29 minutes
- 39930 to 34 minutes
- 6635 to 39 minutes
- 22340 to 44 minutes
- 47445 to 59 minutes
- 13860 to 89 minutes
- 3790 or more minutes

Means of transportation to work
![Means of transportation to work]()
- 62.1%3,978Drove a car alone
- 2.4%151Carpooled
- 9.5%608Bus
- 0.3%20Subway or elevated rail
- 3.2%204Light rail, streetcar or trolley
- 1.1%70Taxi
- 0.2%10Motorcycle
- 3.1%200Bicycle
- 8.2%527Walked
- 1.2%77Other means
- 13.0%836Worked at home

Time leaving home to go to work
![Time leaving home to go to work]()
- 12212:00 a.m. to 4:59 a.m.
- 585:00 a.m. to 5:29 a.m.
- 2585:30 a.m. to 5:59 a.m.
- 5076:00 a.m. to 6:29 a.m.
- 4076:30 a.m. to 6:59 a.m.
- 8777:00 a.m. to 7:29 a.m.
- 4087:30 a.m. to 7:59 a.m.
- 1,1178:00 a.m. to 8:29 a.m.
- 3778:30 a.m. to 8:59 a.m.
- 2639:00 a.m. to 9:59 a.m.
- 42510:00 a.m. to 10:59 a.m.
- 14911:00 a.m. to 11:59 a.m.
- 24212:00 p.m. to 3:59 p.m.
- 3434:00 p.m. to 11:59 p.m.

Occupations of males:
- Percentage of males in management occupations (except farmers):
Here: 12.7% city: 15.4%
- Percentage of males in business and financial operations occupations:
Here: 8.9% city: 8.3%
- Percentage of males in computer and mathematical occupations:
Here: 3.1% city: 7.4%
- Percentage of males in architecture and engineering occupations:
Here: 3.3% city: 4.5%
- Percentage of males in life, physical, and social science occupations:
Here: 1.8% city: 1.4%
- Percentage of males in community and social services occupations:
Here: 3.2% city: 0.9%
- Percentage of males in legal occupations:
Here: 7.9% city: 2.3%
- Percentage of males in education, training, and library occupations:
Here: 7.1% city: 3.1%
- Percentage of males in arts, design, entertainment, sports, and media occupations:
Here: 7.2% city: 3.1%
- Percentage of males in healthcare practitioners and technical occupations:
Here: 4.5% city: 3.5%
- Percentage of males in service occupations:
Here: 15.5% city: 11.9%
- Percentage of males in sales and office occupations:
Here: 10.8% city: 15.4%
- Percentage of males in farming, fishing, and forestry occupations:
Here: 3.9% city: 0.3%
- Percentage of males in production occupations:
Here: 1.4% city: 3.2%
- Percentage of males in material moving occupations:
Here: 7.4% city: 3.5%
Occupations of females:
- Percentage of females in management occupations (except farmers):
Here: 13.2% city: 14.0%
- Percentage of females in business and financial operations occupations:
Here: 4.0% city: 10.0%
- Percentage of females in computer and mathematical occupations:
Here: 2.2% city: 2.9%
- Percentage of females in architecture and engineering occupations:
Here: 4.8% city: 1.5%
- Percentage of females in life, physical, and social science occupations:
Here: 6.6% city: 1.5%
- Percentage of females in community and social services occupations:
Here: 8.4% city: 3.0%
- Percentage of females in legal occupations:
Here: 2.5% city: 2.4%
- Percentage of females in education, training, and library occupations:
Here: 16.7% city: 7.9%
- Percentage of females in arts, design, entertainment, sports, and media occupations:
Here: 1.9% city: 3.8%
- Percentage of females in healthcare practitioners and technical occupations:
Here: 10.5% city: 10.2%
- Percentage of females in service occupations:
Here: 10.5% city: 16.2%
- Percentage of females in sales and office occupations:
Here: 14.4% city: 21.4%
- Percentage of females in material moving occupations:
Here: 4.4% city: 1.4%
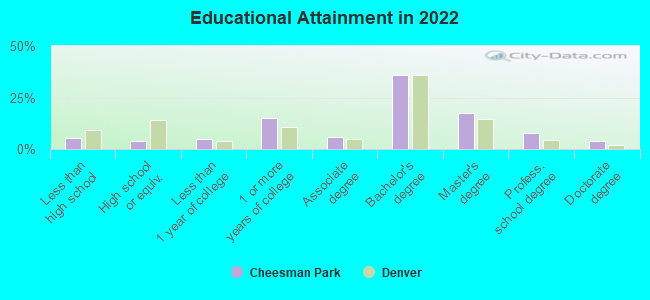
Education in this neighborhood (subdivision or community):
- Percentage of people 3 years and older in K-12 schools:
Cheesman Park: 10.4% Denver: 12.7%
- Percentage of people 3 years and older in undergraduate colleges:
Cheesman Park: 5.1% Denver: 4.1%
- Percentage of people 3 years and older in grad. or professional schools:
Cheesman Park: 4.0% Denver: 2.2%
- Percentage of students K-12 enrolled in private schools:
Cheesman Park: 23.7% Denver: 11.0%
Percentage of population below poverty level:
| Cheesman Park: | 9.2% |
| Denver: | 11.8% |
Median year owner moved in (as recorded in 2022):
| Cheesman Park: | 2005 |
| Denver: | 2014 |
Percentage of married-couple families with both working:
| Cheesman Park: | 118.4% |
| Denver: | 74.1% |
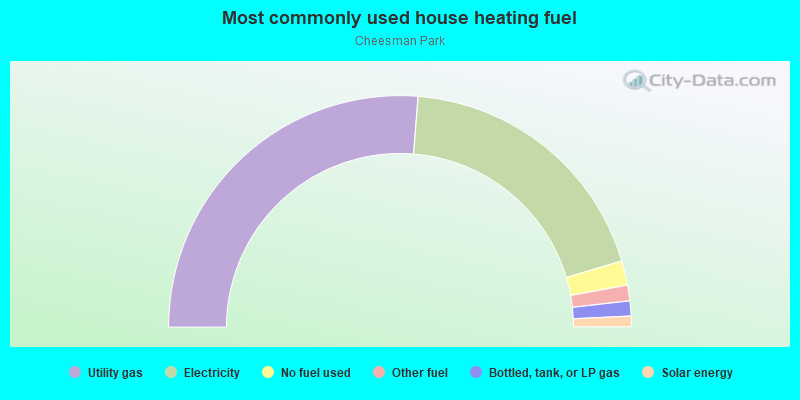
- 52.5%Utility gas
- 38.3%Electricity
- 3.4%No fuel used
- 2.2%Other fuel
- 2.1%Bottled, tank, or LP gas
- 1.5%Solar energy
Roads and streets:
E 14th Ave
Length: 0.83 miles
Direction: E-W
Address range: 1300 to 2299
Direction: E-W
Address range: 1300 to 2299
E 13th Ave
Length: 0.83 miles
Direction: E-W
Address range: 1300 to 2299
Direction: E-W
Address range: 1300 to 2299
High St
Length: 0.70 miles
Directions: N-S, SE-NW, SW-NE
Address range: 800 to 1399
Directions: N-S, SE-NW, SW-NE
Address range: 800 to 1399
Humboldt St
Length: 0.64 miles
Direction: N-S
Address range: 800 to 1399
Direction: N-S
Address range: 800 to 1399
Marion St
Length: 0.64 miles
Direction: N-S
Address range: 800 to 1399
Direction: N-S
Address range: 800 to 1399
Lafayette St
Length: 0.64 miles
Direction: N-S
Address range: 800 to 1399
Direction: N-S
Address range: 800 to 1399
E 9th Ave
Length: 0.62 miles
Direction: E-W
Address range: 1252 to 2299
Direction: E-W
Address range: 1252 to 2299
E 11th Ave
Length: 0.58 miles
Directions: E-W, SW-NE
Address range: 1300 to 2299
Directions: E-W, SW-NE
Address range: 1300 to 2299
E 12th Ave
Length: 0.55 miles
Direction: E-W
Address range: 1300 to 2299
Direction: E-W
Address range: 1300 to 2299
Gaylord St
Length: 0.51 miles
Direction: N-S
Address range: 800 to 1399
Direction: N-S
Address range: 800 to 1399
Race St
Length: 0.51 miles
Direction: N-S
Address range: 800 to 1399
Direction: N-S
Address range: 800 to 1399
Vine St
Length: 0.50 miles
Direction: N-S
Address range: 800 to 1399
Direction: N-S
Address range: 800 to 1399
E 10th Ave
Length: 0.25 miles
Direction: E-W
Address range: 1252 to 1541
Direction: E-W
Address range: 1252 to 1541
Franklin St
Length: 0.23 miles
Directions: E-W, N-S, SE-NW
Address range: 1300 to 1399
Directions: E-W, N-S, SE-NW
Address range: 1300 to 1399
Gilpin St
Length: 0.16 miles
Direction: N-S
Address range: 1280 to 1399
Direction: N-S
Address range: 1280 to 1399
Williams St
Length: 0.12 miles
Direction: N-S
Address range: 1201 to 1399
Direction: N-S
Address range: 1201 to 1399
York St
Length: 0.10 miles
Direction: N-S
Address range: 800 to 899
Direction: N-S
Address range: 800 to 899