Chaparral Ranch I neighborhood in Glendale, Arizona (AZ), 85302 detailed profile
Settings
X


Business Search - 14 Million verified businesses
Area: 0.039 square miles
Population: 796
Population density:
| Chaparral Ranch I: | 20,456 people per square mile |
| Glendale: | 4,528 people per square mile |

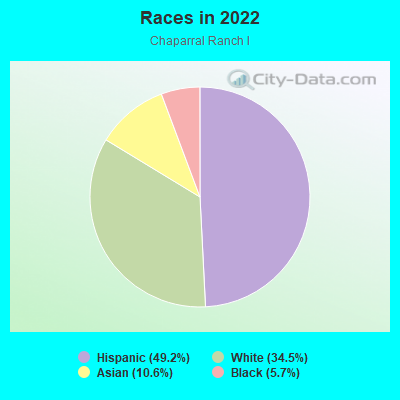
- 39149.2%Hispanic or Latino
- 27434.5%White
- 8410.6%Asian
- 455.7%Black
Median household income in 2022:
| Chaparral Ranch I: | $28,912 |
| Glendale: | $72,411 |
Distribution of median household income
![Distribution of median household income]()
- 37Less than $10,000
- 23$10,000 to $19,999
- 75$20,000 to $29,999
- 9$30,000 to $39,999
- 9$40,000 to $49,999
- 2$50,000 to $59,999
- 22$60,000 to $74,999
- 30$75,000 to $99,999
- 5$100,000 to $124,999
- 5$125,000 to $149,999
- 20$150,000 to $199,999
- 12$200,000 or more

Distribution of owner-occupied house/condo value
![Distribution of owner-occupied house/condo value]()
- 15Less than $50,000
- 12$50,000 to $99,999
- 10$100,000 to $149,999
- 11$150,000 to $199,999
- 49$200,000 to $249,999
- 11$250,000 to $299,999
- 20$300,000 to $399,999
- 5$400,000 to $499,999
- 1$500,000 to $749,999

Distribution of rent paid by renters
![Distribution of rent paid by renters]()
- 2$100 to $199
- 25$500 to $599
- 26$700 to $799
- 18$800 to $899
- 13$900 to $999
- 3$1,000 to $1,249
- 15$1,250 to $1,499
- 15$1,500 to $1,999
- 3$2,000 or more

Median rent in 2022:
| Chaparral Ranch I: | $839 |
| Glendale: | $1,244 |
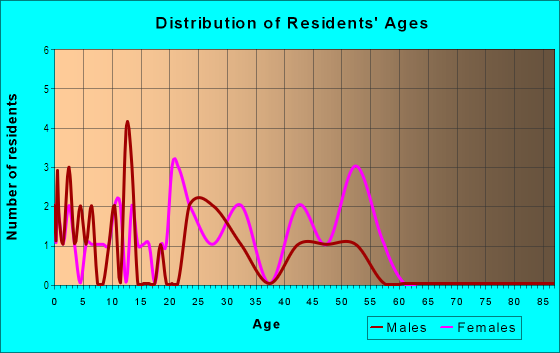
| Males: | 365 |
| Females: | 431 |
Males:
| This neighborhood: | 36.0 years |
| Whole city: | 32.1 years |
| This neighborhood: | 34.6 years |
| Whole city: | 35.7 years |
Average household size:
| Chaparral Ranch I: | 3.3 people |
| Glendale: | 2.8 people |
Percentage of family households:
| Chaparral Ranch I: | 69.5% |
| Glendale: | 49.0% |
| Here: | 56.3% |
| Glendale: | 47.7% |
Percentage of married-couple families with children (among all households):
| Chaparral Ranch I: | 18.3% |
| Glendale: | 24.1% |
Percentage of single-mother households (among all households):
| Chaparral Ranch I: | 8.7% |
| Glendale: | 8.0% |
Percentage of never married males 15 years old and over:
Percentage of never married females 15 years old and over:
| Chaparral Ranch I: | 12.5% |
| Glendale: | 20.8% |
Percentage of never married females 15 years old and over:
| Chaparral Ranch I: | 20.6% |
| city: | 17.2% |
Percentage of people that speak English not well or not at all:
| Chaparral Ranch I: | 21.1% |
| Glendale: | 8.0% |
Percentage of people born in this state:
Percentage of people born in another U.S. state:
Percentage of native residents but born outside the U.S.:
Percentage of foreign born residents:
| Here: | 44.7% |
| Glendale: | 42.8% |
Percentage of people born in another U.S. state:
| Chaparral Ranch I: | 32.5% |
| Glendale: | 38.1% |
Percentage of native residents but born outside the U.S.:
| Here: | 3.0% |
| city: | 0.7% |
Percentage of foreign born residents:
| Here: | 19.8% |
| Glendale: | 18.5% |
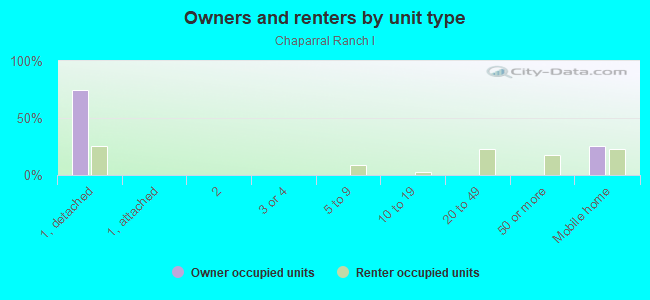
Owner-occupied
Renter-occupied

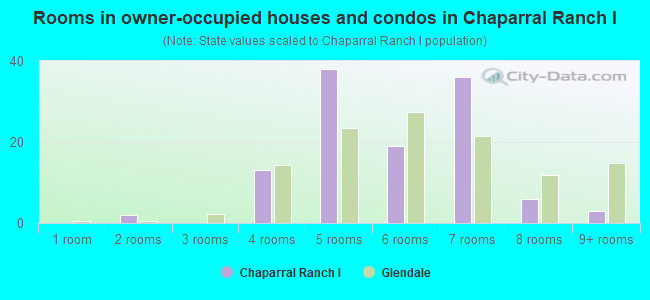
- Rooms in owner-occupied houses and condos in Chaparral Ranch I
- 01 room
- 22 rooms
- 03 rooms
- 134 rooms
- 385 rooms
- 196 rooms
- 367 rooms
- 68 rooms
- 39+ rooms
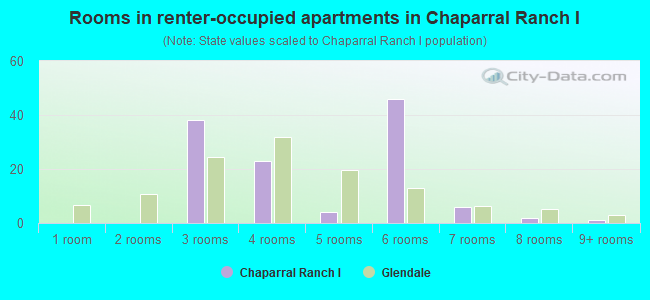
- Rooms in renter-occupied apartments in Chaparral Ranch I
- 01 room
- 02 rooms
- 383 rooms
- 234 rooms
- 45 rooms
- 466 rooms
- 67 rooms
- 28 rooms
- 19+ rooms
Owner-occupied
Renter-occupied
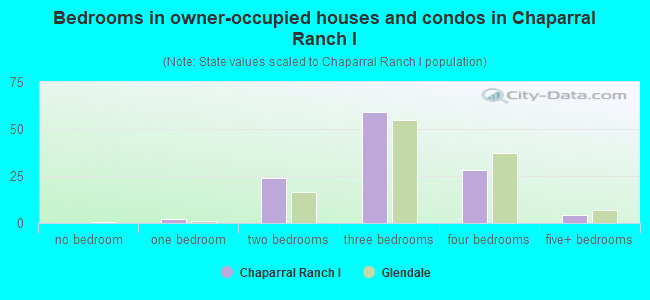
- Bedrooms in owner-occupied houses and condos in Chaparral Ranch I
- 0no bedroom
- 21 bedroom
- 242 bedrooms
- 593 bedrooms
- 284 bedrooms
- 45+ bedrooms
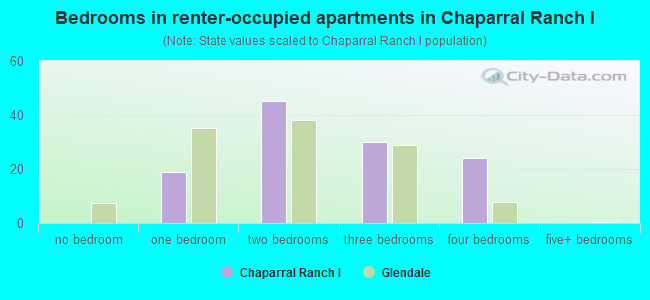
- Bedrooms in renter-occupied apartments in Chaparral Ranch I
- 0no bedroom
- 191 bedroom
- 452 bedrooms
- 303 bedrooms
- 244 bedrooms
- 05+ bedrooms
Average number of cars or other vehicles available in houses/condos:
Average number of cars or other vehicles available in apartments:
| This neighborhood: | 2.4 |
| Glendale: | 2.3 |
Average number of cars or other vehicles available in apartments:
| Here: | 1.7 |
| city: | 1.6 |
Percentage of units with a mortgage:
| Chaparral Ranch I: | 70.0% |
| Glendale: | 65.9% |
Housing prices:
- Average estimated value of detached houses in 2022 (48.6% of all units):
Chaparral Ranch I: $260,537 Glendale: $364,476
- Average estimated value of mobile home in 2022 (26.1% of all units):
Chaparral Ranch I: $99,228 Glendale: $43,482
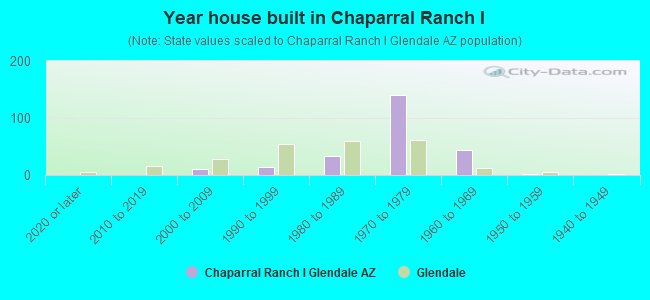
- Year house built in Chaparral Ranch I
- 02020 or later
- 02010 to 2019
- 112000 to 2009
- 141990 to 1999
- 331980 to 1989
- 1411970 to 1979
- 441960 to 1969
- 11950 to 1959
- 01940 to 1949
- 01939 or earlier
City-data.com crime index for city in 2020 (higher means more crime):
| City: | 268.2 |
| U.S. average: | 219.5 |
Travel time to work (commute)
![Travel time to work (commute)]()
- 5Less than 5 minutes
- 95 to 9 minutes
- 810 to 14 minutes
- 2915 to 19 minutes
- 1620 to 24 minutes
- 1225 to 29 minutes
- 3030 to 34 minutes
- 935 to 39 minutes
- 640 to 44 minutes
- 4245 to 59 minutes
- 360 to 89 minutes
- 190 or more minutes

Means of transportation to work
![Means of transportation to work]()
- 70.2%198Drove a car alone
- 17.7%50Carpooled
- 1.1%3Bus
- 0.4%1Bicycle
- 0.4%1Walked
- 0.7%2Other means
- 10.6%30Worked at home

Time leaving home to go to work
![Time leaving home to go to work]()
- 2612:00 a.m. to 4:59 a.m.
- 135:00 a.m. to 5:29 a.m.
- 65:30 a.m. to 5:59 a.m.
- 146:00 a.m. to 6:29 a.m.
- 216:30 a.m. to 6:59 a.m.
- 47:00 a.m. to 7:29 a.m.
- 27:30 a.m. to 7:59 a.m.
- 88:00 a.m. to 8:29 a.m.
- 38:30 a.m. to 8:59 a.m.
- 179:00 a.m. to 9:59 a.m.
- 110:00 a.m. to 10:59 a.m.
- 1212:00 p.m. to 3:59 p.m.
- 134:00 p.m. to 11:59 p.m.

Occupations of males:
- Percentage of males in management occupations (except farmers):
Here: 10.6% city: 8.8%
- Percentage of males in business and financial operations occupations:
Here: 16.7% city: 3.3%
- Percentage of males in computer and mathematical occupations:
Here: 2.9% city: 3.7%
- Percentage of males in architecture and engineering occupations:
Here: 4.6% city: 2.2%
- Percentage of males in community and social services occupations:
Here: 14.6% city: 1.2%
- Percentage of males in education, training, and library occupations:
Here: 146.4% city: 2.5%
- Percentage of males in arts, design, entertainment, sports, and media occupations:
Here: 1.9% city: 0.9%
- Percentage of males in healthcare practitioners and technical occupations:
Here: 3.7% city: 3.6%
- Percentage of males in service occupations:
Here: 7.1% city: 15.4%
- Percentage of males in sales and office occupations:
Here: 14.0% city: 17.3%
- Percentage of males in construction, extraction, and maintenance occupations:
Here: 14.2% city: 11.6%
- Percentage of males in production occupations:
Here: 18.3% city: 6.8%
- Percentage of males in transportation occupations:
Here: 5.0% city: 7.3%
- Percentage of males in material moving occupations:
Here: 4.6% city: 6.7%
Occupations of females:
- Percentage of females in management occupations (except farmers):
Here: 35.9% city: 8.1%
- Percentage of females in business and financial operations occupations:
Here: 5.8% city: 6.3%
- Percentage of females in life, physical, and social science occupations:
Here: 3.1% city: 0.4%
- Percentage of females in legal occupations:
Here: 3.1% city: 0.8%
- Percentage of females in education, training, and library occupations:
Here: 3.7% city: 7.8%
- Percentage of females in healthcare practitioners and technical occupations:
Here: 6.0% city: 7.6%
- Percentage of females in service occupations:
Here: 49.6% city: 22.9%
- Percentage of females in sales and office occupations:
Here: 20.9% city: 31.4%
- Percentage of females in construction, extraction, and maintenance occupations:
Here: 33.7% city: 0.5%
- Percentage of females in production occupations:
Here: 5.6% city: 3.8%
- Percentage of females in transportation occupations:
Here: 20.2% city: 1.5%
- Percentage of females in material moving occupations:
Here: 2.3% city: 3.5%
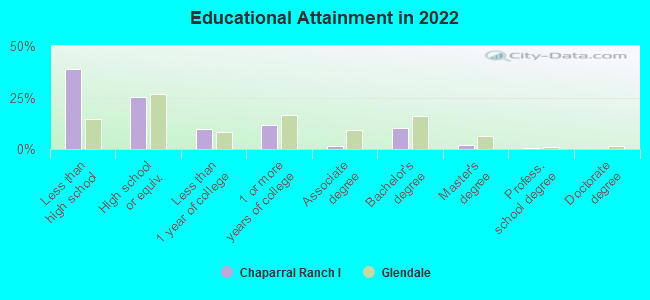
Education in this neighborhood (subdivision or community):
- Percentage of people 3 years and older in K-12 schools:
Chaparral Ranch I: 25.3% Glendale: 17.4%
- Percentage of people 3 years and older in undergraduate colleges:
Chaparral Ranch I: 4.8% Glendale: 5.4%
- Percentage of people 3 years and older in grad. or professional schools:
Chaparral Ranch I: 0.5% Glendale: 1.5%
- Percentage of students K-12 enrolled in private schools:
Chaparral Ranch I: 11.0% Glendale: 8.6%
Percentage of population below poverty level:
| Chaparral Ranch I: | 27.5% |
| Glendale: | 15.0% |
Median year owner moved in (as recorded in 2022):
Median year renter moved in (as recorded in 2022):
| Chaparral Ranch I: | 2009 |
| Glendale: | 2012 |
Median year renter moved in (as recorded in 2022):
| Chaparral Ranch I: | 2016 |
| Glendale: | 2020 |
Percentage of married-couple families with both working:
| Chaparral Ranch I: | 40.7% |
| Glendale: | 55.7% |
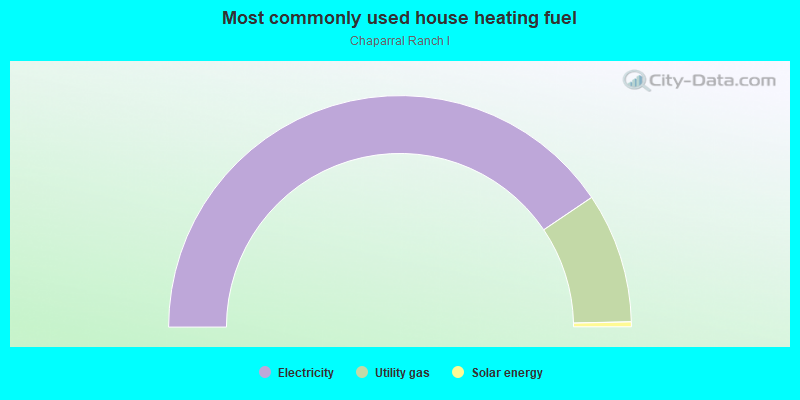
- 81.1%Electricity
- 18.2%Utility gas
- 0.7%Solar energy
Roads and streets:
W Brown St
Length: 0.20 miles
Direction: E-W
Address range: 6600 to 6642
Direction: E-W
Address range: 6600 to 6642
W Cheryl Dr
Length: 0.16 miles
Direction: E-W
Address range: 6601 to 6649
Direction: E-W
Address range: 6601 to 6649
N 66th Ln
Length: 0.11 miles
Direction: N-S
Address range: 10200 to 10299
Direction: N-S
Address range: 10200 to 10299
N 66th Ave
Length: 0.11 miles
Direction: N-S
Address range: 10200 to 10299
Direction: N-S
Address range: 10200 to 10299
N 66th Dr
Length: 0.07 miles
Directions: N-S, SE-NW
Address range: 10200 to 10299
Directions: N-S, SE-NW
Address range: 10200 to 10299
N 65th Ln
Length: 0.06 miles
Direction: N-S
Address range: 10196 to 10303
Direction: N-S
Address range: 10196 to 10303
W Beryl Ave
Length: 0.05 miles
Directions: E-W, SE-NW, SW-NE
Address range: 6600 to 6699
Directions: E-W, SE-NW, SW-NE
Address range: 6600 to 6699