Chantilley neighborhood in San Jose, California (CA), 95139 detailed profile
Settings
X

Business Search - 14 Million verified businesses
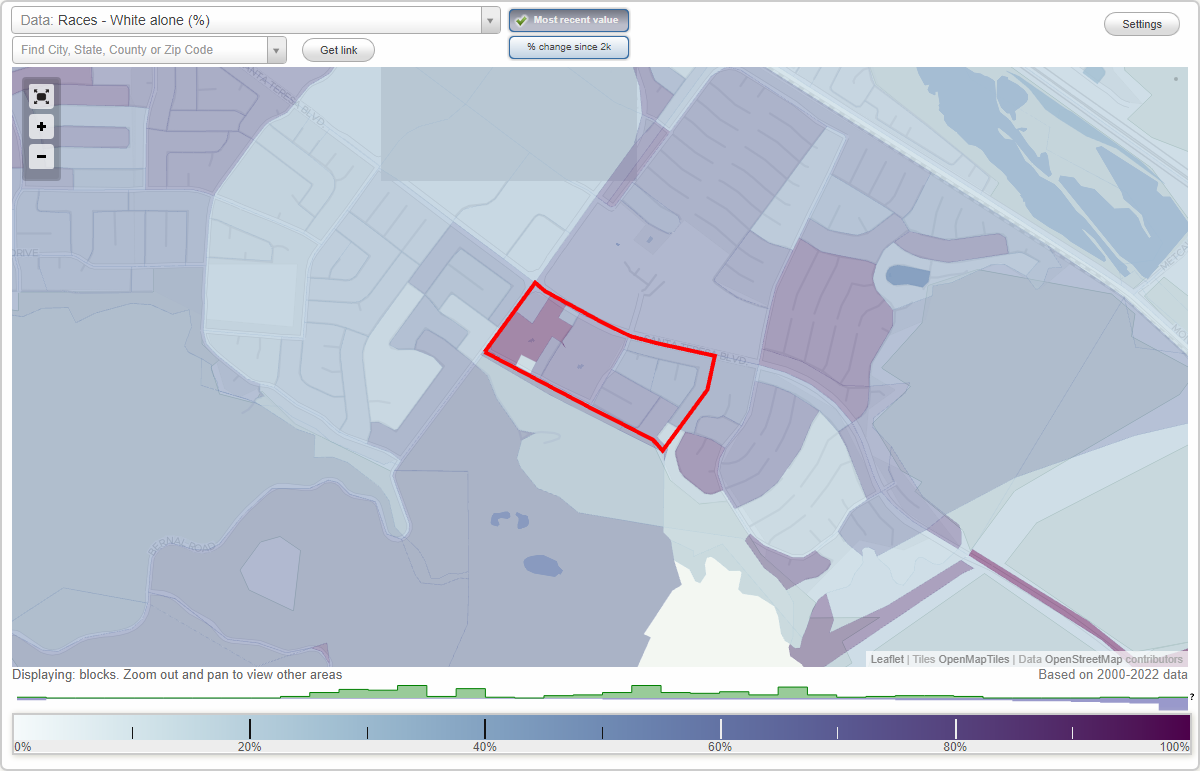
Area: 0.098 square miles
Population: 989
Population density:
| Chantilley: | 10,075 people per square mile |
| San Jose: | 5,554 people per square mile |

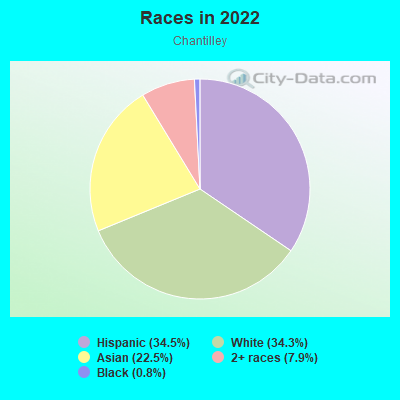
- 34234.5%Hispanic or Latino
- 34034.3%White
- 22322.5%Asian
- 787.9%Two or more races
- 80.8%Black
Median household income in 2022:
| Chantilley: | $172,392 |
| San Jose: | $133,835 |
Distribution of median household income
![Distribution of median household income]()
- 2Less than $10,000
- 20$10,000 to $19,999
- 11$20,000 to $29,999
- 18$30,000 to $39,999
- 20$40,000 to $49,999
- 14$50,000 to $59,999
- 3$60,000 to $74,999
- 65$75,000 to $99,999
- 45$100,000 to $124,999
- 28$125,000 to $149,999
- 22$150,000 to $199,999
- 153$200,000 or more

Distribution of owner-occupied house/condo value
![Distribution of owner-occupied house/condo value]()
- 3Less than $50,000
- 2$100,000 to $149,999
- 3$250,000 to $299,999
- 4$400,000 to $499,999
- 93$500,000 to $749,999
- 122$750,000 to $999,999
- 116$1,000,000 or more

Distribution of rent paid by renters
![Distribution of rent paid by renters]()
- 4$600 to $699
- 11$700 to $799
- 6$800 to $899
- 14$1,000 to $1,249
- 115$2,000 or more

Median rent in 2022:
| Chantilley: | $2,983 |
| San Jose: | $2,001 |
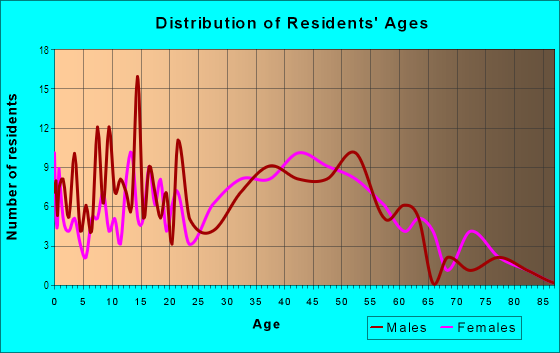
| Males: | 560 |
| Females: | 428 |
Males:
| This neighborhood: | 40.0 years |
| Whole city: | 37.6 years |
| This neighborhood: | 39.2 years |
| Whole city: | 39.1 years |
Average household size:
| Chantilley: | 17.0 people |
| San Jose: | 2.9 people |
Percentage of family households:
| Chantilley: | 55.9% |
| San Jose: | 49.9% |
| Here: | 37.0% |
| San Jose: | 53.0% |
Percentage of married-couple families with children (among all households):
| Chantilley: | 22.5% |
| San Jose: | 25.8% |
Percentage of single-mother households (among all households):
| Chantilley: | 11.0% |
| San Jose: | 5.2% |
Percentage of never married males 15 years old and over:
Percentage of never married females 15 years old and over:
| Chantilley: | 28.6% |
| San Jose: | 20.9% |
Percentage of never married females 15 years old and over:
| Chantilley: | 8.4% |
| city: | 16.7% |
Percentage of people that speak English not well or not at all:
| Chantilley: | 3.7% |
| San Jose: | 11.4% |
Percentage of people born in this state:
Percentage of people born in another U.S. state:
Percentage of native residents but born outside the U.S.:
Percentage of foreign born residents:
| Here: | 57.6% |
| San Jose: | 46.1% |
Percentage of people born in another U.S. state:
| Chantilley: | 12.4% |
| San Jose: | 10.4% |
Percentage of native residents but born outside the U.S.:
| Here: | 0.8% |
| city: | 1.7% |
Percentage of foreign born residents:
| Here: | 29.2% |
| San Jose: | 41.8% |
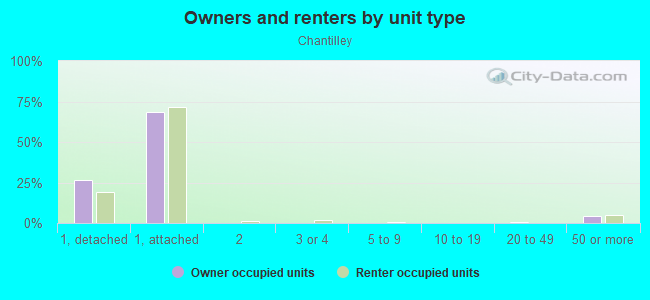
Owner-occupied
Renter-occupied

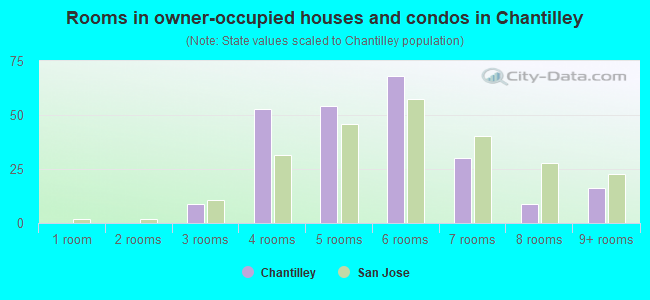
- Rooms in owner-occupied houses and condos in Chantilley
- 01 room
- 02 rooms
- 93 rooms
- 534 rooms
- 545 rooms
- 686 rooms
- 307 rooms
- 98 rooms
- 169+ rooms
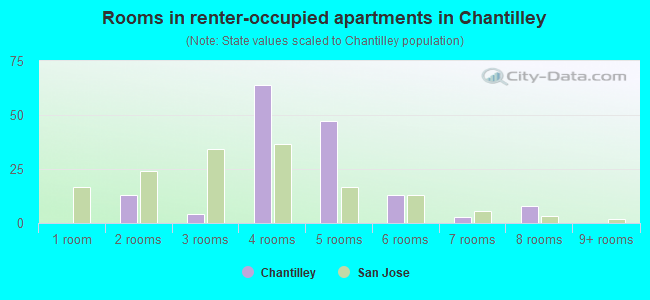
- Rooms in renter-occupied apartments in Chantilley
- 01 room
- 132 rooms
- 43 rooms
- 644 rooms
- 475 rooms
- 136 rooms
- 37 rooms
- 88 rooms
- 09+ rooms
Owner-occupied
Renter-occupied
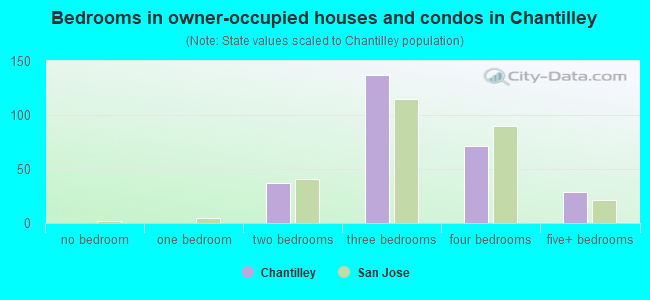
- Bedrooms in owner-occupied houses and condos in Chantilley
- 0no bedroom
- 01 bedroom
- 372 bedrooms
- 1373 bedrooms
- 714 bedrooms
- 295+ bedrooms
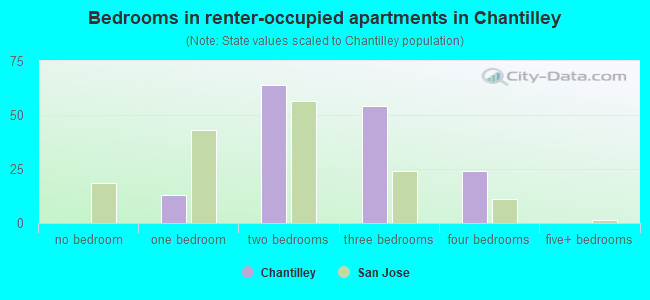
- Bedrooms in renter-occupied apartments in Chantilley
- 0no bedroom
- 131 bedroom
- 642 bedrooms
- 543 bedrooms
- 244 bedrooms
- 05+ bedrooms
Average number of cars or other vehicles available in houses/condos:
Average number of cars or other vehicles available in apartments:
| This neighborhood: | 2.2 |
| San Jose: | 2.3 |
Average number of cars or other vehicles available in apartments:
| Here: | 1.3 |
| city: | 1.6 |
Percentage of units with a mortgage:
| Chantilley: | 63.9% |
| San Jose: | 66.9% |
Average estimated value of detached houses in 2022 (47.7% of all units):
| Chantilley: | $1,208,005 |
| San Jose: | $1,532,815 |
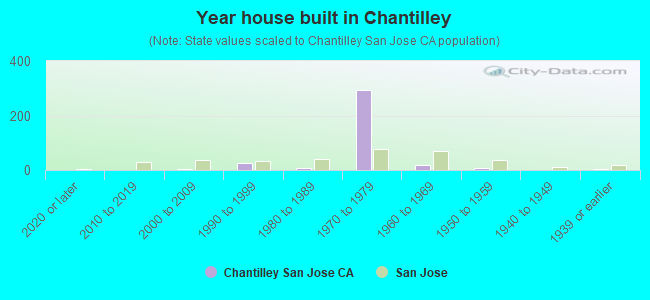
- Year house built in Chantilley
- 02020 or later
- 12010 to 2019
- 32000 to 2009
- 261990 to 1999
- 71980 to 1989
- 2941970 to 1979
- 171960 to 1969
- 81950 to 1959
- 01940 to 1949
- 21939 or earlier
City-data.com crime index for city in 2020 (higher means more crime):
| City: | 268.4 |
| U.S. average: | 219.5 |
Travel time to work (commute)
![Travel time to work (commute)]()
- 8Less than 5 minutes
- 175 to 9 minutes
- 3210 to 14 minutes
- 4015 to 19 minutes
- 6820 to 24 minutes
- 3625 to 29 minutes
- 7330 to 34 minutes
- 1635 to 39 minutes
- 3740 to 44 minutes
- 6245 to 59 minutes
- 5260 to 89 minutes
- 3090 or more minutes

Means of transportation to work
![Means of transportation to work]()
- 71.4%341Drove a car alone
- 5.6%27Carpooled
- 0.4%2Bus
- 2.5%12Light rail, streetcar or trolley
- 0.4%2Motorcycle
- 0.6%3Bicycle
- 3.6%17Other means
- 19.0%91Worked at home

Time leaving home to go to work
![Time leaving home to go to work]()
- 3012:00 a.m. to 4:59 a.m.
- 145:00 a.m. to 5:29 a.m.
- 215:30 a.m. to 5:59 a.m.
- 496:00 a.m. to 6:29 a.m.
- 406:30 a.m. to 6:59 a.m.
- 707:00 a.m. to 7:29 a.m.
- 227:30 a.m. to 7:59 a.m.
- 698:00 a.m. to 8:29 a.m.
- 388:30 a.m. to 8:59 a.m.
- 539:00 a.m. to 9:59 a.m.
- 1310:00 a.m. to 10:59 a.m.
- 1611:00 a.m. to 11:59 a.m.
- 2112:00 p.m. to 3:59 p.m.
- 334:00 p.m. to 11:59 p.m.

Occupations of males:
- Percentage of males in management occupations (except farmers):
Here: 26.5% city: 13.0%
- Percentage of males in business and financial operations occupations:
Here: 12.0% city: 4.6%
- Percentage of males in computer and mathematical occupations:
Here: 3.2% city: 13.6%
- Percentage of males in architecture and engineering occupations:
Here: 3.8% city: 10.2%
- Percentage of males in education, training, and library occupations:
Here: 2.9% city: 2.8%
- Percentage of males in arts, design, entertainment, sports, and media occupations:
Here: 3.4% city: 1.8%
- Percentage of males in service occupations:
Here: 4.0% city: 12.7%
- Percentage of males in sales and office occupations:
Here: 20.9% city: 12.8%
- Percentage of males in construction, extraction, and maintenance occupations:
Here: 9.8% city: 7.8%
- Percentage of males in transportation occupations:
Here: 10.2% city: 3.6%
- Percentage of males in material moving occupations:
Here: 2.1% city: 3.1%
Occupations of females:
- Percentage of females in management occupations (except farmers):
Here: 23.4% city: 11.0%
- Percentage of females in business and financial operations occupations:
Here: 10.1% city: 8.6%
- Percentage of females in computer and mathematical occupations:
Here: 2.5% city: 5.4%
- Percentage of females in architecture and engineering occupations:
Here: 1.8% city: 2.8%
- Percentage of females in life, physical, and social science occupations:
Here: 4.7% city: 1.7%
- Percentage of females in education, training, and library occupations:
Here: 9.8% city: 8.1%
- Percentage of females in arts, design, entertainment, sports, and media occupations:
Here: 1.8% city: 2.0%
- Percentage of females in healthcare practitioners and technical occupations:
Here: 9.1% city: 6.8%
- Percentage of females in service occupations:
Here: 8.7% city: 21.7%
- Percentage of females in sales and office occupations:
Here: 27.9% city: 22.0%
Percentage of people 16-64 in Armed Forces:
| Chantilley: | 0.3% |
| San Jose: | 0.0% |
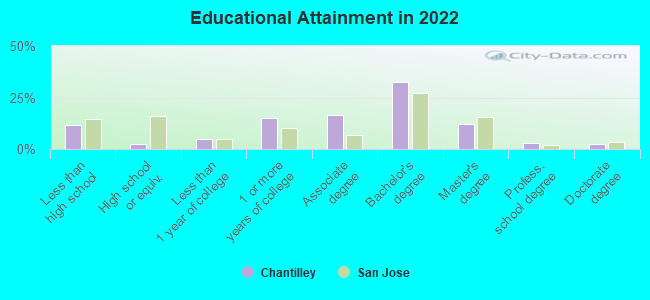
Education in this neighborhood (subdivision or community):
- Percentage of people 3 years and older in K-12 schools:
Chantilley: 19.7% San Jose: 16.1%
- Percentage of people 3 years and older in undergraduate colleges:
Chantilley: 6.2% San Jose: 6.5%
- Percentage of people 3 years and older in grad. or professional schools:
Chantilley: 6.0% San Jose: 2.0%
- Percentage of students K-12 enrolled in private schools:
Chantilley: 54.7% San Jose: 14.9%
Percentage of population below poverty level:
| Chantilley: | 4.1% |
| San Jose: | 9.0% |
Median year owner moved in (as recorded in 2022):
| Chantilley: | 1996 |
| San Jose: | 2008 |
Percentage of married-couple families with both working:
| Chantilley: | 103.6% |
| San Jose: | 72.5% |
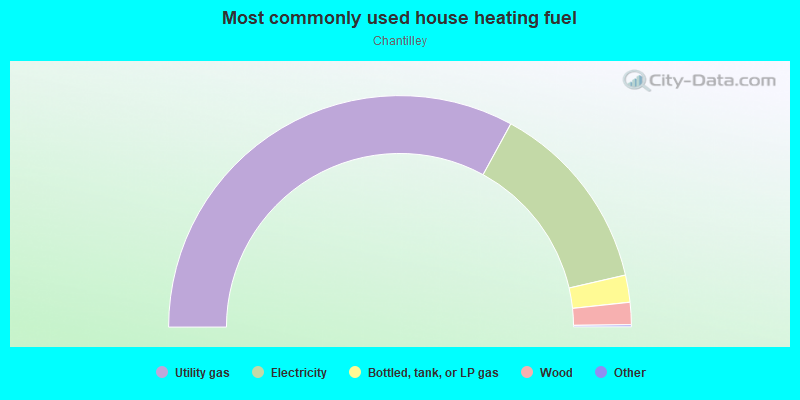
- 65.9%Utility gas
- 26.9%Electricity
- 3.8%Bottled, tank, or LP gas
- 3.1%Wood
Roads and streets:
Golf Course Ln
Length: 0.45 miles
Directions: E-W, SE-NW
Address range: 7050 to 7299
Directions: E-W, SE-NW
Address range: 7050 to 7299
Alder Spring Way
Length: 0.22 miles
Directions: E-W, SE-NW
Address range: 7100 to 7299
Directions: E-W, SE-NW
Address range: 7100 to 7299
Rosencrans Way
Length: 0.22 miles
Directions: E-W, SE-NW
Address range: 4675 to 7299
Directions: E-W, SE-NW
Address range: 4675 to 7299
Sprucemont Pl
Length: 0.20 miles
Directions: N-S, SE-NW, SW-NE
Address range: 100 to 199
Directions: N-S, SE-NW, SW-NE
Address range: 100 to 199
Fairway Glen Ln
Length: 0.19 miles
Direction: SW-NE
Address range: 1 to 299
Direction: SW-NE
Address range: 1 to 299
Indian Wells Ct
Length: 0.16 miles
Directions: SE-NW, SW-NE
Address range: 7000 to 7199
Directions: SE-NW, SW-NE
Address range: 7000 to 7199
Chantilley Ln
Length: 0.15 miles
Direction: SW-NE
Address range: 101 to 498
Direction: SW-NE
Address range: 101 to 498
Santa Teresa Blvd
Length: 0.14 miles
Directions: E-W, SE-NW
Address range: 7032 to 7119
Directions: E-W, SE-NW
Address range: 7032 to 7119
Oak Brook Cir
Length: 0.13 miles
Directions: SE-NW, SW-NE
Address range: 100 to 199
Directions: SE-NW, SW-NE
Address range: 100 to 199
Banff Springs Way
Length: 0.11 miles
Direction: SW-NE
Address range: 100 to 299
Direction: SW-NE
Address range: 100 to 299
Stillwater Ln
Length: 0.10 miles
Directions: E-W, SW-NE
Address range: 100 to 299
Directions: E-W, SW-NE
Address range: 100 to 299
Cypress Point Ct
Length: 0.10 miles
Directions: SE-NW, SW-NE
Address range: 7050 to 7099
Directions: SE-NW, SW-NE
Address range: 7050 to 7099
Coral Gables Cir
Length: 0.10 miles
Directions: E-W, SW-NE
Address range: 7000 to 7199
Directions: E-W, SW-NE
Address range: 7000 to 7199
Chantilley Ct
Length: 0.10 miles
Directions: E-W, SE-NW
Address range: 7100 to 7299
Directions: E-W, SE-NW
Address range: 7100 to 7299
Calero Hills Ct
Length: 0.09 miles
Directions: E-W, SW-NE
Address range: 7100 to 7199
Directions: E-W, SW-NE
Address range: 7100 to 7199
Point Dunes Ct
Length: 0.09 miles
Directions: SE-NW, SW-NE
Address range: 7100 to 7199
Directions: SE-NW, SW-NE
Address range: 7100 to 7199
Aptos Beach Ct
Length: 0.09 miles
Directions: SE-NW, SW-NE
Address range: 7100 to 7199
Directions: SE-NW, SW-NE
Address range: 7100 to 7199
Valley Park Cir
Length: 0.07 miles
Directions: E-W, SW-NE
Address range: 100 to 223
Directions: E-W, SW-NE
Address range: 100 to 223
Indian Valley Ct
Length: 0.07 miles
Directions: E-W, SW-NE
Address range: 7072 to 7199
Directions: E-W, SW-NE
Address range: 7072 to 7199
Incline Way
Length: 0.06 miles
Direction: SW-NE
Address range: 200 to 299
Direction: SW-NE
Address range: 200 to 299
Banff Springs Ct
Length: 0.05 miles
Direction: SE-NW
Address range: 7000 to 7099
Direction: SE-NW
Address range: 7000 to 7099
Pinedale Ct
Length: 0.04 miles
Directions: N-S, SW-NE
Address range: 7200 to 7299
Directions: N-S, SW-NE
Address range: 7200 to 7299
Shea Ct
Length: 0.03 miles
Directions: N-S, SW-NE
Address range: 7200 to 7299
Directions: N-S, SW-NE
Address range: 7200 to 7299
Kodiak Ct
Length: 0.01 miles
Direction: N-S
Address range: 7100 to 7199
Direction: N-S
Address range: 7100 to 7199