Central Park neighborhood in Campbell, California (CA), 95008 detailed profile
Settings
X

Business Search - 14 Million verified businesses
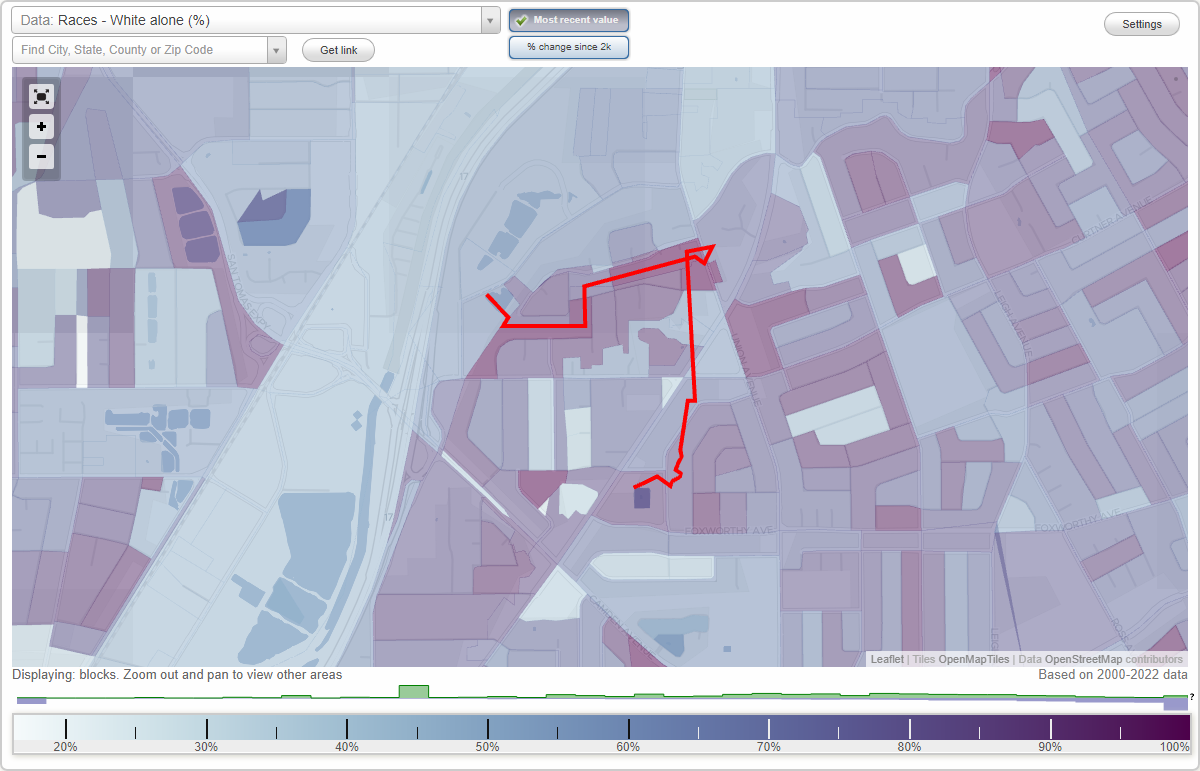
Area: 0.038 square miles
Population: 238
Population density:
| Central Park: | 6,276 people per square mile |
| Campbell: | 7,753 people per square mile |

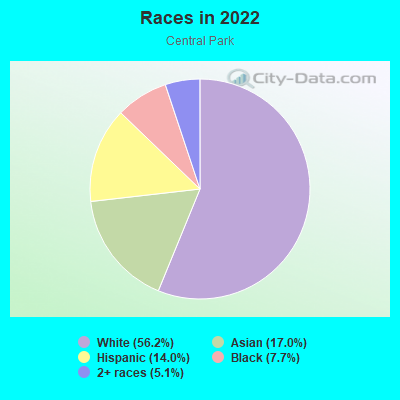
- 13256.2%White
- 4017.0%Asian
- 3314.0%Hispanic or Latino
- 187.7%Black
- 125.1%Two or more races
Median household income in 2022:
| Central Park: | $111,953 |
| Campbell: | $141,794 |
Distribution of median household income
![Distribution of median household income]()
- 2Less than $10,000
- 19$10,000 to $19,999
- 9$20,000 to $29,999
- 6$30,000 to $39,999
- 4$40,000 to $49,999
- 2$50,000 to $59,999
- 4$60,000 to $74,999
- 5$75,000 to $99,999
- 6$100,000 to $124,999
- 5$125,000 to $149,999
- 13$150,000 to $199,999
- 32$200,000 or more

Distribution of owner-occupied house/condo value
![Distribution of owner-occupied house/condo value]()
- 2$50,000 to $99,999
- 2$300,000 to $399,999
- 1$500,000 to $749,999
- 3$750,000 to $999,999
- 59$1,000,000 or more

Distribution of rent paid by renters
![Distribution of rent paid by renters]()
- 6$300 to $399
- 2$700 to $799
- 1$900 to $999
- 10$1,000 to $1,249
- 13$1,250 to $1,499
- 8$1,500 to $1,999
- 27$2,000 or more

Median rent in 2022:
| Central Park: | $1,256 |
| Campbell: | $2,001 |
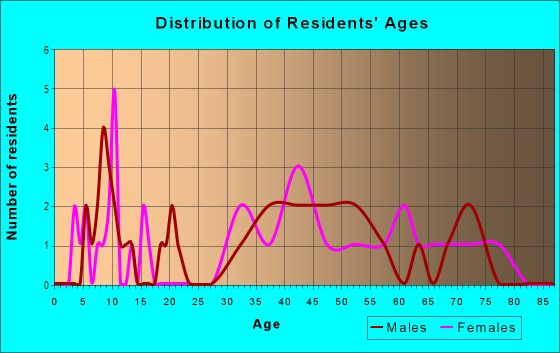
| Males: | 113 |
| Females: | 124 |
Males:
| This neighborhood: | 42.8 years |
| Whole city: | 38.6 years |
| This neighborhood: | 49.8 years |
| Whole city: | 40.0 years |
Average household size:
| Central Park: | 2.4 people |
| Campbell: | 2.5 people |
Percentage of family households:
| Central Park: | 53.4% |
| Campbell: | 50.9% |
| Here: | 52.1% |
| Campbell: | 50.4% |
Percentage of married-couple families with children (among all households):
| Central Park: | 32.9% |
| Campbell: | 31.4% |
Percentage of single-mother households (among all households):
| Central Park: | 6.1% |
| Campbell: | 5.4% |
Percentage of never married males 15 years old and over:
Percentage of never married females 15 years old and over:
| Central Park: | 13.1% |
| Campbell: | 16.6% |
Percentage of never married females 15 years old and over:
| Central Park: | 9.1% |
| city: | 15.8% |
Percentage of people that speak English not well or not at all:
| Central Park: | 3.5% |
| Campbell: | 5.3% |
Percentage of people born in this state:
Percentage of people born in another U.S. state:
Percentage of native residents but born outside the U.S.:
Percentage of foreign born residents:
| Here: | 57.4% |
| Campbell: | 51.3% |
Percentage of people born in another U.S. state:
| Central Park: | 19.2% |
| Campbell: | 16.6% |
Percentage of native residents but born outside the U.S.:
| Here: | 0.8% |
| city: | 1.1% |
Percentage of foreign born residents:
| Here: | 22.6% |
| Campbell: | 31.1% |
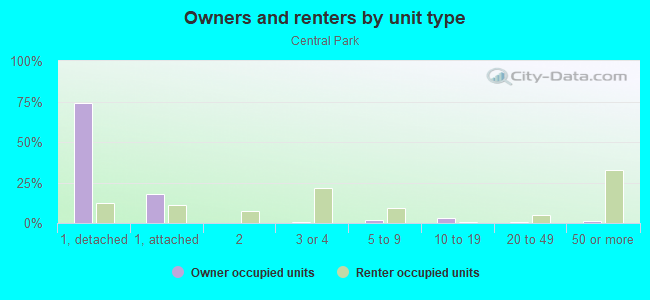
Owner-occupied
Renter-occupied

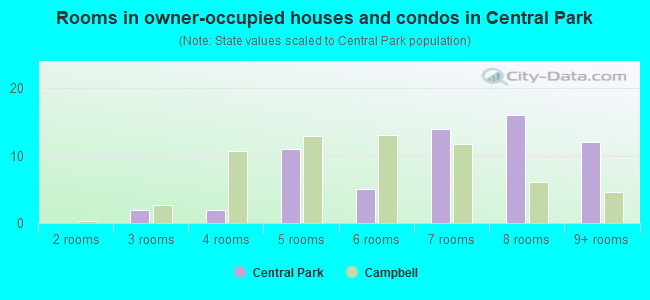
- Rooms in owner-occupied houses and condos in Central Park
- 01 room
- 02 rooms
- 23 rooms
- 24 rooms
- 115 rooms
- 56 rooms
- 147 rooms
- 168 rooms
- 129+ rooms
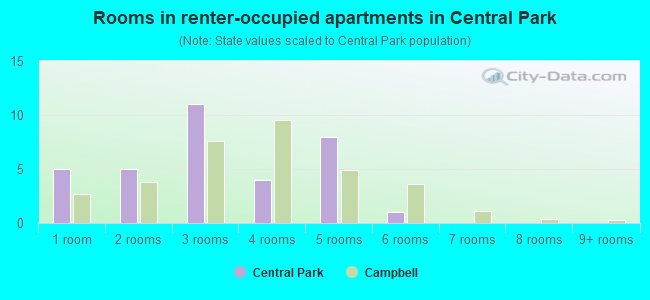
- Rooms in renter-occupied apartments in Central Park
- 51 room
- 52 rooms
- 113 rooms
- 44 rooms
- 85 rooms
- 16 rooms
- 07 rooms
- 08 rooms
- 09+ rooms
Owner-occupied
Renter-occupied
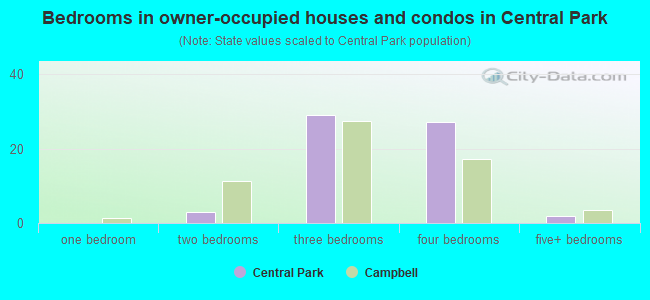
- Bedrooms in owner-occupied houses and condos in Central Park
- 0no bedroom
- 01 bedroom
- 32 bedrooms
- 293 bedrooms
- 274 bedrooms
- 25+ bedrooms
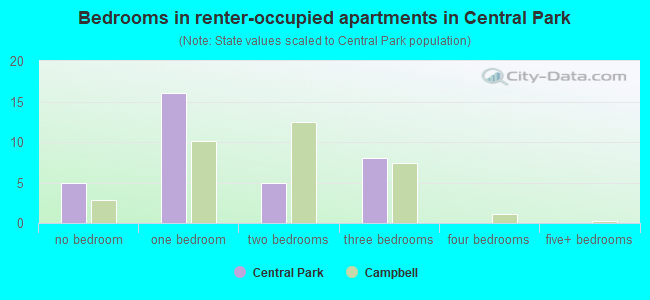
- Bedrooms in renter-occupied apartments in Central Park
- 5no bedroom
- 161 bedroom
- 52 bedrooms
- 83 bedrooms
- 04 bedrooms
- 05+ bedrooms
Average number of cars or other vehicles available in houses/condos:
Average number of cars or other vehicles available in apartments:
| This neighborhood: | 2.3 |
| Campbell: | 2.2 |
Average number of cars or other vehicles available in apartments:
| Here: | 1.1 |
| city: | 1.6 |
Percentage of units with a mortgage:
| Central Park: | 66.9% |
| Campbell: | 68.8% |
Housing prices:
- Average estimated value of detached houses in 2022 (53.8% of all units):
Central Park: $1,747,549 Campbell: $1,768,898
- Average estimated value of townhouses or other attached units in 2022 (11.3% of all units):
This neighborhood: $1,497,887 city: $1,144,684
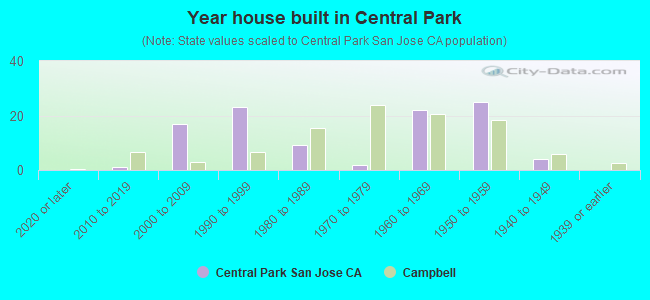
- Year house built in Central Park
- 02020 or later
- 12010 to 2019
- 172000 to 2009
- 231990 to 1999
- 91980 to 1989
- 21970 to 1979
- 221960 to 1969
- 251950 to 1959
- 41940 to 1949
- 01939 or earlier
City-data.com crime index for city in 2020 (higher means more crime):
| City: | 246.0 |
| U.S. average: | 219.5 |
Travel time to work (commute)
![Travel time to work (commute)]()
- 1Less than 5 minutes
- 85 to 9 minutes
- 1310 to 14 minutes
- 2315 to 19 minutes
- 1420 to 24 minutes
- 525 to 29 minutes
- 1930 to 34 minutes
- 235 to 39 minutes
- 340 to 44 minutes
- 845 to 59 minutes
- 660 to 89 minutes
- 290 or more minutes

Means of transportation to work
![Means of transportation to work]()
- 67.1%80Drove a car alone
- 6.7%8Carpooled
- 1.7%2Bus
- 0.8%1Motorcycle
- 0.8%1Bicycle
- 2.5%3Walked
- 2.5%3Other means
- 17.6%21Worked at home

Time leaving home to go to work
![Time leaving home to go to work]()
- 412:00 a.m. to 4:59 a.m.
- 15:00 a.m. to 5:29 a.m.
- 25:30 a.m. to 5:59 a.m.
- 16:00 a.m. to 6:29 a.m.
- 46:30 a.m. to 6:59 a.m.
- 107:00 a.m. to 7:29 a.m.
- 117:30 a.m. to 7:59 a.m.
- 228:00 a.m. to 8:29 a.m.
- 118:30 a.m. to 8:59 a.m.
- 149:00 a.m. to 9:59 a.m.
- 710:00 a.m. to 10:59 a.m.
- 111:00 a.m. to 11:59 a.m.
- 912:00 p.m. to 3:59 p.m.
- 74:00 p.m. to 11:59 p.m.

Occupations of males:
- Percentage of males in management occupations (except farmers):
Here: 14.4% city: 17.3%
- Percentage of males in business and financial operations occupations:
Here: 8.1% city: 6.0%
- Percentage of males in computer and mathematical occupations:
Here: 19.9% city: 13.7%
- Percentage of males in architecture and engineering occupations:
Here: 8.7% city: 10.9%
- Percentage of males in life, physical, and social science occupations:
Here: 4.0% city: 1.5%
- Percentage of males in community and social services occupations:
Here: 1.6% city: 0.7%
- Percentage of males in legal occupations:
Here: 4.2% city: 0.6%
- Percentage of males in education, training, and library occupations:
Here: 2.6% city: 2.6%
- Percentage of males in arts, design, entertainment, sports, and media occupations:
Here: 2.6% city: 3.7%
- Percentage of males in healthcare practitioners and technical occupations:
Here: 2.1% city: 2.1%
- Percentage of males in service occupations:
Here: 8.4% city: 9.6%
- Percentage of males in sales and office occupations:
Here: 14.7% city: 13.2%
- Percentage of males in construction, extraction, and maintenance occupations:
Here: 12.9% city: 7.7%
- Percentage of males in production occupations:
Here: 4.5% city: 3.0%
- Percentage of males in transportation occupations:
Here: 2.9% city: 1.8%
- Percentage of males in material moving occupations:
Here: 2.1% city: 3.4%
Occupations of females:
- Percentage of females in management occupations (except farmers):
Here: 1.9% city: 15.9%
- Percentage of females in business and financial operations occupations:
Here: 15.3% city: 9.1%
- Percentage of females in computer and mathematical occupations:
Here: 1.9% city: 5.9%
- Percentage of females in architecture and engineering occupations:
Here: 1.7% city: 3.7%
- Percentage of females in life, physical, and social science occupations:
Here: 1.7% city: 1.8%
- Percentage of females in community and social services occupations:
Here: 2.4% city: 4.1%
- Percentage of females in education, training, and library occupations:
Here: 13.2% city: 9.6%
- Percentage of females in arts, design, entertainment, sports, and media occupations:
Here: 7.4% city: 2.6%
- Percentage of females in healthcare practitioners and technical occupations:
Here: 12.7% city: 5.7%
- Percentage of females in service occupations:
Here: 10.0% city: 13.1%
- Percentage of females in sales and office occupations:
Here: 41.9% city: 24.6%
- Percentage of females in production occupations:
Here: 5.9% city: 0.6%
- Percentage of females in transportation occupations:
Here: 1.9% city: 0.8%
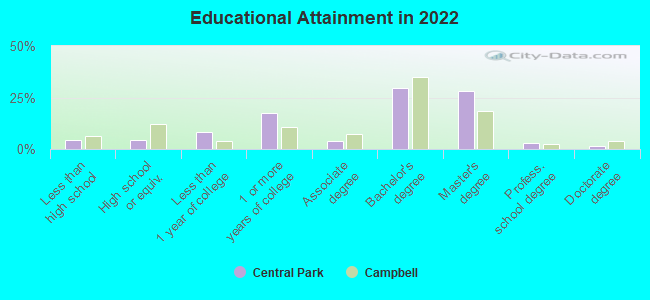
Education in this neighborhood (subdivision or community):
- Percentage of people 3 years and older in K-12 schools:
Central Park: 17.2% Campbell: 16.1%
- Percentage of people 3 years and older in undergraduate colleges:
Central Park: 8.6% Campbell: 4.5%
- Percentage of people 3 years and older in grad. or professional schools:
Central Park: 0.4% Campbell: 0.9%
- Percentage of students K-12 enrolled in private schools:
Central Park: 25.0% Campbell: 17.5%
Percentage of population below poverty level:
| Central Park: | 6.3% |
| Campbell: | 5.6% |
Median year owner moved in (as recorded in 2022):
Median year renter moved in (as recorded in 2022):
| Central Park: | 2004 |
| Campbell: | 2007 |
Median year renter moved in (as recorded in 2022):
| Central Park: | 2015 |
| Campbell: | 2016 |
Percentage of married-couple families with both working:
| Central Park: | 82.2% |
| Campbell: | 72.5% |
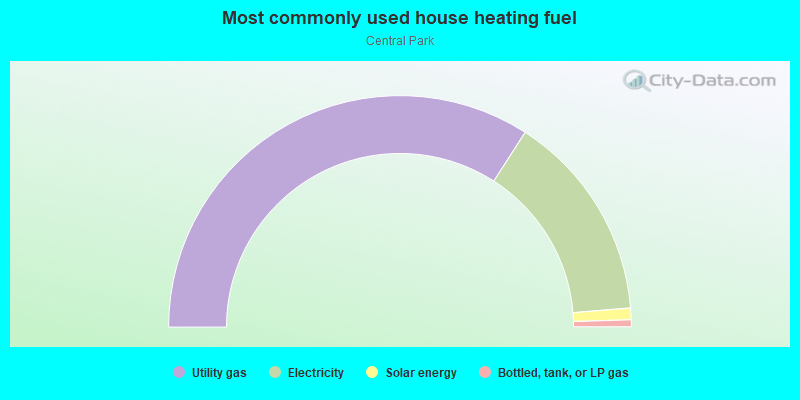
- 68.2%Utility gas
- 29.2%Electricity
- 1.6%Solar energy
- 1.0%Bottled, tank, or LP gas
Roads and streets:
Central Park Dr
Length: 0.58 miles
Directions: E-W, N-S, SE-NW, SW-NE
Address range: 2100 to 2399
Directions: E-W, N-S, SE-NW, SW-NE
Address range: 2100 to 2399
Highland Park Ln
Length: 0.14 miles
Directions: E-W, SE-NW, SW-NE
Address range: 2200 to 2399
Directions: E-W, SE-NW, SW-NE
Address range: 2200 to 2399
Oak Park Ln
Length: 0.11 miles
Directions: N-S, SE-NW, SW-NE
Address range: 2500 to 2599
Directions: N-S, SE-NW, SW-NE
Address range: 2500 to 2599
Regas Dr
Length: 0.00 miles
Direction: SE-NW
Address range: 702 to 799
Direction: SE-NW
Address range: 702 to 799