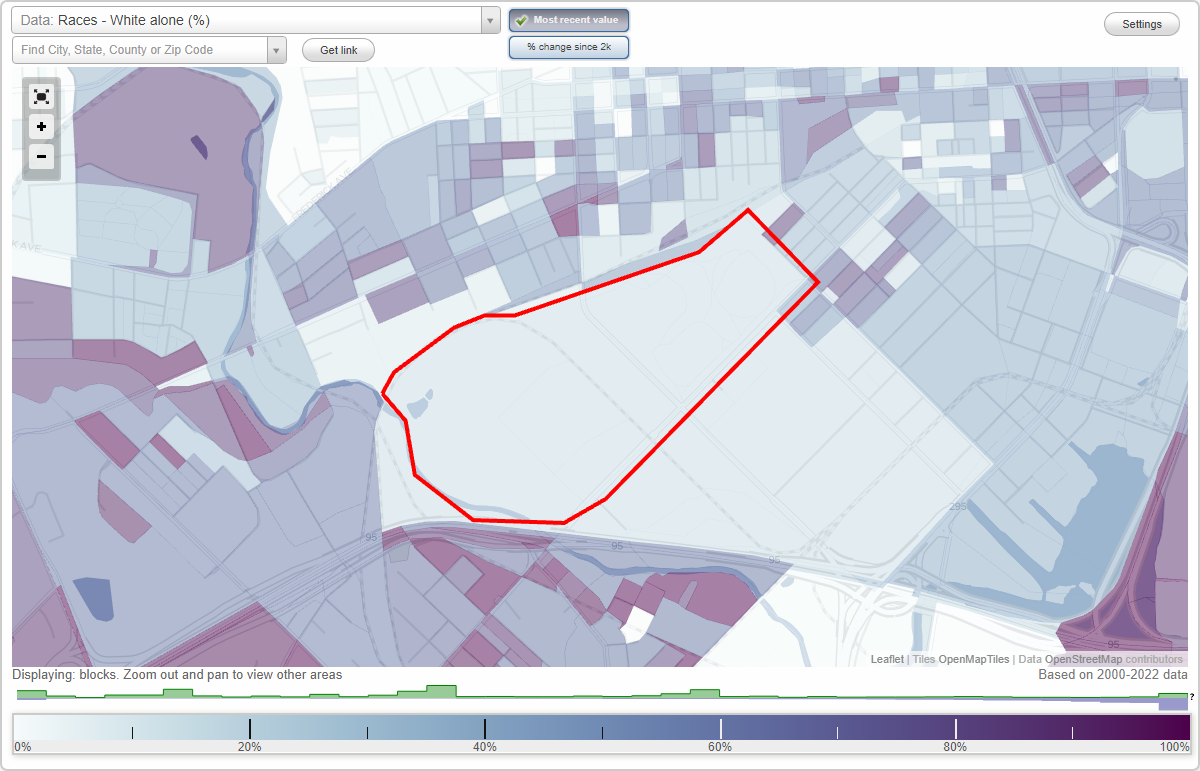
Carroll Park neighborhood in Baltimore, Maryland (MD), 21230 detailed profile
Settings
X

Business Search - 14 Million verified businesses
Area: 0.361 square miles
Population: 996
Population density:
| Carroll Park: | 2,756 people per square mile |
| Baltimore: | 7,053 people per square mile |

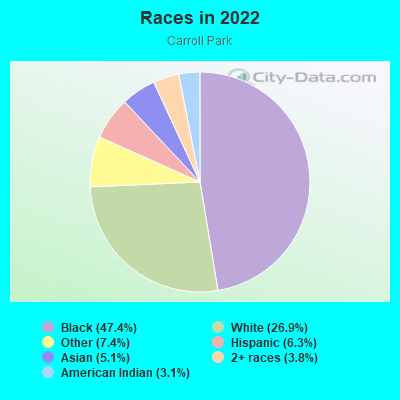
- 52647.4%Black
- 29926.9%White
- 827.4%Some other race
- 706.3%Hispanic or Latino
- 575.1%Asian
- 423.8%Two or more races
- 343.1%American Indian
Distribution of median household income
![Distribution of median household income]()
- 33Less than $10,000
- 103$10,000 to $19,999
- 40$20,000 to $29,999
- 233$30,000 to $39,999
- 147$40,000 to $49,999
- 17$50,000 to $59,999
- 29$60,000 to $74,999
- 23$75,000 to $99,999
- 34$100,000 to $124,999
- 38$125,000 to $149,999
- 24$150,000 to $199,999
- 56$200,000 or more

Distribution of owner-occupied house/condo value
![Distribution of owner-occupied house/condo value]()
- 209Less than $50,000
- 187$50,000 to $99,999
- 30$100,000 to $149,999
- 296$150,000 to $199,999
- 17$200,000 to $249,999
- 15$250,000 to $299,999
- 55$300,000 to $399,999
- 10$400,000 to $499,999
- 6$500,000 to $749,999
- 33$1,000,000 or more

Distribution of rent paid by renters
![Distribution of rent paid by renters]()
- 58Less than $100
- 75$100 to $199
- 26$200 to $299
- 42$300 to $399
- 35$500 to $599
- 126$600 to $699
- 131$700 to $799
- 9$800 to $899
- 21$900 to $999
- 23$1,000 to $1,249
- 72$1,250 to $1,499
- 24$1,500 to $1,999
- 12$2,000 or more

Median rent in 2022:
| Carroll Park: | $966 |
| Baltimore: | $1,043 |
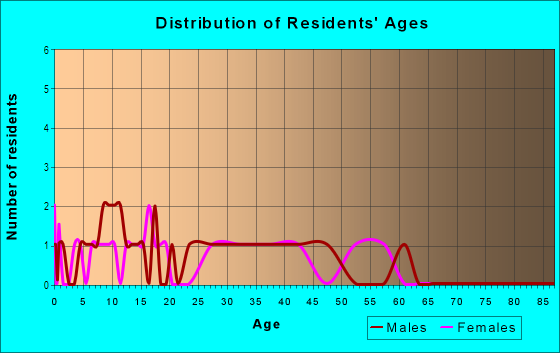
| Males: | 591 |
| Females: | 404 |
Males:
| This neighborhood: | 35.5 years |
| Whole city: | 35.0 years |
| This neighborhood: | 35.1 years |
| Whole city: | 38.2 years |
Average household size:
| Carroll Park: | 2.2 people |
| Baltimore: | 2.2 people |
Percentage of family households:
| Carroll Park: | 32.5% |
| Baltimore: | 34.2% |
| Here: | 13.9% |
| Baltimore: | 23.3% |
Percentage of married-couple families with children (among all households):
| Carroll Park: | 22.7% |
| Baltimore: | 22.4% |
Percentage of single-mother households (among all households):
| Carroll Park: | 43.3% |
| Baltimore: | 18.7% |
Percentage of never married males 15 years old and over:
Percentage of never married females 15 years old and over:
| Carroll Park: | 34.2% |
| Baltimore: | 25.1% |
Percentage of never married females 15 years old and over:
| Carroll Park: | 21.5% |
| city: | 27.5% |
Percentage of people that speak English not well or not at all:
| Carroll Park: | 4.3% |
| Baltimore: | 2.3% |
Percentage of people born in this state:
Percentage of people born in another U.S. state:
Percentage of native residents but born outside the U.S.:
Percentage of foreign born residents:
| Here: | 67.5% |
| Baltimore: | 64.4% |
Percentage of people born in another U.S. state:
| Carroll Park: | 16.3% |
| Baltimore: | 25.0% |
Percentage of native residents but born outside the U.S.:
| Here: | 5.0% |
| city: | 0.9% |
Percentage of foreign born residents:
| Here: | 16.3% |
| Baltimore: | 9.7% |
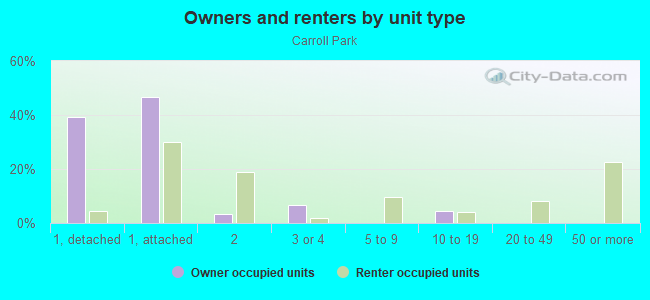
Owner-occupied
Renter-occupied

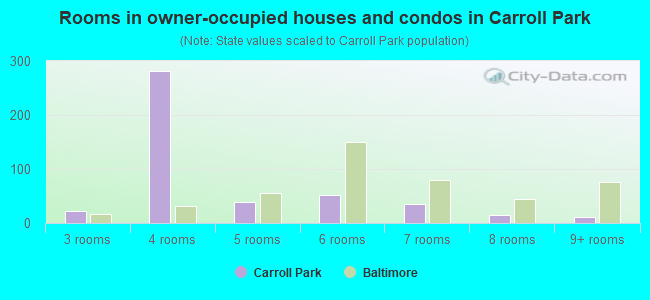
- Rooms in owner-occupied houses and condos in Carroll Park
- 01 room
- 02 rooms
- 233 rooms
- 2814 rooms
- 395 rooms
- 516 rooms
- 367 rooms
- 158 rooms
- 119+ rooms
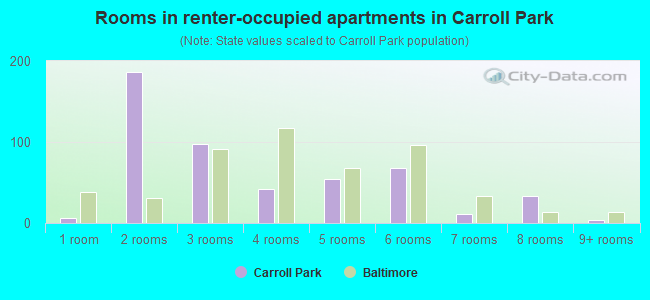
- Rooms in renter-occupied apartments in Carroll Park
- 61 room
- 1862 rooms
- 983 rooms
- 424 rooms
- 545 rooms
- 686 rooms
- 117 rooms
- 338 rooms
- 49+ rooms
Owner-occupied
Renter-occupied
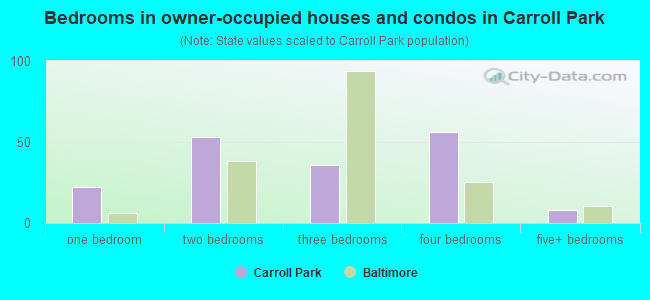
- Bedrooms in owner-occupied houses and condos in Carroll Park
- 0no bedroom
- 221 bedroom
- 532 bedrooms
- 363 bedrooms
- 564 bedrooms
- 85+ bedrooms
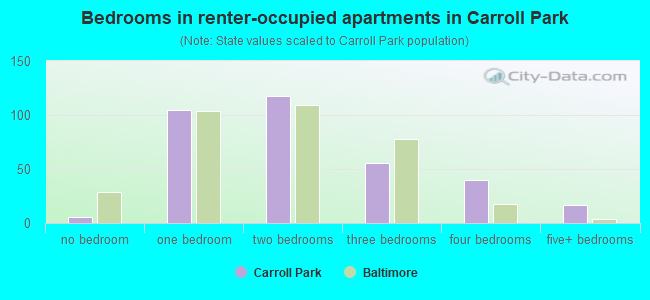
- Bedrooms in renter-occupied apartments in Carroll Park
- 6no bedroom
- 1051 bedroom
- 1182 bedrooms
- 563 bedrooms
- 404 bedrooms
- 175+ bedrooms
Average number of cars or other vehicles available in houses/condos:
Average number of cars or other vehicles available in apartments:
| This neighborhood: | 1.8 |
| Baltimore: | 1.5 |
Average number of cars or other vehicles available in apartments:
| Here: | 0.6 |
| city: | 0.8 |
Percentage of units with a mortgage:
| Carroll Park: | 84.5% |
| Baltimore: | 64.3% |
Average estimated value of townhouses or other attached units in 2022 (68.9% of all units):
| This neighborhood: | $261,308 |
| city: | $206,258 |
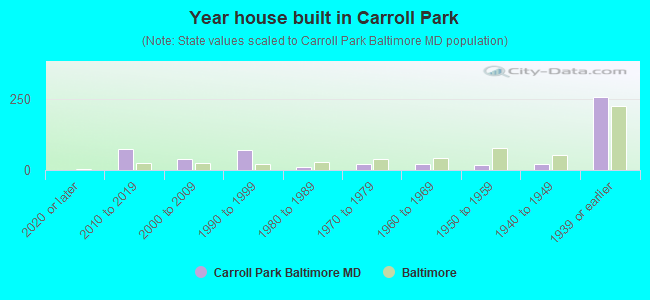
- Year house built in Carroll Park
- 02020 or later
- 752010 to 2019
- 402000 to 2009
- 711990 to 1999
- 121980 to 1989
- 211970 to 1979
- 201960 to 1969
- 171950 to 1959
- 201940 to 1949
- 2551939 or earlier
Travel time to work (commute)
![Travel time to work (commute)]()
- 18Less than 5 minutes
- 285 to 9 minutes
- 1110 to 14 minutes
- 8115 to 19 minutes
- 7220 to 24 minutes
- 3625 to 29 minutes
- 4430 to 34 minutes
- 235 to 39 minutes
- 3440 to 44 minutes
- 3345 to 59 minutes
- 3160 to 89 minutes
- 2090 or more minutes

Means of transportation to work
![Means of transportation to work]()
- 54.7%244Drove a car alone
- 4.7%21Carpooled
- 9.4%42Bus
- 3.6%16Subway or elevated rail
- 4.3%19Long-distance train or commuter rail
- 0.9%4Light rail, streetcar or trolley
- 3.1%14Taxi
- 4.7%21Motorcycle
- 0.9%4Bicycle
- 9.4%42Walked
- 1.6%7Other means
- 17.9%80Worked at home

Time leaving home to go to work
![Time leaving home to go to work]()
- 912:00 a.m. to 4:59 a.m.
- 235:00 a.m. to 5:29 a.m.
- 235:30 a.m. to 5:59 a.m.
- 526:00 a.m. to 6:29 a.m.
- 286:30 a.m. to 6:59 a.m.
- 417:00 a.m. to 7:29 a.m.
- 267:30 a.m. to 7:59 a.m.
- 338:00 a.m. to 8:29 a.m.
- 208:30 a.m. to 8:59 a.m.
- 399:00 a.m. to 9:59 a.m.
- 1610:00 a.m. to 10:59 a.m.
- 311:00 a.m. to 11:59 a.m.
- 3012:00 p.m. to 3:59 p.m.
- 54:00 p.m. to 11:59 p.m.

Occupations of males:
- Percentage of males in business and financial operations occupations:
Here: 6.4% city: 5.9%
- Percentage of males in computer and mathematical occupations:
Here: 3.9% city: 6.1%
- Percentage of males in architecture and engineering occupations:
Here: 2.1% city: 2.9%
- Percentage of males in community and social services occupations:
Here: 3.4% city: 1.6%
- Percentage of males in education, training, and library occupations:
Here: 11.3% city: 5.4%
- Percentage of males in arts, design, entertainment, sports, and media occupations:
Here: 14.6% city: 2.8%
- Percentage of males in service occupations:
Here: 12.9% city: 14.7%
- Percentage of males in sales and office occupations:
Here: 32.3% city: 14.2%
- Percentage of males in construction, extraction, and maintenance occupations:
Here: 1.8% city: 5.6%
- Percentage of males in production occupations:
Here: 10.6% city: 4.2%
Occupations of females:
- Percentage of females in management occupations (except farmers):
Here: 6.4% city: 10.1%
- Percentage of females in business and financial operations occupations:
Here: 4.2% city: 6.6%
- Percentage of females in computer and mathematical occupations:
Here: 4.9% city: 2.4%
- Percentage of females in architecture and engineering occupations:
Here: 16.0% city: 0.9%
- Percentage of females in life, physical, and social science occupations:
Here: 5.9% city: 2.5%
- Percentage of females in community and social services occupations:
Here: 9.6% city: 3.6%
- Percentage of females in education, training, and library occupations:
Here: 4.8% city: 10.7%
- Percentage of females in healthcare practitioners and technical occupations:
Here: 10.7% city: 9.8%
- Percentage of females in service occupations:
Here: 4.5% city: 20.4%
- Percentage of females in sales and office occupations:
Here: 27.4% city: 22.3%
- Percentage of females in transportation occupations:
Here: 5.4% city: 1.7%
Percentage of people 16-64 in Armed Forces:
| Carroll Park: | 0.0% |
| Baltimore: | 0.4% |
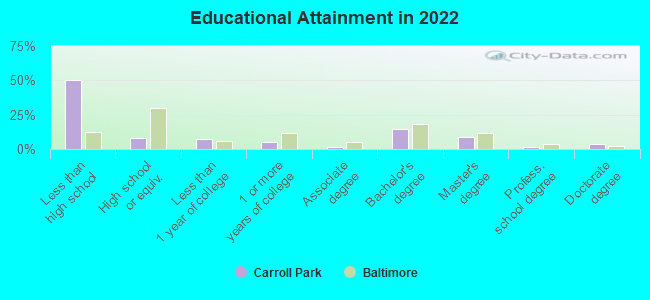
Education in this neighborhood (subdivision or community):
- Percentage of people 3 years and older in K-12 schools:
Carroll Park: 38.6% Baltimore: 14.7%
- Percentage of people 3 years and older in undergraduate colleges:
Carroll Park: 1.5% Baltimore: 6.0%
- Percentage of people 3 years and older in grad. or professional schools:
Carroll Park: 1.1% Baltimore: 2.8%
- Percentage of students K-12 enrolled in private schools:
Carroll Park: 19.3% Baltimore: 12.7%
Percentage of population below poverty level:
| Carroll Park: | 27.7% |
| Baltimore: | 18.5% |
Median year renter moved in (as recorded in 2022):
| Carroll Park: | 2014 |
| Baltimore: | 2019 |
Percentage of married-couple families with both working:
| Carroll Park: | 554.9% |
| Baltimore: | 79.2% |
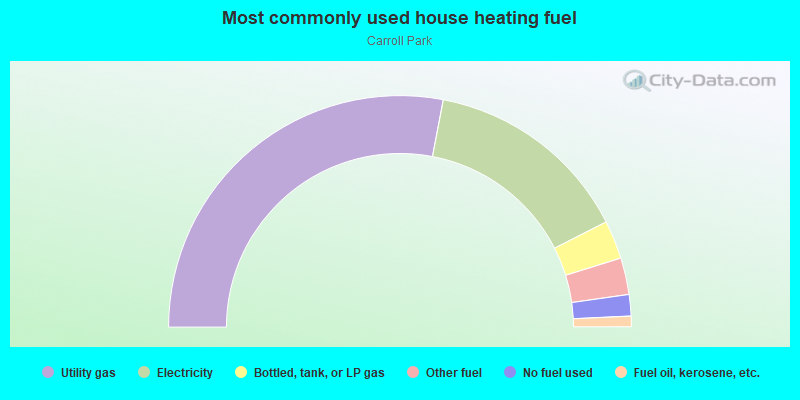
- 56.0%Utility gas
- 29.0%Electricity
- 5.4%Bottled, tank, or LP gas
- 5.1%Other fuel
- 3.0%No fuel used
- 1.5%Fuel oil, kerosene, etc.
Roads and streets:
Washington Blvd
Length: 0.89 miles
Direction: SW-NE
Address range: 1400 to 2009
Direction: SW-NE
Address range: 1400 to 2009
S Monroe St
Length: 0.38 miles
Directions: N-S, SE-NW
Address range: 724 to 1199
Directions: N-S, SE-NW
Address range: 724 to 1199
Bayard St
Length: 0.17 miles
Direction: SE-NW
Address range: 900 to 1199
Direction: SE-NW
Address range: 900 to 1199
Railroad features:
Baltimore and Ohio RR
Length: 0.49 miles
Directions: E-W, SE-NW, SW-NE
Directions: E-W, SE-NW, SW-NE