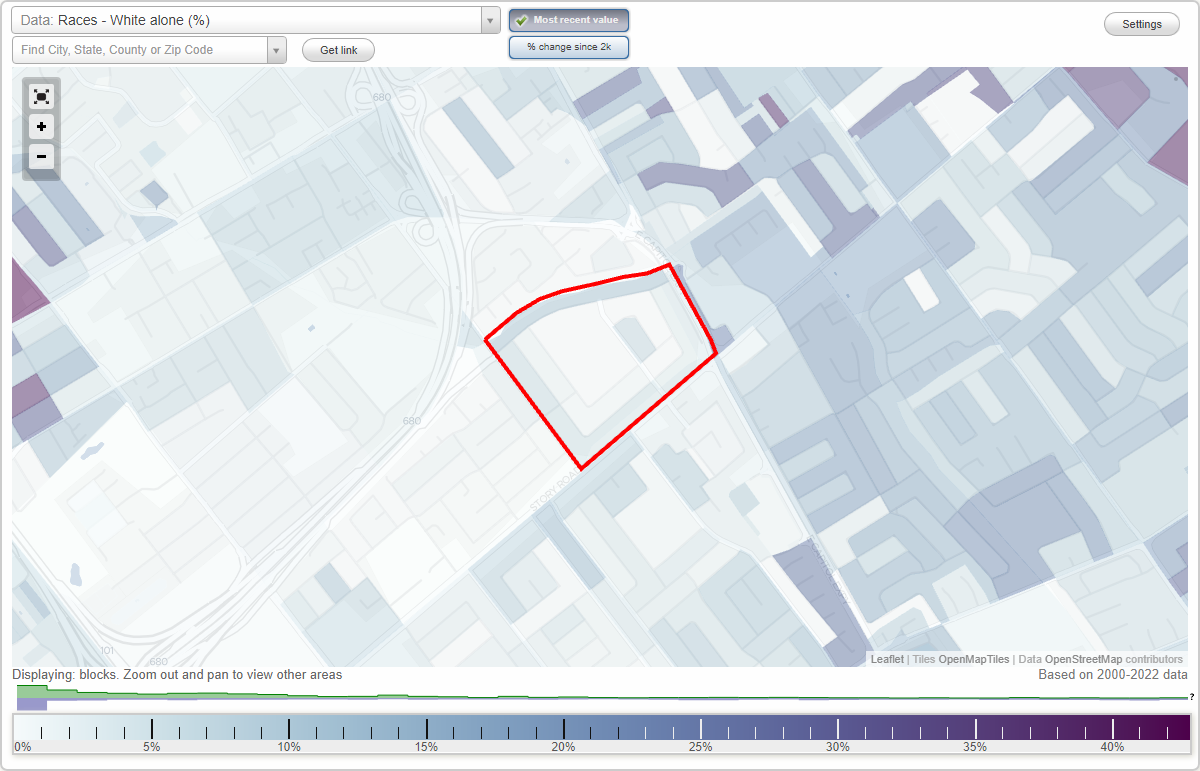
Capitol (Goss) neighborhood in San Jose, California (CA), 95116, 95127 detailed profile
Settings
X

Business Search - 14 Million verified businesses
Area: 0.144 square miles
Population: 687
Population density:
| Capitol (Goss): | 4,755 people per square mile |
| San Jose: | 5,554 people per square mile |

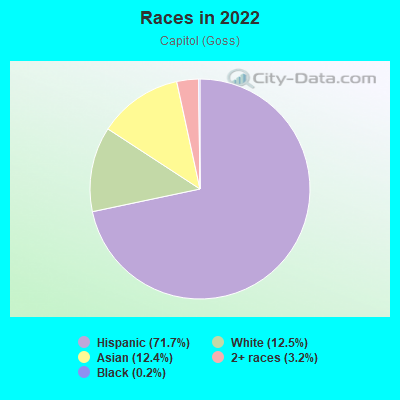
- 58571.7%Hispanic or Latino
- 10212.5%White
- 10112.4%Asian
- 263.2%Two or more races
- 20.2%Black
Distribution of median household income
![Distribution of median household income]()
- 7Less than $10,000
- 35$10,000 to $19,999
- 18$20,000 to $29,999
- 17$30,000 to $39,999
- 52$40,000 to $49,999
- 11$50,000 to $59,999
- 6$60,000 to $74,999
- 18$75,000 to $99,999
- 15$100,000 to $124,999
- 17$125,000 to $149,999
- 18$150,000 to $199,999
- 38$200,000 or more

Distribution of owner-occupied house/condo value
![Distribution of owner-occupied house/condo value]()
- 20Less than $50,000
- 15$50,000 to $99,999
- 7$300,000 to $399,999
- 8$400,000 to $499,999
- 19$500,000 to $749,999
- 26$750,000 to $999,999
- 14$1,000,000 or more

Distribution of rent paid by renters
![Distribution of rent paid by renters]()
- 6Less than $100
- 11$200 to $299
- 13$300 to $399
- 10$400 to $499
- 11$800 to $899
- 9$900 to $999
- 13$1,000 to $1,249
- 9$1,250 to $1,499
- 12$1,500 to $1,999
- 82$2,000 or more

Median rent in 2022:
| Capitol (Goss): | $2,379 |
| San Jose: | $2,001 |
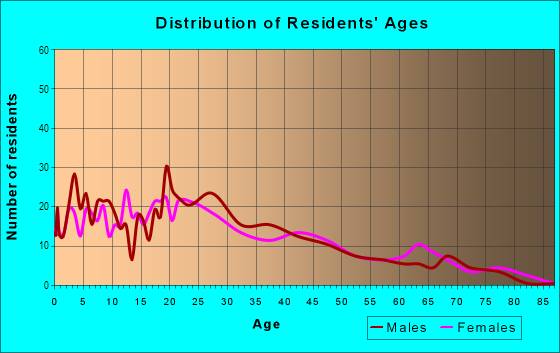
| Males: | 369 |
| Females: | 317 |
Males:
| This neighborhood: | 31.2 years |
| Whole city: | 37.6 years |
| This neighborhood: | 41.9 years |
| Whole city: | 39.1 years |
Average household size:
| Capitol (Goss): | 4.7 people |
| San Jose: | 2.9 people |
Percentage of family households:
| Capitol (Goss): | 57.7% |
| San Jose: | 49.9% |
| Here: | 50.3% |
| San Jose: | 53.0% |
Percentage of married-couple families with children (among all households):
| Capitol (Goss): | 12.6% |
| San Jose: | 25.8% |
Percentage of single-mother households (among all households):
| Capitol (Goss): | 5.3% |
| San Jose: | 5.2% |
Percentage of never married males 15 years old and over:
Percentage of never married females 15 years old and over:
| Capitol (Goss): | 16.0% |
| San Jose: | 20.9% |
Percentage of never married females 15 years old and over:
| Capitol (Goss): | 19.5% |
| city: | 16.7% |
Percentage of people that speak English not well or not at all:
| Capitol (Goss): | 37.5% |
| San Jose: | 11.4% |
Percentage of people born in this state:
Percentage of people born in another U.S. state:
Percentage of native residents but born outside the U.S.:
Percentage of foreign born residents:
| Here: | 46.5% |
| San Jose: | 46.1% |
Percentage of people born in another U.S. state:
| Capitol (Goss): | 1.5% |
| San Jose: | 10.4% |
Percentage of native residents but born outside the U.S.:
| Here: | 1.6% |
| city: | 1.7% |
Percentage of foreign born residents:
| Here: | 50.4% |
| San Jose: | 41.8% |
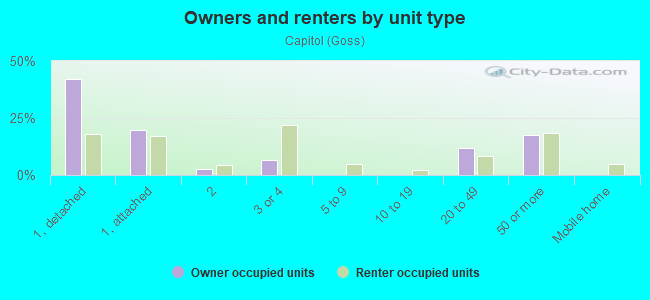
Owner-occupied
Renter-occupied

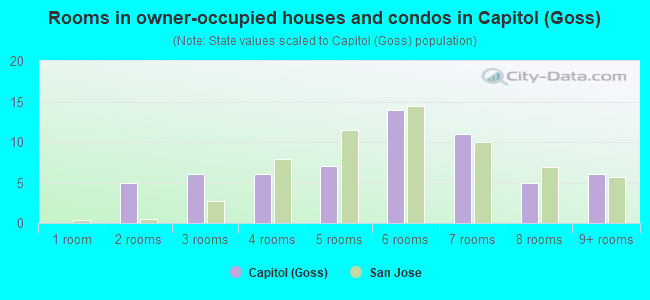
- Rooms in owner-occupied houses and condos in Capitol <
> - 01 room
- 52 rooms
- 63 rooms
- 64 rooms
- 75 rooms
- 146 rooms
- 117 rooms
- 58 rooms
- 69+ rooms
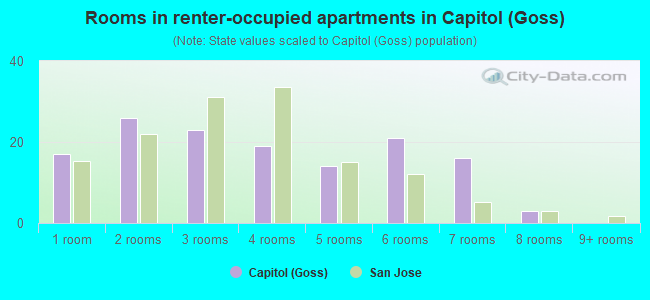
- Rooms in renter-occupied apartments in Capitol <
> - 171 room
- 262 rooms
- 233 rooms
- 194 rooms
- 145 rooms
- 216 rooms
- 167 rooms
- 38 rooms
- 09+ rooms
Owner-occupied
Renter-occupied
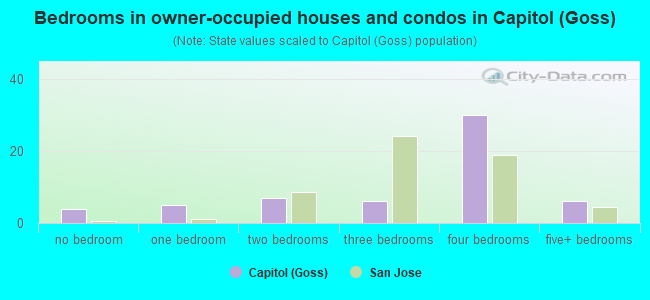
- Bedrooms in owner-occupied houses and condos in Capitol <
> - 4no bedroom
- 51 bedroom
- 72 bedrooms
- 63 bedrooms
- 304 bedrooms
- 65+ bedrooms
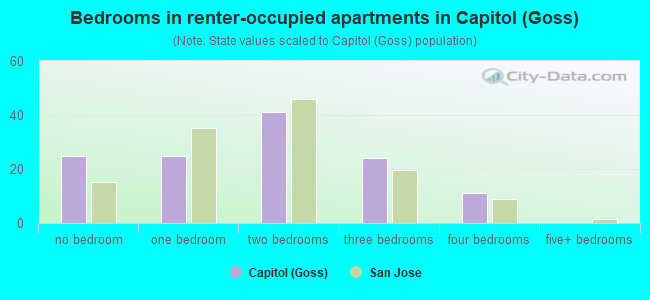
- Bedrooms in renter-occupied apartments in Capitol <
> - 25no bedroom
- 251 bedroom
- 412 bedrooms
- 243 bedrooms
- 114 bedrooms
- 05+ bedrooms
Average number of cars or other vehicles available in houses/condos:
Average number of cars or other vehicles available in apartments:
| This neighborhood: | 3.4 |
| San Jose: | 2.3 |
Average number of cars or other vehicles available in apartments:
| Here: | 2.5 |
| city: | 1.6 |
Percentage of units with a mortgage:
| Capitol (Goss): | 56.3% |
| San Jose: | 66.9% |
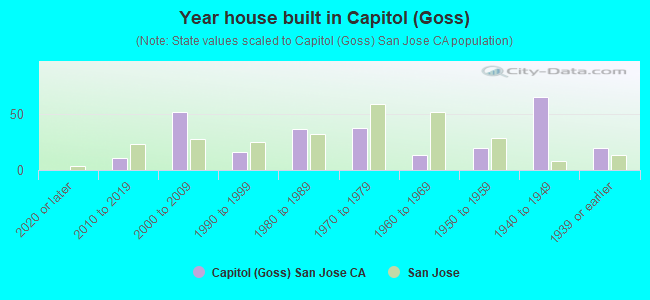
- Year house built in Capitol <
> - 02020 or later
- 112010 to 2019
- 522000 to 2009
- 161990 to 1999
- 371980 to 1989
- 381970 to 1979
- 131960 to 1969
- 201950 to 1959
- 651940 to 1949
- 201939 or earlier
City-data.com crime index for city in 2020 (higher means more crime):
| City: | 268.4 |
| U.S. average: | 219.5 |
Travel time to work (commute)
![Travel time to work (commute)]()
- 50Less than 5 minutes
- 265 to 9 minutes
- 11510 to 14 minutes
- 14915 to 19 minutes
- 28820 to 24 minutes
- 5325 to 29 minutes
- 13230 to 34 minutes
- 1335 to 39 minutes
- 5040 to 44 minutes
- 3245 to 59 minutes
- 5960 to 89 minutes
- 1690 or more minutes

Means of transportation to work
![Means of transportation to work]()
- 72.2%224Drove a car alone
- 27.4%85Carpooled
- 3.9%12Bus
- 3.5%11Long-distance train or commuter rail
- 2.9%9Walked
- 23.2%72Other means
- 8.1%25Worked at home

Time leaving home to go to work
![Time leaving home to go to work]()
- 12512:00 a.m. to 4:59 a.m.
- 735:00 a.m. to 5:29 a.m.
- 375:30 a.m. to 5:59 a.m.
- 1246:00 a.m. to 6:29 a.m.
- 686:30 a.m. to 6:59 a.m.
- 597:00 a.m. to 7:29 a.m.
- 1207:30 a.m. to 7:59 a.m.
- 1628:00 a.m. to 8:29 a.m.
- 388:30 a.m. to 8:59 a.m.
- 929:00 a.m. to 9:59 a.m.
- 610:00 a.m. to 10:59 a.m.
- 1011:00 a.m. to 11:59 a.m.
- 7912:00 p.m. to 3:59 p.m.
- 854:00 p.m. to 11:59 p.m.

Occupations of males:
- Percentage of males in management occupations (except farmers):
Here: 12.1% city: 13.0%
- Percentage of males in service occupations:
Here: 28.5% city: 12.7%
- Percentage of males in sales and office occupations:
Here: 15.5% city: 12.8%
- Percentage of males in farming, fishing, and forestry occupations:
Here: 2.3% city: 0.4%
- Percentage of males in construction, extraction, and maintenance occupations:
Here: 19.4% city: 7.8%
- Percentage of males in transportation occupations:
Here: 9.4% city: 3.6%
- Percentage of males in material moving occupations:
Here: 10.6% city: 3.1%
Occupations of females:
- Percentage of females in management occupations (except farmers):
Here: 5.3% city: 11.0%
- Percentage of females in business and financial operations occupations:
Here: 4.7% city: 8.6%
- Percentage of females in computer and mathematical occupations:
Here: 3.1% city: 5.4%
- Percentage of females in architecture and engineering occupations:
Here: 11.4% city: 2.8%
- Percentage of females in education, training, and library occupations:
Here: 17.4% city: 8.1%
- Percentage of females in healthcare practitioners and technical occupations:
Here: 6.9% city: 6.8%
- Percentage of females in service occupations:
Here: 20.3% city: 21.7%
- Percentage of females in sales and office occupations:
Here: 20.5% city: 22.0%
- Percentage of females in construction, extraction, and maintenance occupations:
Here: 5.1% city: 0.2%
- Percentage of females in production occupations:
Here: 21.1% city: 4.0%
- Percentage of females in transportation occupations:
Here: 3.7% city: 0.7%
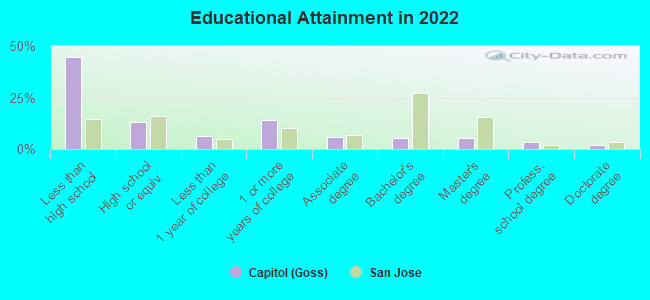
Education in this neighborhood (subdivision or community):
- Percentage of people 3 years and older in K-12 schools:
Capitol (Goss): 37.6% San Jose: 16.1%
- Percentage of people 3 years and older in undergraduate colleges:
Capitol (Goss): 10.0% San Jose: 6.5%
- Percentage of people 3 years and older in grad. or professional schools:
Capitol (Goss): 2.6% San Jose: 2.0%
- Percentage of students K-12 enrolled in private schools:
Capitol (Goss): 4.8% San Jose: 14.9%
Percentage of population below poverty level:
| Capitol (Goss): | 9.6% |
| San Jose: | 9.0% |
Median year owner moved in (as recorded in 2022):
Median year renter moved in (as recorded in 2022):
| Capitol (Goss): | 1993 |
| San Jose: | 2008 |
Median year renter moved in (as recorded in 2022):
| Capitol (Goss): | 2011 |
| San Jose: | 2020 |
Percentage of married-couple families with both working:
| Capitol (Goss): | 107.6% |
| San Jose: | 72.5% |
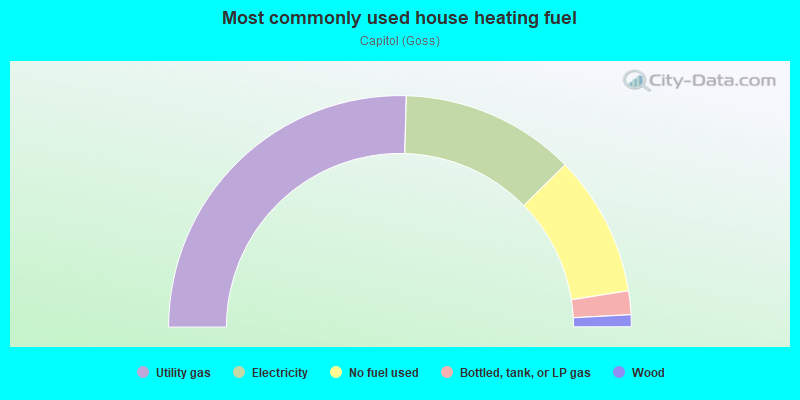
- 50.9%Utility gas
- 24.4%Electricity
- 19.7%No fuel used
- 3.3%Bottled, tank, or LP gas
- 1.7%Wood
Limited-access highways (interstate or state) in this neighborhood:
Capitol Expy (E Capitol Expy)
Length: 0.22 miles
Directions: N-S, SE-NW
Address range: 800 to 949
Directions: N-S, SE-NW
Address range: 800 to 949
Roads and streets:
Bambi Ln
Length: 0.49 miles
Directions: E-W, SW-NE
Address range: 2350 to 2699
Directions: E-W, SW-NE
Address range: 2350 to 2699
Sleepy Hollow Ln
Length: 0.35 miles
Directions: E-W, N-S, SW-NE
Address range: 2300 to 2699
Directions: E-W, N-S, SW-NE
Address range: 2300 to 2699
Cotton Tail Ave
Length: 0.31 miles
Directions: E-W, SE-NW
Address range: 700 to 999
Directions: E-W, SE-NW
Address range: 700 to 999
Van Winkle Ln
Length: 0.30 miles
Directions: E-W, SW-NE
Address range: 2400 to 2699
Directions: E-W, SW-NE
Address range: 2400 to 2699
Peter Pan Ave
Length: 0.26 miles
Directions: E-W, SE-NW
Address range: 700 to 999
Directions: E-W, SE-NW
Address range: 700 to 999
Galahad Ave
Length: 0.25 miles
Directions: N-S, SE-NW
Address range: 700 to 999
Directions: N-S, SE-NW
Address range: 700 to 999
S Capitol Ave
Length: 0.20 miles
Direction: SE-NW
Address range: 800 to 1099
Direction: SE-NW
Address range: 800 to 1099
Sinbad Ave
Length: 0.18 miles
Directions: N-S, SE-NW
Address range: 800 to 999
Directions: N-S, SE-NW
Address range: 800 to 999
Bagdhad Pl
Length: 0.10 miles
Direction: SE-NW
Address range: 800 to 999
Direction: SE-NW
Address range: 800 to 999
Lilliput Ln
Length: 0.07 miles
Directions: E-W, SW-NE
Address range: 2500 to 2599
Directions: E-W, SW-NE
Address range: 2500 to 2599
Cinderella Ln
Length: 0.06 miles
Direction: SW-NE
Direction: SW-NE