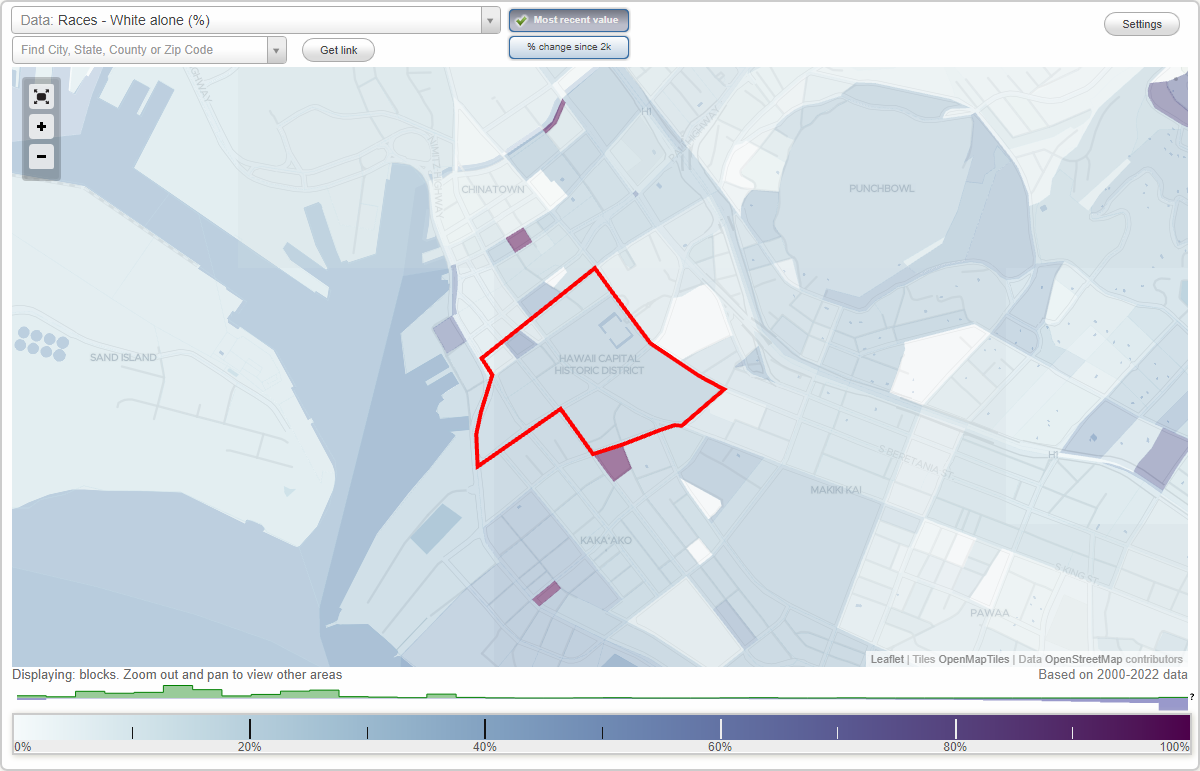
Capitol District neighborhood in Honolulu, Hawaii (HI), 96813 detailed profile
Settings
X

Business Search - 14 Million verified businesses
Area: 0.191 square miles
Population: 399
Population density:
| Capitol District: | 2,089 people per square mile |
| Honolulu: | 4,337 people per square mile |

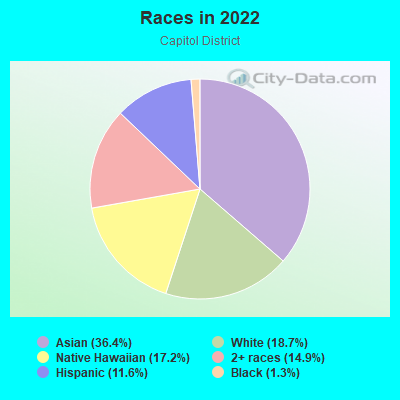
- 14436.4%Asian
- 7418.7%White
- 6817.2%Native Hawaiian and Other
Pacific Islander - 5914.9%Two or more races
- 4611.6%Hispanic or Latino
- 51.3%Black
Median household income in 2022:
| Capitol District: | $52,306 |
| Hawaii: | $92,458 |
Distribution of median household income
![Distribution of median household income]()
- 10Less than $10,000
- 21$10,000 to $19,999
- 14$20,000 to $29,999
- 32$30,000 to $39,999
- 18$40,000 to $49,999
- 18$50,000 to $59,999
- 17$60,000 to $74,999
- 192$75,000 to $99,999
- 8$100,000 to $124,999
- 18$125,000 to $149,999
- 16$150,000 to $199,999
- 178$200,000 or more

Distribution of owner-occupied house/condo value
![Distribution of owner-occupied house/condo value]()
- 18$100,000 to $149,999
- 46$200,000 to $249,999
- 46$250,000 to $299,999
- 22$300,000 to $399,999
- 8$400,000 to $499,999
- 26$500,000 to $749,999
- 12$750,000 to $999,999
- 70$1,000,000 or more

Distribution of rent paid by renters
![Distribution of rent paid by renters]()
- 51$100 to $199
- 32$400 to $499
- 11$600 to $699
- 8$700 to $799
- 8$900 to $999
- 114$1,000 to $1,249
- 24$1,250 to $1,499
- 14$1,500 to $1,999
- 614$2,000 or more

Median rent in 2022:
| Capitol District: | $1,657 |
| Hawaii: | $1,629 |
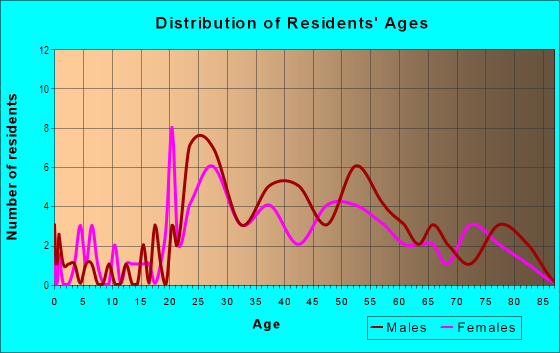
| Males: | 216 |
| Females: | 182 |
| Males: | 41.7 years |
| Females: | 58.3 years |
Average household size:
| Capitol District: | 5.7 people |
| Hawaii: | 2.8 people |
Percentage of family households:
| Capitol District: | 18.6% |
| Hawaii: | 40.3% |
| Here: | 24.3% |
| Hawaii: | 48.6% |
Percentage of married-couple families with children (among all households):
| Capitol District: | 46.7% |
| Hawaii: | 48.5% |
Percentage of single-mother households (among all households):
| Capitol District: | 68.4% |
| Hawaii: | 7.2% |
Percentage of never married males 15 years old and over:
Percentage of never married females 15 years old and over:
| Capitol District: | 23.3% |
| Hawaii: | 19.4% |
Percentage of never married females 15 years old and over:
| Capitol District: | 16.8% |
| Hawaii: | 15.1% |
Percentage of people that speak English not well or not at all:
| Capitol District: | 2.3% |
| Hawaii: | 4.0% |
Percentage of people born in this state:
Percentage of people born in another U.S. state:
Percentage of native residents but born outside the U.S.:
Percentage of foreign born residents:
| Here: | 27.7% |
| Hawaii: | 53.3% |
Percentage of people born in another U.S. state:
| Capitol District: | 29.1% |
| Hawaii: | 26.6% |
Percentage of native residents but born outside the U.S.:
| Here: | 15.3% |
| Hawaii: | 3.0% |
Percentage of foreign born residents:
| Here: | 27.8% |
| Hawaii: | 17.1% |
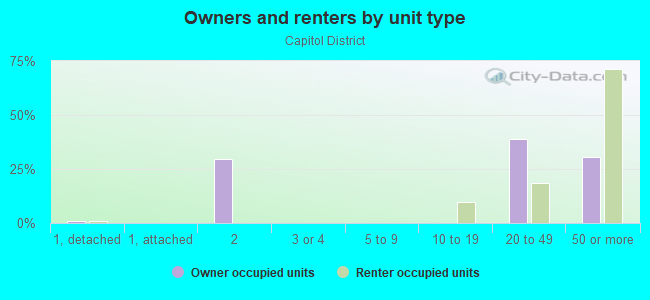
Owner-occupied
Renter-occupied

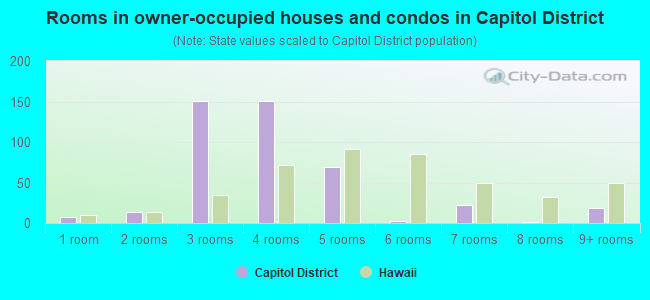
- Rooms in owner-occupied houses and condos in Capitol District
- 71 room
- 142 rooms
- 1503 rooms
- 1504 rooms
- 695 rooms
- 26 rooms
- 227 rooms
- 18 rooms
- 199+ rooms

- Rooms in renter-occupied apartments in Capitol District
- 421 room
- 202 rooms
- 493 rooms
- 164 rooms
- 455 rooms
- 236 rooms
- 07 rooms
- 208 rooms
- 09+ rooms
Owner-occupied
Renter-occupied
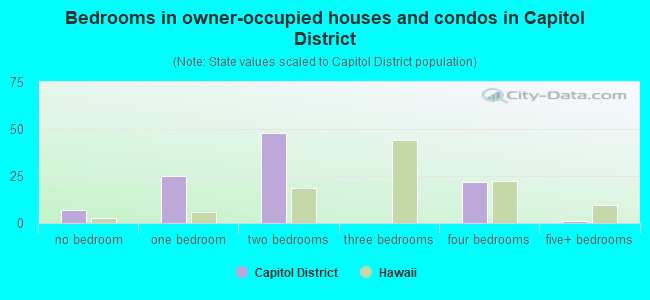
- Bedrooms in owner-occupied houses and condos in Capitol District
- 7no bedroom
- 251 bedroom
- 482 bedrooms
- 03 bedrooms
- 224 bedrooms
- 15+ bedrooms
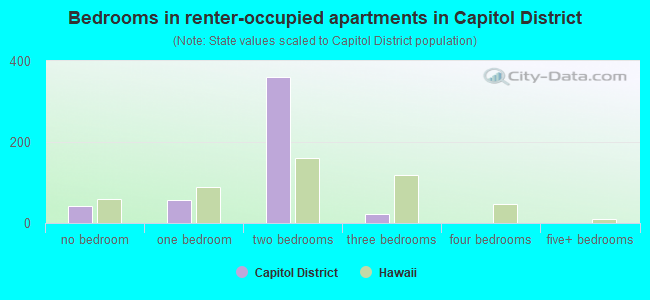
- Bedrooms in renter-occupied apartments in Capitol District
- 43no bedroom
- 581 bedroom
- 3612 bedrooms
- 233 bedrooms
- 04 bedrooms
- 05+ bedrooms
Average number of cars or other vehicles available in houses/condos:
Average number of cars or other vehicles available in apartments:
| This neighborhood: | 0.9 |
| Hawaii: | 2.2 |
Average number of cars or other vehicles available in apartments:
| Here: | 0.7 |
| Hawaii: | 1.4 |
Percentage of units with a mortgage:
| Capitol District: | 43.9% |
| Hawaii: | 62.8% |
Average estimated '22 value of housing units in 5-or-more-unit structures (91.8% of all units):
| Capitol District: | $807,679 |
| Hawaii: | $584,974 |
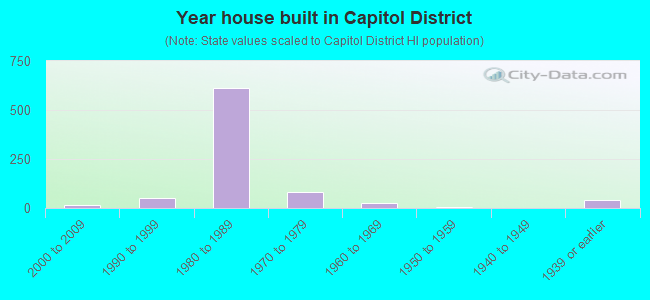
- Year house built in Capitol District
- 02020 or later
- 02010 to 2019
- 152000 to 2009
- 531990 to 1999
- 6101980 to 1989
- 821970 to 1979
- 271960 to 1969
- 51950 to 1959
- 01940 to 1949
- 401939 or earlier
City-data.com crime index for place in 2020 (higher means more crime):
| City: | 216.3 |
| U.S. average: | 219.5 |
Travel time to work (commute)
![Travel time to work (commute)]()
- 37Less than 5 minutes
- 295 to 9 minutes
- 5010 to 14 minutes
- 2015 to 19 minutes
- 2320 to 24 minutes
- 1425 to 29 minutes
- 2930 to 34 minutes
- 2135 to 39 minutes
- 160 to 89 minutes
- 490 or more minutes

Means of transportation to work
![Means of transportation to work]()
- 34.9%65Drove a car alone
- 20.4%38Carpooled
- 3.8%7Bus
- 7.5%14Bicycle
- 42.5%79Walked
- 64.5%120Other means
- 8.1%15Worked at home

Time leaving home to go to work
![Time leaving home to go to work]()
- 1212:00 a.m. to 4:59 a.m.
- 75:30 a.m. to 5:59 a.m.
- 516:00 a.m. to 6:29 a.m.
- 56:30 a.m. to 6:59 a.m.
- 267:00 a.m. to 7:29 a.m.
- 1777:30 a.m. to 7:59 a.m.
- 128:00 a.m. to 8:29 a.m.
- 118:30 a.m. to 8:59 a.m.
- 149:00 a.m. to 9:59 a.m.
- 810:00 a.m. to 10:59 a.m.
- 911:00 a.m. to 11:59 a.m.
- 1812:00 p.m. to 3:59 p.m.
- 134:00 p.m. to 11:59 p.m.

Occupations of males:
- Percentage of males in management occupations (except farmers):
Here: 30.6% Hawaii: 10.8%
- Percentage of males in business and financial operations occupations:
Here: 2.6% Hawaii: 3.9%
- Percentage of males in computer and mathematical occupations:
Here: 3.3% Hawaii: 3.4%
- Percentage of males in architecture and engineering occupations:
Here: 4.1% Hawaii: 2.9%
- Percentage of males in life, physical, and social science occupations:
Here: 1.4% Hawaii: 1.1%
- Percentage of males in legal occupations:
Here: 7.7% Hawaii: 0.9%
- Percentage of males in education, training, and library occupations:
Here: 12.2% Hawaii: 3.7%
- Percentage of males in healthcare practitioners and technical occupations:
Here: 2.2% Hawaii: 3.6%
- Percentage of males in service occupations:
Here: 17.0% Hawaii: 22.3%
- Percentage of males in sales and office occupations:
Here: 6.8% Hawaii: 13.6%
- Percentage of males in production occupations:
Here: 3.8% Hawaii: 3.3%
- Percentage of males in transportation occupations:
Here: 3.5% Hawaii: 5.8%
- Percentage of males in material moving occupations:
Here: 2.0% Hawaii: 4.2%
Occupations of females:
- Percentage of females in management occupations (except farmers):
Here: 6.9% Hawaii: 9.7%
- Percentage of females in business and financial operations occupations:
Here: 3.9% Hawaii: 5.4%
- Percentage of females in computer and mathematical occupations:
Here: 6.3% Hawaii: 1.2%
- Percentage of females in life, physical, and social science occupations:
Here: 1.2% Hawaii: 1.1%
- Percentage of females in legal occupations:
Here: 8.1% Hawaii: 1.1%
- Percentage of females in education, training, and library occupations:
Here: 3.8% Hawaii: 10.1%
- Percentage of females in healthcare practitioners and technical occupations:
Here: 7.4% Hawaii: 8.0%
- Percentage of females in service occupations:
Here: 34.9% Hawaii: 22.2%
- Percentage of females in sales and office occupations:
Here: 23.2% Hawaii: 30.4%
- Percentage of females in transportation occupations:
Here: 2.1% Hawaii: 1.6%
- Percentage of females in material moving occupations:
Here: 1.7% Hawaii: 1.5%
Percentage of people 16-64 in Armed Forces:
| Capitol District: | 0.9% |
| Hawaii: | 5.3% |
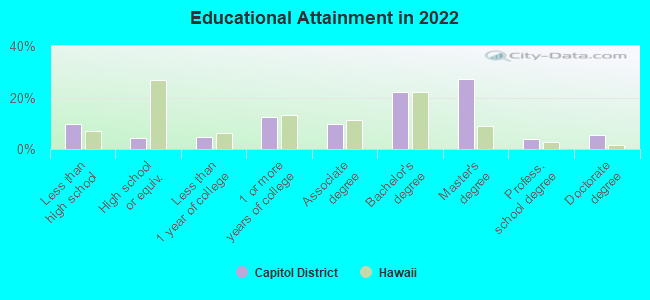
Education in this neighborhood (subdivision or community):
- Percentage of people 3 years and older in K-12 schools:
Capitol District: 78.9% Hawaii: 15.4%
- Percentage of people 3 years and older in undergraduate colleges:
Capitol District: 8.8% Hawaii: 4.7%
- Percentage of people 3 years and older in grad. or professional schools:
Capitol District: 8.8% Hawaii: 1.5%
- Percentage of students K-12 enrolled in private schools:
Capitol District: 103.2% Hawaii: 21.4%
Percentage of population below poverty level:
| Capitol District: | 11.2% |
| Hawaii: | 10.2% |
Median year owner moved in (as recorded in 2022):
Median year renter moved in (as recorded in 2022):
| Capitol District: | 2007 |
| Hawaii: | 2007 |
Median year renter moved in (as recorded in 2022):
| Capitol District: | 2016 |
| Hawaii: | 2019 |
Percentage of married-couple families with both working:
| Capitol District: | 100.0% |
| Hawaii: | 70.3% |
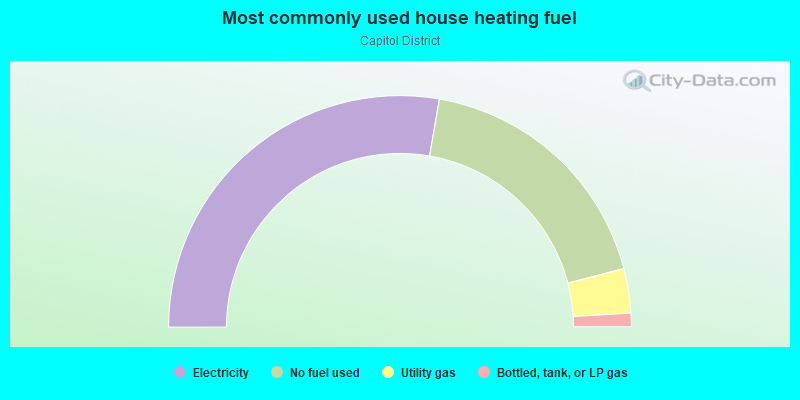
- 55.4%Electricity
- 36.4%No fuel used
- 6.2%Utility gas
- 1.9%Bottled, tank, or LP gas
Roads and streets:
Punchbowl St
Length: 0.54 miles
Directions: E-W, SE-NW, SW-NE
Address range: 670 to 1199
Directions: E-W, SE-NW, SW-NE
Address range: 670 to 1199
S King St
Length: 0.46 miles
Directions: E-W, SE-NW, SW-NE
Address range: 300 to 699
Directions: E-W, SE-NW, SW-NE
Address range: 300 to 699
S Beretania St
Length: 0.43 miles
Directions: N-S, SE-NW
Address range: 300 to 699
Directions: N-S, SE-NW
Address range: 300 to 699
Richards St
Length: 0.42 miles
Directions: N-S, SW-NE
Address range: 700 to 1199
Directions: N-S, SW-NE
Address range: 700 to 1199
Queen St
Length: 0.24 miles
Direction: SE-NW
Address range: 200 to 499
Direction: SE-NW
Address range: 200 to 499
South St
Length: 0.23 miles
Directions: E-W, SW-NE
Address range: 714 to 921
Directions: E-W, SW-NE
Address range: 714 to 921
Mililani St
Length: 0.18 miles
Direction: SW-NE
Address range: 800 to 999
Direction: SW-NE
Address range: 800 to 999
Halekauwila St
Length: 0.17 miles
Directions: N-S, SE-NW
Address range: 316 to 512
Directions: N-S, SE-NW
Address range: 316 to 512
Alapai St
Length: 0.17 miles
Directions: E-W, SW-NE
Address range: 1000 to 1199
Directions: E-W, SW-NE
Address range: 1000 to 1199
Kawaiahao St
Length: 0.12 miles
Directions: N-S, SE-NW, SW-NE
Address range: 550 to 599
Directions: N-S, SE-NW, SW-NE
Address range: 550 to 599
Likelike St
Length: 0.12 miles
Direction: SW-NE
Address range: 1000 to 1099
Direction: SW-NE
Address range: 1000 to 1099
Mililani St (Merchant St)
Length: 0.10 miles
Directions: SE-NW, SW-NE
Address range: 300 to 399
Directions: SE-NW, SW-NE
Address range: 300 to 399
Kapiolani Blvd
Length: 0.04 miles
Direction: SE-NW
Address range: 582 to 599
Direction: SE-NW
Address range: 582 to 599