Canoas Garden neighborhood in San Jose, California (CA), 95125 detailed profile
Settings
X

Business Search - 14 Million verified businesses
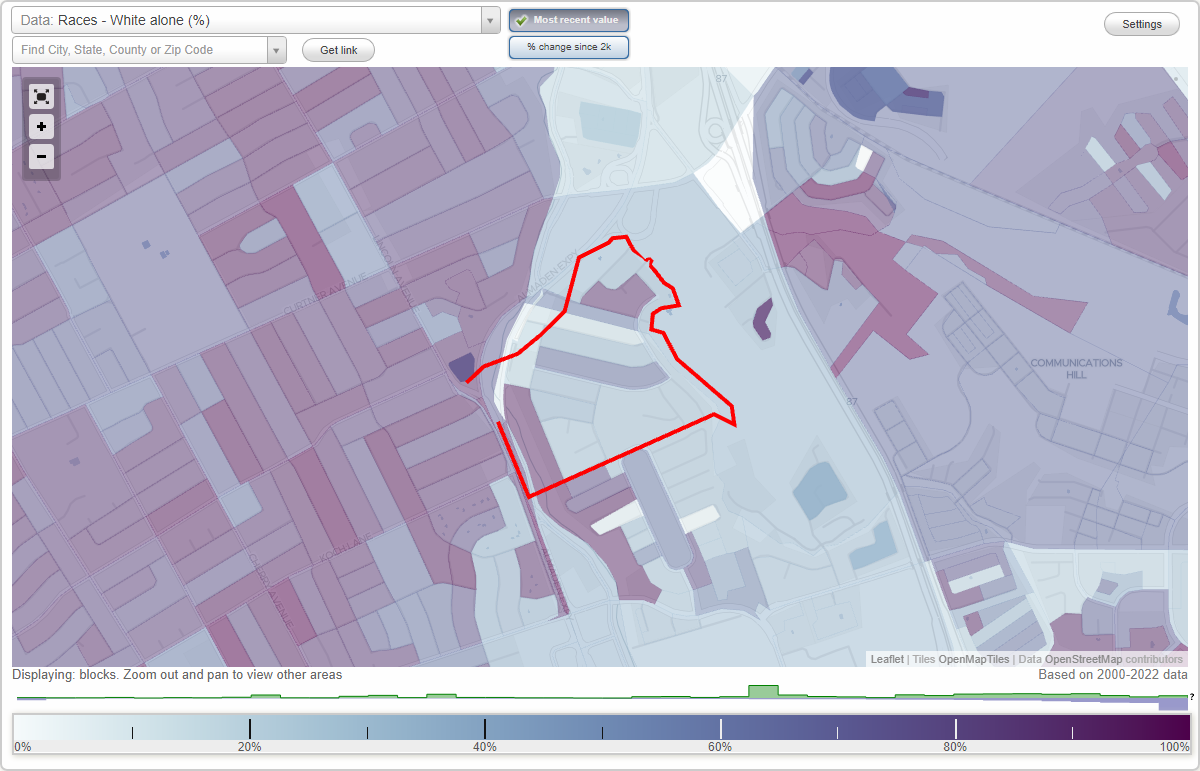
Area: 0.187 square miles
Population: 1,165
Population density:
| Canoas Garden: | 6,214 people per square mile |
| San Jose: | 5,554 people per square mile |

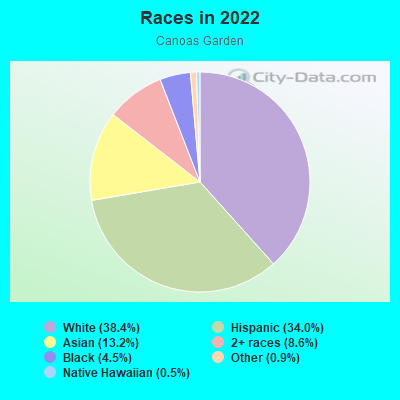
- 44838.4%White
- 39734.0%Hispanic or Latino
- 15413.2%Asian
- 1008.6%Two or more races
- 524.5%Black
- 110.9%Some other race
- 60.5%Native Hawaiian and Other
Pacific Islander
Median household income in 2022:
| Canoas Garden: | $123,505 |
| San Jose: | $133,835 |
Distribution of median household income
![Distribution of median household income]()
- 6Less than $10,000
- 13$10,000 to $19,999
- 20$20,000 to $29,999
- 18$30,000 to $39,999
- 11$40,000 to $49,999
- 51$50,000 to $59,999
- 12$60,000 to $74,999
- 50$75,000 to $99,999
- 85$100,000 to $124,999
- 44$125,000 to $149,999
- 32$150,000 to $199,999
- 124$200,000 or more

Distribution of owner-occupied house/condo value
![Distribution of owner-occupied house/condo value]()
- 6Less than $50,000
- 6$50,000 to $99,999
- 7$100,000 to $149,999
- 2$150,000 to $199,999
- 5$500,000 to $749,999
- 39$750,000 to $999,999
- 213$1,000,000 or more

Distribution of rent paid by renters
![Distribution of rent paid by renters]()
- 2$1,000 to $1,249
- 4$1,250 to $1,499
- 77$1,500 to $1,999
- 148$2,000 or more

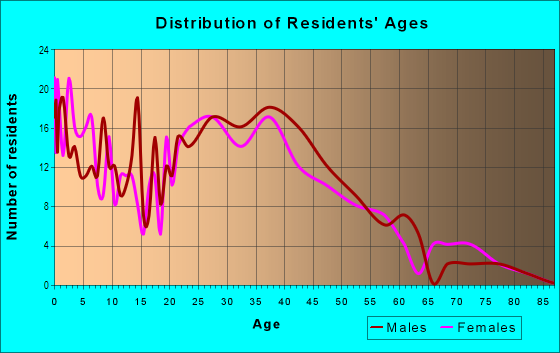
| Males: | 590 |
| Females: | 574 |
Males:
| This neighborhood: | 42.1 years |
| Whole city: | 37.6 years |
| This neighborhood: | 43.3 years |
| Whole city: | 39.1 years |
Average household size:
| Canoas Garden: | 2.6 people |
| San Jose: | 2.9 people |
Percentage of family households:
| Canoas Garden: | 52.2% |
| San Jose: | 49.9% |
| Here: | 61.6% |
| San Jose: | 53.0% |
Percentage of married-couple families with children (among all households):
| Canoas Garden: | 32.5% |
| San Jose: | 25.8% |
Percentage of single-mother households (among all households):
| Canoas Garden: | 1.4% |
| San Jose: | 5.2% |
Percentage of never married males 15 years old and over:
Percentage of never married females 15 years old and over:
| Canoas Garden: | 17.7% |
| San Jose: | 20.9% |
Percentage of never married females 15 years old and over:
| Canoas Garden: | 19.1% |
| city: | 16.7% |
Percentage of people that speak English not well or not at all:
| Canoas Garden: | 8.0% |
| San Jose: | 11.4% |
Percentage of people born in this state:
Percentage of people born in another U.S. state:
Percentage of native residents but born outside the U.S.:
Percentage of foreign born residents:
| Here: | 51.8% |
| San Jose: | 46.1% |
Percentage of people born in another U.S. state:
| Canoas Garden: | 30.5% |
| San Jose: | 10.4% |
Percentage of native residents but born outside the U.S.:
| Here: | 3.2% |
| city: | 1.7% |
Percentage of foreign born residents:
| Here: | 14.5% |
| San Jose: | 41.8% |
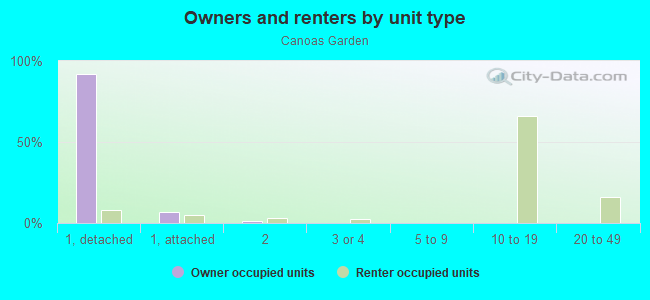
Owner-occupied
Renter-occupied

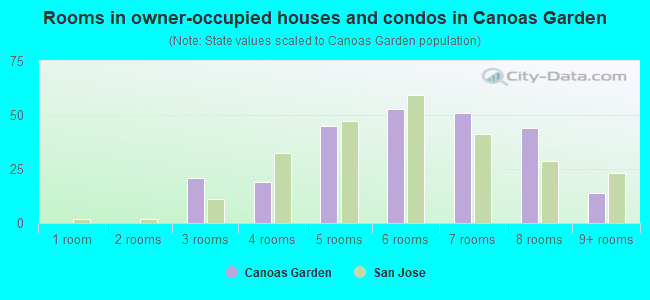
- Rooms in owner-occupied houses and condos in Canoas Garden
- 01 room
- 02 rooms
- 213 rooms
- 194 rooms
- 455 rooms
- 536 rooms
- 517 rooms
- 448 rooms
- 149+ rooms
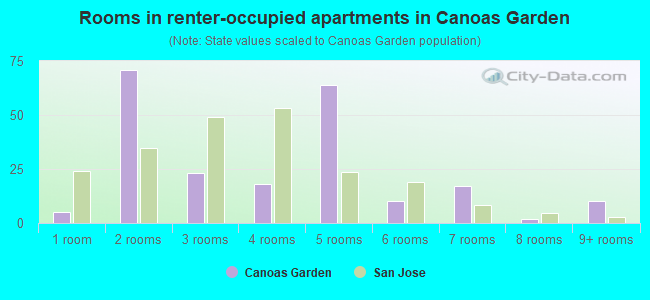
- Rooms in renter-occupied apartments in Canoas Garden
- 51 room
- 712 rooms
- 233 rooms
- 184 rooms
- 645 rooms
- 106 rooms
- 177 rooms
- 28 rooms
- 109+ rooms
Owner-occupied
Renter-occupied
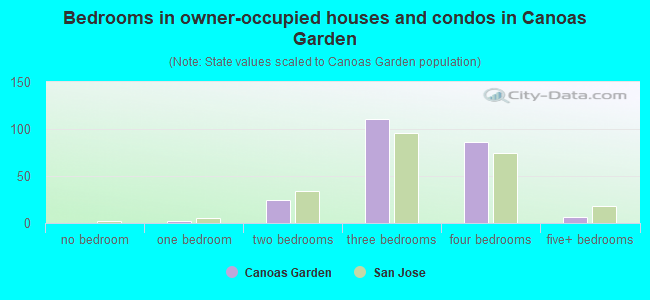
- Bedrooms in owner-occupied houses and condos in Canoas Garden
- 0no bedroom
- 21 bedroom
- 252 bedrooms
- 1113 bedrooms
- 864 bedrooms
- 65+ bedrooms
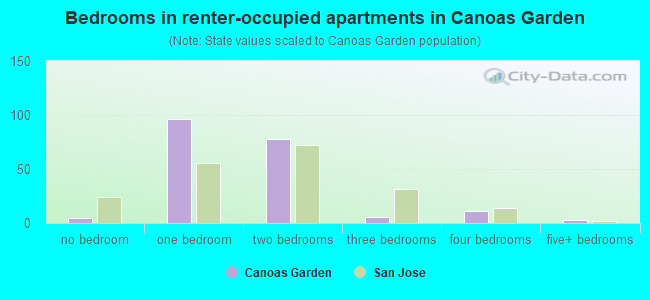
- Bedrooms in renter-occupied apartments in Canoas Garden
- 5no bedroom
- 961 bedroom
- 782 bedrooms
- 63 bedrooms
- 114 bedrooms
- 35+ bedrooms
Average number of cars or other vehicles available in houses/condos:
Average number of cars or other vehicles available in apartments:
| This neighborhood: | 2.3 |
| San Jose: | 2.3 |
Average number of cars or other vehicles available in apartments:
| Here: | 1.2 |
| city: | 1.6 |
Percentage of units with a mortgage:
| Canoas Garden: | 72.0% |
| San Jose: | 66.9% |
Housing prices:
- Average estimated value of detached houses in 2022 (55.1% of all units):
Canoas Garden: $1,809,848 San Jose: $1,532,815
- Average estimated value of townhouses or other attached units in 2022 (4.0% of all units):
This neighborhood: $1,063,820 city: $1,024,857
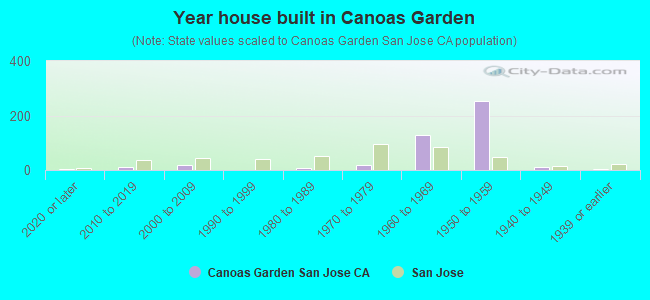
- Year house built in Canoas Garden
- 22020 or later
- 112010 to 2019
- 172000 to 2009
- 01990 to 1999
- 71980 to 1989
- 171970 to 1979
- 1291960 to 1969
- 2521950 to 1959
- 121940 to 1949
- 31939 or earlier
City-data.com crime index for city in 2020 (higher means more crime):
| City: | 268.4 |
| U.S. average: | 219.5 |
Travel time to work (commute)
![Travel time to work (commute)]()
- 3Less than 5 minutes
- 85 to 9 minutes
- 710 to 14 minutes
- 9915 to 19 minutes
- 10320 to 24 minutes
- 6025 to 29 minutes
- 4830 to 34 minutes
- 335 to 39 minutes
- 1240 to 44 minutes
- 4145 to 59 minutes
- 560 to 89 minutes
- 1290 or more minutes

Means of transportation to work
![Means of transportation to work]()
- 81.0%587Drove a car alone
- 3.3%24Carpooled
- 3.7%27Bus
- 0.7%5Long-distance train or commuter rail
- 0.1%1Taxi
- 1.1%8Bicycle
- 0.7%5Other means
- 11.3%82Worked at home

Time leaving home to go to work
![Time leaving home to go to work]()
- 812:00 a.m. to 4:59 a.m.
- 25:00 a.m. to 5:29 a.m.
- 95:30 a.m. to 5:59 a.m.
- 86:00 a.m. to 6:29 a.m.
- 276:30 a.m. to 6:59 a.m.
- 537:00 a.m. to 7:29 a.m.
- 567:30 a.m. to 7:59 a.m.
- 838:00 a.m. to 8:29 a.m.
- 218:30 a.m. to 8:59 a.m.
- 729:00 a.m. to 9:59 a.m.
- 1710:00 a.m. to 10:59 a.m.
- 1111:00 a.m. to 11:59 a.m.
- 2412:00 p.m. to 3:59 p.m.
- 294:00 p.m. to 11:59 p.m.

Occupations of males:
- Percentage of males in management occupations (except farmers):
Here: 43.3% city: 13.0%
- Percentage of males in business and financial operations occupations:
Here: 4.4% city: 4.6%
- Percentage of males in computer and mathematical occupations:
Here: 4.7% city: 13.6%
- Percentage of males in architecture and engineering occupations:
Here: 6.5% city: 10.2%
- Percentage of males in community and social services occupations:
Here: 1.1% city: 0.8%
- Percentage of males in education, training, and library occupations:
Here: 3.6% city: 2.8%
- Percentage of males in arts, design, entertainment, sports, and media occupations:
Here: 2.7% city: 1.8%
- Percentage of males in healthcare practitioners and technical occupations:
Here: 1.1% city: 2.0%
- Percentage of males in service occupations:
Here: 31.5% city: 12.7%
- Percentage of males in sales and office occupations:
Here: 6.6% city: 12.8%
- Percentage of males in production occupations:
Here: 2.3% city: 5.5%
- Percentage of males in material moving occupations:
Here: 3.0% city: 3.1%
Occupations of females:
- Percentage of females in management occupations (except farmers):
Here: 20.0% city: 11.0%
- Percentage of females in business and financial operations occupations:
Here: 4.2% city: 8.6%
- Percentage of females in computer and mathematical occupations:
Here: 4.2% city: 5.4%
- Percentage of females in architecture and engineering occupations:
Here: 2.9% city: 2.8%
- Percentage of females in legal occupations:
Here: 2.1% city: 1.3%
- Percentage of females in education, training, and library occupations:
Here: 25.7% city: 8.1%
- Percentage of females in arts, design, entertainment, sports, and media occupations:
Here: 8.0% city: 2.0%
- Percentage of females in service occupations:
Here: 19.5% city: 21.7%
- Percentage of females in sales and office occupations:
Here: 9.0% city: 22.0%
- Percentage of females in production occupations:
Here: 1.7% city: 4.0%
- Percentage of females in material moving occupations:
Here: 1.7% city: 1.5%
Percentage of people 16-64 in Armed Forces:
| Canoas Garden: | 6.4% |
| San Jose: | 0.0% |
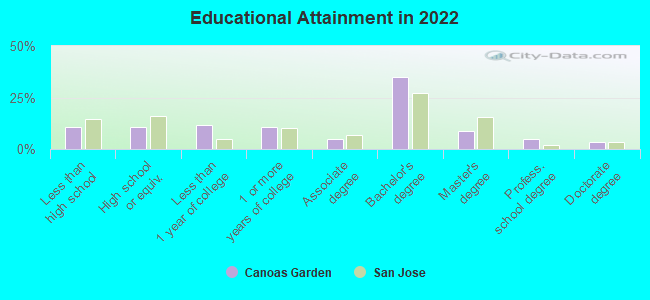
Education in this neighborhood (subdivision or community):
- Percentage of people 3 years and older in K-12 schools:
Canoas Garden: 17.4% San Jose: 16.1%
- Percentage of people 3 years and older in undergraduate colleges:
Canoas Garden: 2.5% San Jose: 6.5%
- Percentage of people 3 years and older in grad. or professional schools:
Canoas Garden: 0.4% San Jose: 2.0%
- Percentage of students K-12 enrolled in private schools:
Canoas Garden: 33.0% San Jose: 14.9%
Percentage of population below poverty level:
| Canoas Garden: | 2.9% |
| San Jose: | 9.0% |
Median year owner moved in (as recorded in 2022):
Median year renter moved in (as recorded in 2022):
| Canoas Garden: | 2004 |
| San Jose: | 2008 |
Median year renter moved in (as recorded in 2022):
| Canoas Garden: | 2012 |
| San Jose: | 2020 |
Percentage of married-couple families with both working:
| Canoas Garden: | 96.1% |
| San Jose: | 72.5% |
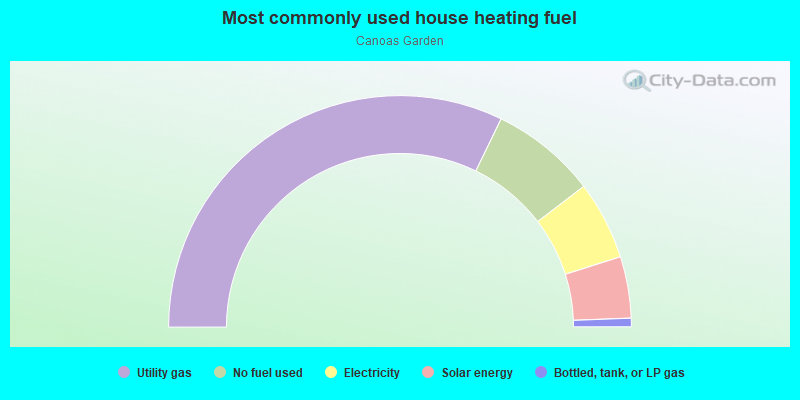
- 64.4%Utility gas
- 14.8%No fuel used
- 11.0%Electricity
- 8.6%Solar energy
- 1.2%Bottled, tank, or LP gas
Roads and streets:
Kingfisher Dr
Length: 0.41 miles
Directions: E-W, SW-NE
Address range: 800 to 999
Directions: E-W, SW-NE
Address range: 800 to 999
Skylark Dr
Length: 0.40 miles
Directions: N-S, SE-NW
Address range: 2400 to 2799
Directions: N-S, SE-NW
Address range: 2400 to 2799
Hummingbird Dr
Length: 0.35 miles
Directions: E-W, SW-NE
Address range: 800 to 999
Directions: E-W, SW-NE
Address range: 800 to 999
Redbird Dr
Length: 0.30 miles
Direction: E-W
Address range: 800 to 928
Direction: E-W
Address range: 800 to 928
Wren Dr
Length: 0.30 miles
Directions: E-W, SE-NW, SW-NE
Address range: 800 to 955
Directions: E-W, SE-NW, SW-NE
Address range: 800 to 955
Nightingale Dr
Length: 0.26 miles
Directions: E-W, N-S, SE-NW, SW-NE
Address range: 2400 to 2608
Directions: E-W, N-S, SE-NW, SW-NE
Address range: 2400 to 2608
Rinconada Dr
Length: 0.20 miles
Directions: N-S, SW-NE
Address range: 2400 to 2499
Directions: N-S, SW-NE
Address range: 2400 to 2499
Thrush Dr
Length: 0.19 miles
Directions: N-S, SE-NW
Address range: 2500 to 2699
Directions: N-S, SE-NW
Address range: 2500 to 2699
Ironwood Dr
Length: 0.17 miles
Direction: E-W
Address range: 850 to 899
Direction: E-W
Address range: 850 to 899
Bluejay Dr
Length: 0.17 miles
Directions: E-W, SW-NE
Address range: 800 to 1003
Directions: E-W, SW-NE
Address range: 800 to 1003
Pebble Beach Dr
Length: 0.17 miles
Directions: E-W, SE-NW, SW-NE
Address range: 2400 to 2499
Directions: E-W, SE-NW, SW-NE
Address range: 2400 to 2499
Lanewood Dr
Length: 0.16 miles
Direction: E-W
Address range: 900 to 999
Direction: E-W
Address range: 900 to 999
Bobolink Dr
Length: 0.13 miles
Direction: SE-NW
Address range: 2500 to 2699
Direction: SE-NW
Address range: 2500 to 2699
Apple Valley Dr
Length: 0.08 miles
Direction: SE-NW
Address range: 800 to 899
Direction: SE-NW
Address range: 800 to 899
Thrush Ct
Length: 0.07 miles
Directions: E-W, SW-NE
Address range: 2600 to 2799
Directions: E-W, SW-NE
Address range: 2600 to 2799
Lanewood Ct
Length: 0.03 miles
Direction: N-S
Address range: 900 to 999
Direction: N-S
Address range: 900 to 999
Pebble Beach Ct
Length: 0.02 miles
Direction: SE-NW
Address range: 2400 to 2499
Direction: SE-NW
Address range: 2400 to 2499
Other features:
Canoas Crk
Length: 0.32 miles
Directions: E-W, N-S, SE-NW
Directions: E-W, N-S, SE-NW