Cameron Village neighborhood in Baltimore, Maryland (MD), 21212, 21239 detailed profile
Settings
X

Business Search - 14 Million verified businesses
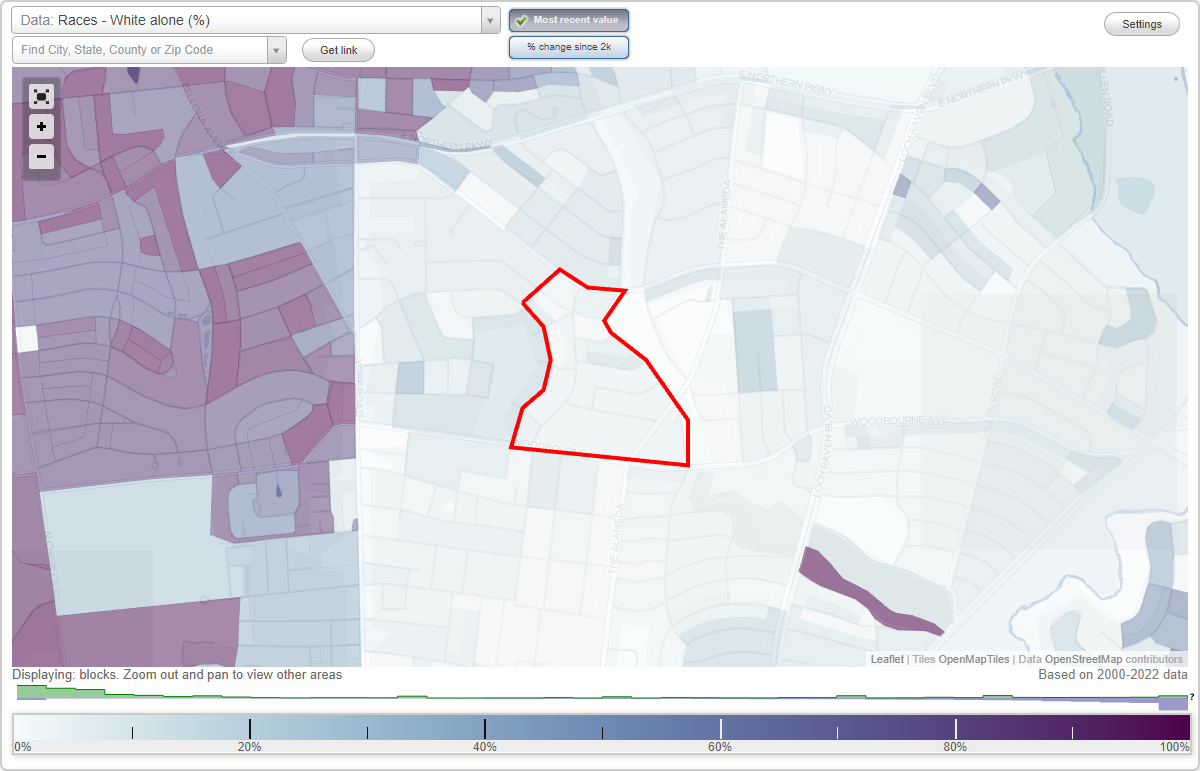
Area: 0.107 square miles
Population: 901
Population density:
| Cameron Village: | 8,457 people per square mile |
| Baltimore: | 7,053 people per square mile |

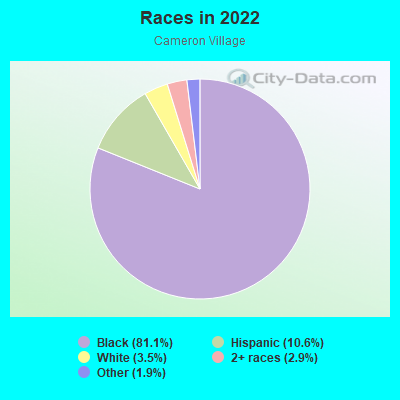
- 78281.1%Black
- 10210.6%Hispanic or Latino
- 343.5%White
- 282.9%Two or more races
- 181.9%Some other race
Distribution of median household income
![Distribution of median household income]()
- 17Less than $10,000
- 20$10,000 to $19,999
- 65$20,000 to $29,999
- 61$30,000 to $39,999
- 59$40,000 to $49,999
- 141$50,000 to $59,999
- 56$60,000 to $74,999
- 111$75,000 to $99,999
- 18$100,000 to $124,999
- 51$125,000 to $149,999
- 43$150,000 to $199,999
- 13$200,000 or more

Distribution of owner-occupied house/condo value
![Distribution of owner-occupied house/condo value]()
- 51Less than $50,000
- 65$50,000 to $99,999
- 99$100,000 to $149,999
- 48$150,000 to $199,999
- 55$200,000 to $249,999
- 27$250,000 to $299,999
- 10$300,000 to $399,999
- 8$400,000 to $499,999
- 7$500,000 to $749,999
- 13$1,000,000 or more

Distribution of rent paid by renters
![Distribution of rent paid by renters]()
- 6Less than $100
- 8$300 to $399
- 16$500 to $599
- 30$600 to $699
- 13$700 to $799
- 28$800 to $899
- 142$900 to $999
- 20$1,000 to $1,249
- 17$1,250 to $1,499
- 60$1,500 to $1,999
- 7$2,000 or more

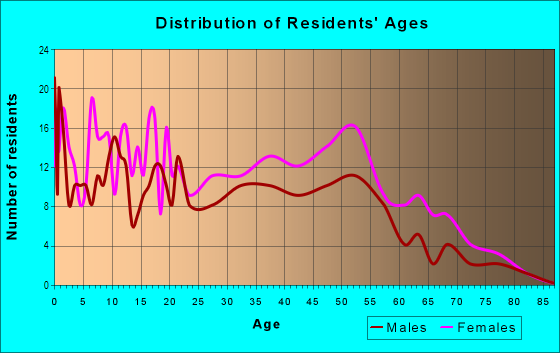
| Males: | 405 |
| Females: | 495 |
Males:
| This neighborhood: | 34.4 years |
| Whole city: | 35.0 years |
| This neighborhood: | 41.7 years |
| Whole city: | 38.2 years |
Average household size:
| Cameron Village: | 2.7 people |
| Baltimore: | 2.2 people |
Percentage of family households:
| Cameron Village: | 38.7% |
| Baltimore: | 34.2% |
| Here: | 23.7% |
| Baltimore: | 23.3% |
Percentage of married-couple families with children (among all households):
| Cameron Village: | 48.7% |
| Baltimore: | 22.4% |
Percentage of single-mother households (among all households):
| Cameron Village: | 30.2% |
| Baltimore: | 18.7% |
Percentage of never married males 15 years old and over:
Percentage of never married females 15 years old and over:
| Cameron Village: | 14.6% |
| Baltimore: | 25.1% |
Percentage of never married females 15 years old and over:
| Cameron Village: | 31.9% |
| city: | 27.5% |
Percentage of people that speak English not well or not at all:
| Cameron Village: | 1.5% |
| Baltimore: | 2.3% |
Percentage of people born in this state:
Percentage of people born in another U.S. state:
Percentage of native residents but born outside the U.S.:
Percentage of foreign born residents:
| Here: | 74.9% |
| Baltimore: | 64.4% |
Percentage of people born in another U.S. state:
| Cameron Village: | 18.4% |
| Baltimore: | 25.0% |
Percentage of native residents but born outside the U.S.:
| Here: | 0.6% |
| city: | 0.9% |
Percentage of foreign born residents:
| Here: | 6.1% |
| Baltimore: | 9.7% |
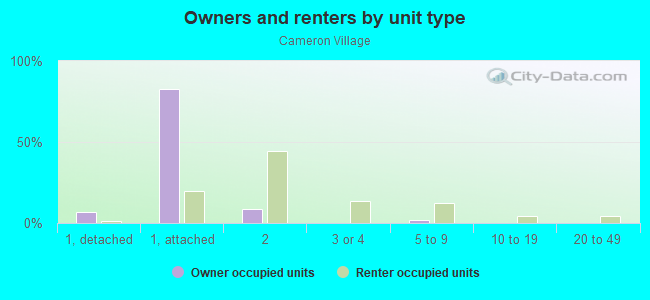
Owner-occupied
Renter-occupied

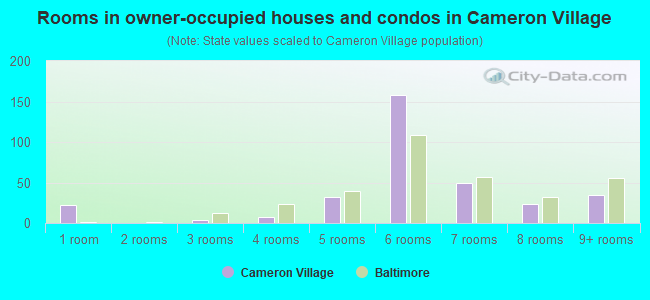
- Rooms in owner-occupied houses and condos in Cameron Village
- 221 room
- 02 rooms
- 43 rooms
- 84 rooms
- 325 rooms
- 1586 rooms
- 497 rooms
- 238 rooms
- 349+ rooms
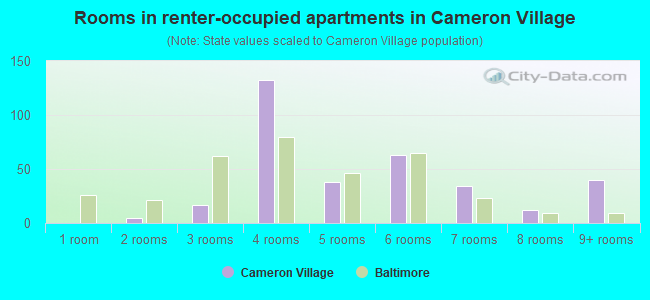
- Rooms in renter-occupied apartments in Cameron Village
- 01 room
- 52 rooms
- 173 rooms
- 1324 rooms
- 385 rooms
- 636 rooms
- 347 rooms
- 128 rooms
- 409+ rooms
Owner-occupied
Renter-occupied
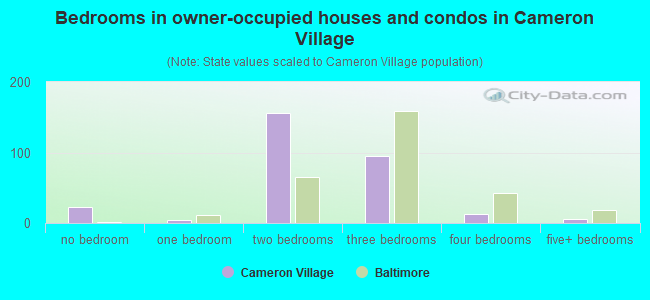
- Bedrooms in owner-occupied houses and condos in Cameron Village
- 22no bedroom
- 41 bedroom
- 1562 bedrooms
- 953 bedrooms
- 134 bedrooms
- 65+ bedrooms
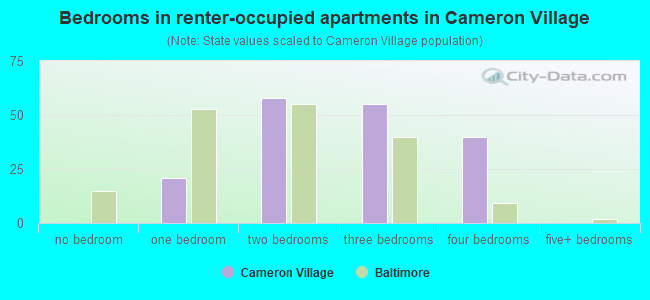
- Bedrooms in renter-occupied apartments in Cameron Village
- 0no bedroom
- 211 bedroom
- 582 bedrooms
- 553 bedrooms
- 404 bedrooms
- 05+ bedrooms
Average number of cars or other vehicles available in houses/condos:
Average number of cars or other vehicles available in apartments:
| This neighborhood: | 1.4 |
| Baltimore: | 1.5 |
Average number of cars or other vehicles available in apartments:
| Here: | 1.2 |
| city: | 0.8 |
Percentage of units with a mortgage:
| Cameron Village: | 69.2% |
| Baltimore: | 64.3% |
Housing prices:
- Average estimated value of detached houses in 2022 (4.1% of all units):
Cameron Village: $210,196 Baltimore: $350,815
- Average estimated value of townhouses or other attached units in 2022 (73.0% of all units):
This neighborhood: $202,419 city: $206,258
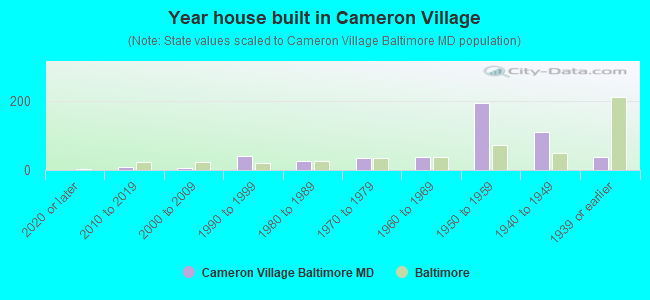
- Year house built in Cameron Village
- 02020 or later
- 82010 to 2019
- 72000 to 2009
- 411990 to 1999
- 271980 to 1989
- 351970 to 1979
- 381960 to 1969
- 1951950 to 1959
- 1101940 to 1949
- 391939 or earlier
Travel time to work (commute)
![Travel time to work (commute)]()
- 7Less than 5 minutes
- 175 to 9 minutes
- 4710 to 14 minutes
- 6515 to 19 minutes
- 8520 to 24 minutes
- 2825 to 29 minutes
- 9030 to 34 minutes
- 1735 to 39 minutes
- 1040 to 44 minutes
- 2545 to 59 minutes
- 3960 to 89 minutes
- 1990 or more minutes

Means of transportation to work
![Means of transportation to work]()
- 63.7%289Drove a car alone
- 13.9%63Carpooled
- 10.8%49Bus
- 9.0%41Subway or elevated rail
- 0.4%2Long-distance train or commuter rail
- 20.3%92Walked
- 6.4%29Other means
- 11.5%52Worked at home

Time leaving home to go to work
![Time leaving home to go to work]()
- 8312:00 a.m. to 4:59 a.m.
- 115:00 a.m. to 5:29 a.m.
- 145:30 a.m. to 5:59 a.m.
- 246:00 a.m. to 6:29 a.m.
- 136:30 a.m. to 6:59 a.m.
- 557:00 a.m. to 7:29 a.m.
- 457:30 a.m. to 7:59 a.m.
- 538:00 a.m. to 8:29 a.m.
- 148:30 a.m. to 8:59 a.m.
- 509:00 a.m. to 9:59 a.m.
- 310:00 a.m. to 10:59 a.m.
- 1111:00 a.m. to 11:59 a.m.
- 6512:00 p.m. to 3:59 p.m.
- 314:00 p.m. to 11:59 p.m.

Occupations of males:
- Percentage of males in business and financial operations occupations:
Here: 1.1% city: 5.9%
- Percentage of males in computer and mathematical occupations:
Here: 1.3% city: 6.1%
- Percentage of males in life, physical, and social science occupations:
Here: 2.1% city: 2.3%
- Percentage of males in education, training, and library occupations:
Here: 1.4% city: 5.4%
- Percentage of males in service occupations:
Here: 49.8% city: 14.7%
- Percentage of males in sales and office occupations:
Here: 17.6% city: 14.2%
- Percentage of males in construction, extraction, and maintenance occupations:
Here: 7.3% city: 5.6%
- Percentage of males in transportation occupations:
Here: 18.5% city: 6.8%
Occupations of females:
- Percentage of females in management occupations (except farmers):
Here: 5.3% city: 10.1%
- Percentage of females in business and financial operations occupations:
Here: 16.1% city: 6.6%
- Percentage of females in computer and mathematical occupations:
Here: 1.8% city: 2.4%
- Percentage of females in architecture and engineering occupations:
Here: 5.2% city: 0.9%
- Percentage of females in education, training, and library occupations:
Here: 6.6% city: 10.7%
- Percentage of females in healthcare practitioners and technical occupations:
Here: 18.6% city: 9.8%
- Percentage of females in service occupations:
Here: 15.2% city: 20.4%
- Percentage of females in sales and office occupations:
Here: 18.0% city: 22.3%
- Percentage of females in production occupations:
Here: 3.8% city: 2.3%
- Percentage of females in transportation occupations:
Here: 9.3% city: 1.7%
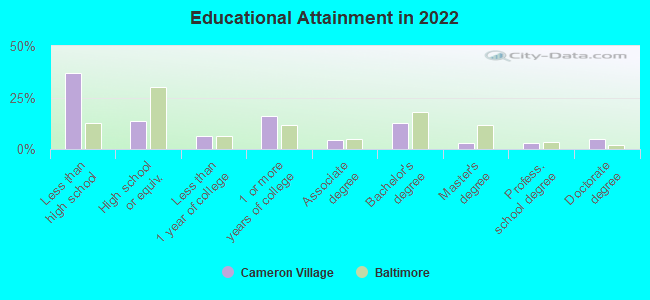
Education in this neighborhood (subdivision or community):
- Percentage of people 3 years and older in K-12 schools:
Cameron Village: 30.7% Baltimore: 14.7%
- Percentage of people 3 years and older in undergraduate colleges:
Cameron Village: 7.9% Baltimore: 6.0%
- Percentage of people 3 years and older in grad. or professional schools:
Cameron Village: 2.3% Baltimore: 2.8%
- Percentage of students K-12 enrolled in private schools:
Cameron Village: 21.2% Baltimore: 12.7%
Percentage of population below poverty level:
| Cameron Village: | 7.5% |
| Baltimore: | 18.5% |
Median year owner moved in (as recorded in 2022):
| Cameron Village: | 2002 |
| Baltimore: | 2009 |
Percentage of married-couple families with both working:
| Cameron Village: | 98.7% |
| Baltimore: | 79.2% |
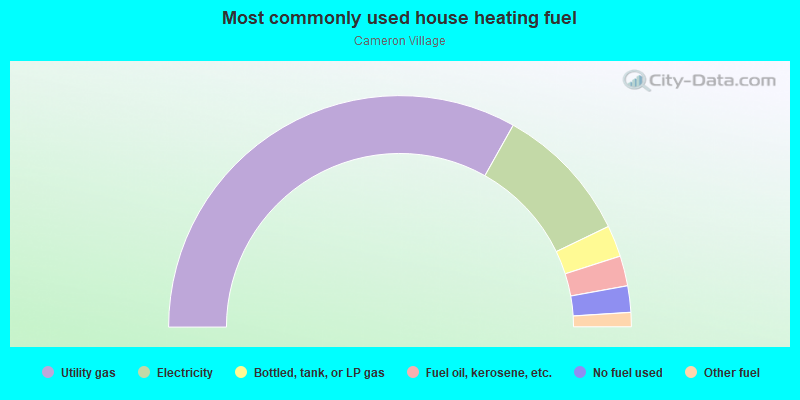
- 66.3%Utility gas
- 19.4%Electricity
- 4.4%Bottled, tank, or LP gas
- 4.2%Fuel oil, kerosene, etc.
- 3.7%No fuel used
- 2.0%Other fuel
Roads and streets:
Northwood Dr
Length: 0.49 miles
Directions: N-S, SE-NW, SW-NE
Address range: 5420 to 5699
Directions: N-S, SE-NW, SW-NE
Address range: 5420 to 5699
Midwood Ave
Length: 0.43 miles
Directions: N-S, SW-NE
Address range: 5400 to 5699
Directions: N-S, SW-NE
Address range: 5400 to 5699
Tunbridge Rd
Length: 0.28 miles
Directions: E-W, SE-NW
Address range: 1000 to 1099
Directions: E-W, SE-NW
Address range: 1000 to 1099
Cameron Rd
Length: 0.24 miles
Directions: E-W, N-S, SW-NE
Address range: 1000 to 1099
Directions: E-W, N-S, SW-NE
Address range: 1000 to 1099
Upnor Rd
Length: 0.21 miles
Directions: E-W, SW-NE
Address range: 1000 to 1099
Directions: E-W, SW-NE
Address range: 1000 to 1099
The Alameda
Length: 0.16 miles
Direction: SW-NE
Address range: 5432 to 5599
Direction: SW-NE
Address range: 5432 to 5599
Witherspoon Rd
Length: 0.11 miles
Directions: E-W, SW-NE
Address range: 1000 to 1099
Directions: E-W, SW-NE
Address range: 1000 to 1099
E Belvedere Ave
Length: 0.11 miles
Direction: E-W
Address range: 1000 to 1099
Direction: E-W
Address range: 1000 to 1099
St Dunstans Rd
Length: 0.10 miles
Direction: E-W
Address range: 1000 to 1099
Direction: E-W
Address range: 1000 to 1099
Woodbourne Ave
Length: 0.08 miles
Direction: E-W
Address range: 900 to 999
Direction: E-W
Address range: 900 to 999
Beaverbrook Rd
Length: 0.05 miles
Direction: SW-NE
Address range: 944 to 999
Direction: SW-NE
Address range: 944 to 999
Harwood Ave
Length: 0.04 miles
Direction: E-W
Address range: 952 to 999
Direction: E-W
Address range: 952 to 999