California Park neighborhood in San Rafael, California (CA), 94901 detailed profile
Settings
X


Business Search - 14 Million verified businesses
Area: 0.202 square miles
Population: 1,151
Population density:
| California Park: | 5,687 people per square mile |
| San Rafael: | 3,670 people per square mile |

- 77066.4%White
- 28224.3%Hispanic or Latino
- 484.1%Asian
- 393.4%Two or more races
- 191.6%Some other race
- 20.2%Black

Median household income in 2022:
| California Park: | $104,376 |
| San Rafael: | $113,839 |
Distribution of median household income
![Distribution of median household income]()
- 34Less than $10,000
- 15$10,000 to $19,999
- 33$20,000 to $29,999
- 12$30,000 to $39,999
- 30$40,000 to $49,999
- 33$50,000 to $59,999
- 32$60,000 to $74,999
- 31$75,000 to $99,999
- 46$100,000 to $124,999
- 62$125,000 to $149,999
- 73$150,000 to $199,999
- 152$200,000 or more

Distribution of owner-occupied house/condo value
![Distribution of owner-occupied house/condo value]()
- 10Less than $50,000
- 16$300,000 to $399,999
- 14$500,000 to $749,999
- 182$750,000 to $999,999
- 203$1,000,000 or more

Distribution of rent paid by renters
![Distribution of rent paid by renters]()
- 24$500 to $599
- 6$800 to $899
- 11$1,000 to $1,249
- 10$1,250 to $1,499
- 44$1,500 to $1,999
- 130$2,000 or more

Median rent in 2022:
| California Park: | $3,072 |
| San Rafael: | $2,001 |
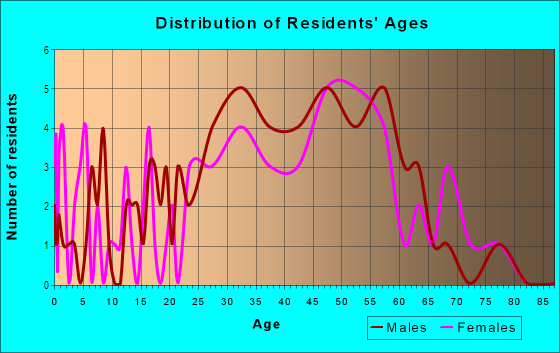
| Males: | 650 |
| Females: | 500 |
Males:
| This neighborhood: | 34.3 years |
| Whole city: | 40.6 years |
| This neighborhood: | 42.9 years |
| Whole city: | 47.6 years |
Average household size:
| California Park: | 2.4 people |
| San Rafael: | 2.5 people |
Percentage of family households:
| California Park: | 52.8% |
| San Rafael: | 41.8% |
| Here: | 58.8% |
| San Rafael: | 46.3% |
Percentage of married-couple families with children (among all households):
| California Park: | 32.7% |
| San Rafael: | 30.4% |
Percentage of single-mother households (among all households):
| California Park: | 6.8% |
| San Rafael: | 5.4% |
Percentage of never married males 15 years old and over:
Percentage of never married females 15 years old and over:
| California Park: | 14.6% |
| San Rafael: | 17.7% |
Percentage of never married females 15 years old and over:
| California Park: | 11.0% |
| city: | 16.3% |
Percentage of people that speak English not well or not at all:
| California Park: | 5.2% |
| San Rafael: | 10.4% |
Percentage of people born in this state:
Percentage of people born in another U.S. state:
Percentage of native residents but born outside the U.S.:
Percentage of foreign born residents:
| Here: | 53.0% |
| San Rafael: | 47.7% |
Percentage of people born in another U.S. state:
| California Park: | 21.2% |
| San Rafael: | 23.8% |
Percentage of native residents but born outside the U.S.:
| Here: | 1.1% |
| city: | 1.7% |
Percentage of foreign born residents:
| Here: | 24.8% |
| San Rafael: | 26.8% |

Owner-occupied
Renter-occupied


- Rooms in owner-occupied houses and condos in California Park
- 31 room
- 02 rooms
- 73 rooms
- 464 rooms
- 625 rooms
- 896 rooms
- 297 rooms
- 638 rooms
- 539+ rooms

- Rooms in renter-occupied apartments in California Park
- 141 room
- 392 rooms
- 263 rooms
- 394 rooms
- 535 rooms
- 296 rooms
- 167 rooms
- 08 rooms
- 69+ rooms
Owner-occupied
Renter-occupied

- Bedrooms in owner-occupied houses and condos in California Park
- 3no bedroom
- 31 bedroom
- 702 bedrooms
- 1783 bedrooms
- 754 bedrooms
- 165+ bedrooms

- Bedrooms in renter-occupied apartments in California Park
- 15no bedroom
- 611 bedroom
- 502 bedrooms
- 523 bedrooms
- 244 bedrooms
- 75+ bedrooms
Average number of cars or other vehicles available in houses/condos:
Average number of cars or other vehicles available in apartments:
| This neighborhood: | 2.4 |
| San Rafael: | 2.0 |
Average number of cars or other vehicles available in apartments:
| Here: | 1.8 |
| city: | 1.4 |
Percentage of units with a mortgage:
| California Park: | 78.3% |
| San Rafael: | 66.6% |

- Year house built in California Park
- 02020 or later
- 52010 to 2019
- 42000 to 2009
- 111990 to 1999
- 261980 to 1989
- 601970 to 1979
- 551960 to 1969
- 1441950 to 1959
- 1931940 to 1949
- 551939 or earlier

City-data.com crime index for city in 2020 (higher means more crime):
| City: | 294.6 |
| U.S. average: | 219.5 |
Travel time to work (commute)
![Travel time to work (commute)]()
- 12Less than 5 minutes
- 305 to 9 minutes
- 5310 to 14 minutes
- 6115 to 19 minutes
- 3020 to 24 minutes
- 1425 to 29 minutes
- 5730 to 34 minutes
- 1335 to 39 minutes
- 1640 to 44 minutes
- 3545 to 59 minutes
- 2860 to 89 minutes

Means of transportation to work
![Means of transportation to work]()
- 55.1%377Drove a car alone
- 2.5%17Carpooled
- 6.0%41Bus
- 2.0%14Ferryboat
- 0.7%5Motorcycle
- 1.0%7Bicycle
- 2.6%18Walked
- 35.8%245Worked at home

Time leaving home to go to work
![Time leaving home to go to work]()
- 612:00 a.m. to 4:59 a.m.
- 55:00 a.m. to 5:29 a.m.
- 115:30 a.m. to 5:59 a.m.
- 386:00 a.m. to 6:29 a.m.
- 426:30 a.m. to 6:59 a.m.
- 517:00 a.m. to 7:29 a.m.
- 317:30 a.m. to 7:59 a.m.
- 598:00 a.m. to 8:29 a.m.
- 378:30 a.m. to 8:59 a.m.
- 289:00 a.m. to 9:59 a.m.
- 510:00 a.m. to 10:59 a.m.
- 511:00 a.m. to 11:59 a.m.
- 2012:00 p.m. to 3:59 p.m.
- 94:00 p.m. to 11:59 p.m.

Occupations of males:
- Percentage of males in management occupations (except farmers):
Here: 16.0% city: 14.6%
- Percentage of males in business and financial operations occupations:
Here: 6.6% city: 5.8%
- Percentage of males in computer and mathematical occupations:
Here: 2.2% city: 6.2%
- Percentage of males in architecture and engineering occupations:
Here: 1.2% city: 2.2%
- Percentage of males in education, training, and library occupations:
Here: 5.9% city: 3.9%
- Percentage of males in arts, design, entertainment, sports, and media occupations:
Here: 10.5% city: 5.0%
- Percentage of males in service occupations:
Here: 16.9% city: 14.5%
- Percentage of males in sales and office occupations:
Here: 17.9% city: 17.3%
- Percentage of males in farming, fishing, and forestry occupations:
Here: 6.0% city: 1.3%
- Percentage of males in construction, extraction, and maintenance occupations:
Here: 10.4% city: 13.3%
- Percentage of males in material moving occupations:
Here: 1.0% city: 2.7%
Occupations of females:
- Percentage of females in management occupations (except farmers):
Here: 13.4% city: 13.8%
- Percentage of females in business and financial operations occupations:
Here: 15.4% city: 5.9%
- Percentage of females in community and social services occupations:
Here: 1.1% city: 1.8%
- Percentage of females in education, training, and library occupations:
Here: 15.4% city: 8.1%
- Percentage of females in arts, design, entertainment, sports, and media occupations:
Here: 8.5% city: 3.7%
- Percentage of females in healthcare practitioners and technical occupations:
Here: 4.5% city: 7.0%
- Percentage of females in service occupations:
Here: 16.6% city: 21.9%
- Percentage of females in sales and office occupations:
Here: 23.8% city: 25.2%
Education in this neighborhood (subdivision or community):
- Percentage of people 3 years and older in K-12 schools:
California Park: 16.9% San Rafael: 15.4%
- Percentage of people 3 years and older in undergraduate colleges:
California Park: 4.7% San Rafael: 6.4%
- Percentage of people 3 years and older in grad. or professional schools:
California Park: 1.9% San Rafael: 1.2%
- Percentage of students K-12 enrolled in private schools:
California Park: 18.5% San Rafael: 10.7%
Percentage of population below poverty level:
| California Park: | 8.3% |
| San Rafael: | 8.9% |
Median year owner moved in (as recorded in 2022):
Median year renter moved in (as recorded in 2022):
| California Park: | 2004 |
| San Rafael: | 2005 |
Median year renter moved in (as recorded in 2022):
| California Park: | 2016 |
| San Rafael: | 2015 |
Percentage of married-couple families with both working:
| California Park: | 94.0% |
| San Rafael: | 75.7% |

- 65.1%Utility gas
- 16.8%Electricity
- 9.1%No fuel used
- 5.3%Bottled, tank, or LP gas
- 3.6%Solar energy
Limited-access highways (interstate or state) in this neighborhood:
Redwood Hwy (US Hwy 101)
Length: 0.50 miles
Directions: N-S, SW-NE
Directions: N-S, SW-NE
Roads and streets:
Tiburon Blvd
Length: 0.62 miles
Directions: E-W, N-S, SE-NW, SW-NE
Address range: 100 to 299
Directions: E-W, N-S, SE-NW, SW-NE
Address range: 100 to 299
Bret Harte Rd
Length: 0.57 miles
Directions: E-W, N-S, SE-NW, SW-NE
Address range: 4 to 82
Directions: E-W, N-S, SE-NW, SW-NE
Address range: 4 to 82
Hwy 101 (S Hwy 101)
Length: 0.52 miles
Directions: N-S, SW-NE
Directions: N-S, SW-NE
Auburn St
Length: 0.46 miles
Directions: E-W, N-S, SE-NW, SW-NE
Address range: 100 to 399
Directions: E-W, N-S, SE-NW, SW-NE
Address range: 100 to 399
Woodland Ave
Length: 0.40 miles
Directions: E-W, SE-NW, SW-NE
Address range: 1 to 14
Directions: E-W, SE-NW, SW-NE
Address range: 1 to 14
Orange St
Length: 0.32 miles
Directions: E-W, N-S, SE-NW
Address range: 1 to 199
Directions: E-W, N-S, SE-NW
Address range: 1 to 199
Andersen Dr
Length: 0.23 miles
Direction: SE-NW
Address range: 700 to 805
Direction: SE-NW
Address range: 700 to 805
Oakhurst Rd
Length: 0.23 miles
Directions: E-W, SE-NW, SW-NE
Address range: 1 to 99
Directions: E-W, SE-NW, SW-NE
Address range: 1 to 99
Albion St
Length: 0.23 miles
Directions: E-W, N-S, SE-NW, SW-NE
Address range: 1 to 99
Directions: E-W, N-S, SE-NW, SW-NE
Address range: 1 to 99
Altena St
Length: 0.17 miles
Directions: E-W, N-S, SE-NW, SW-NE
Address range: 1 to 199
Directions: E-W, N-S, SE-NW, SW-NE
Address range: 1 to 199
Rose St
Length: 0.15 miles
Directions: N-S, SE-NW, SW-NE
Address range: 1 to 99
Directions: N-S, SE-NW, SW-NE
Address range: 1 to 99
Blossom Dr
Length: 0.11 miles
Direction: SW-NE
Direction: SW-NE
Gilbert St
Length: 0.08 miles
Directions: N-S, SW-NE
Address range: 1 to 99
Directions: N-S, SW-NE
Address range: 1 to 99
Mliss Ln
Length: 0.05 miles
Direction: SE-NW
Address range: 1 to 99
Direction: SE-NW
Address range: 1 to 99
Weber Ln
Length: 0.04 miles
Direction: SW-NE
Address range: 1 to 99
Direction: SW-NE
Address range: 1 to 99
Orange Ct
Length: 0.03 miles
Directions: N-S, SE-NW, SW-NE
Address range: 1 to 99
Directions: N-S, SE-NW, SW-NE
Address range: 1 to 99
Railroad features:
Northwestern Pacific RR
Length: 0.33 miles
Direction: SE-NW
Direction: SE-NW