Burning Tree neighborhood in San Jose, California (CA), 95119 detailed profile
Settings
X

Business Search - 14 Million verified businesses
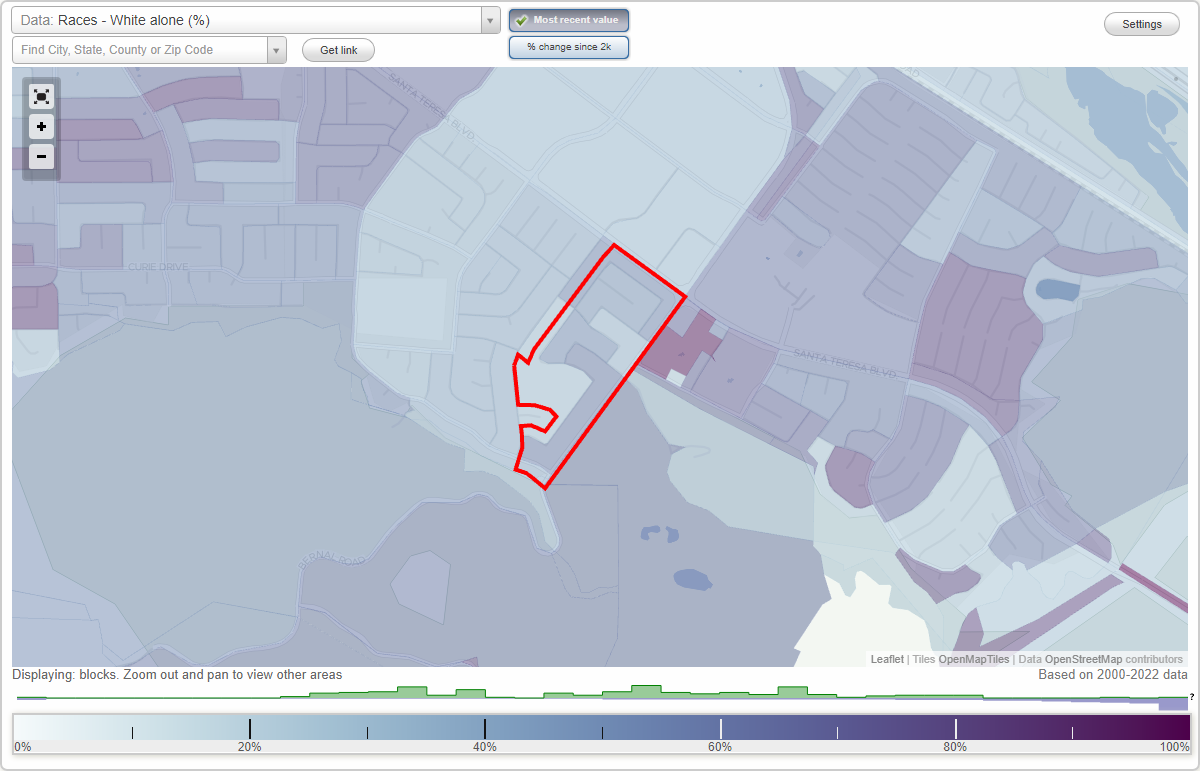
Area: 0.103 square miles
Population: 881
Population density:
| Burning Tree: | 8,533 people per square mile |
| San Jose: | 5,554 people per square mile |

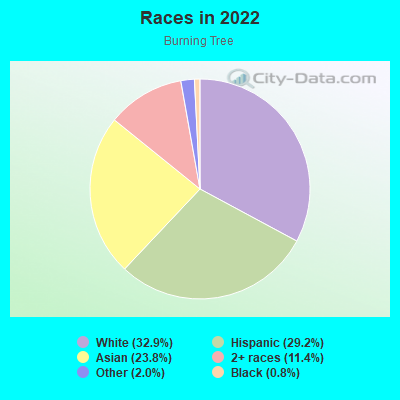
- 29532.9%White
- 26229.2%Hispanic or Latino
- 21423.8%Asian
- 10211.4%Two or more races
- 182.0%Some other race
- 70.8%Black
Median household income in 2022:
| Burning Tree: | $166,740 |
| San Jose: | $133,835 |
Distribution of median household income
![Distribution of median household income]()
- 9Less than $10,000
- 26$10,000 to $19,999
- 17$20,000 to $29,999
- 13$30,000 to $39,999
- 17$40,000 to $49,999
- 5$50,000 to $59,999
- 9$60,000 to $74,999
- 8$75,000 to $99,999
- 16$100,000 to $124,999
- 50$125,000 to $149,999
- 76$150,000 to $199,999
- 105$200,000 or more

Distribution of owner-occupied house/condo value
![Distribution of owner-occupied house/condo value]()
- 7Less than $50,000
- 6$100,000 to $149,999
- 10$150,000 to $199,999
- 7$200,000 to $249,999
- 9$250,000 to $299,999
- 4$400,000 to $499,999
- 11$500,000 to $749,999
- 53$750,000 to $999,999
- 156$1,000,000 or more

Distribution of rent paid by renters
![Distribution of rent paid by renters]()
- 1$400 to $499
- 4$600 to $699
- 11$700 to $799
- 10$800 to $899
- 15$1,000 to $1,249
- 4$1,250 to $1,499
- 21$1,500 to $1,999
- 65$2,000 or more

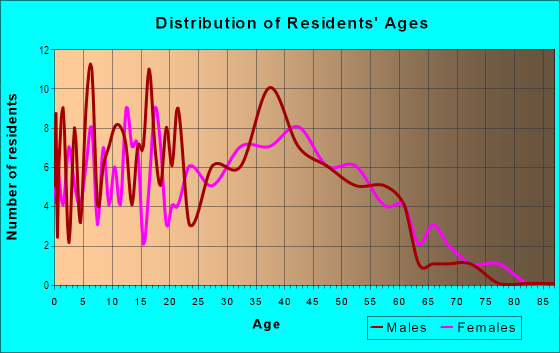
| Males: | 475 |
| Females: | 405 |
Males:
| This neighborhood: | 41.9 years |
| Whole city: | 37.6 years |
| This neighborhood: | 42.3 years |
| Whole city: | 39.1 years |
Average household size:
| Burning Tree: | 7.8 people |
| San Jose: | 2.9 people |
Percentage of family households:
| Burning Tree: | 62.2% |
| San Jose: | 49.9% |
| Here: | 75.5% |
| San Jose: | 53.0% |
Percentage of married-couple families with children (among all households):
| Burning Tree: | 35.0% |
| San Jose: | 25.8% |
Percentage of single-mother households (among all households):
| Burning Tree: | 17.5% |
| San Jose: | 5.2% |
Percentage of never married males 15 years old and over:
Percentage of never married females 15 years old and over:
| Burning Tree: | 17.2% |
| San Jose: | 20.9% |
Percentage of never married females 15 years old and over:
| Burning Tree: | 7.1% |
| city: | 16.7% |
Percentage of people that speak English not well or not at all:
| Burning Tree: | 1.7% |
| San Jose: | 11.4% |
Percentage of people born in this state:
Percentage of people born in another U.S. state:
Percentage of native residents but born outside the U.S.:
Percentage of foreign born residents:
| Here: | 49.5% |
| San Jose: | 46.1% |
Percentage of people born in another U.S. state:
| Burning Tree: | 13.3% |
| San Jose: | 10.4% |
Percentage of native residents but born outside the U.S.:
| Here: | 3.2% |
| city: | 1.7% |
Percentage of foreign born residents:
| Here: | 34.0% |
| San Jose: | 41.8% |
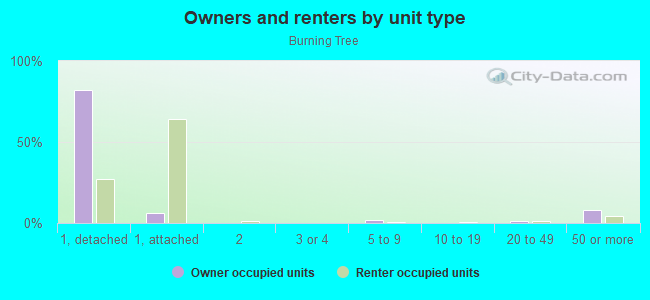
Owner-occupied
Renter-occupied

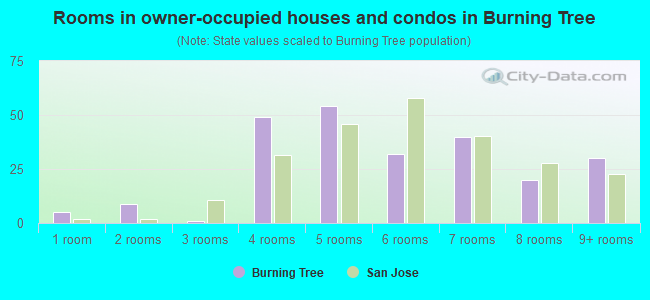
- Rooms in owner-occupied houses and condos in Burning Tree
- 51 room
- 92 rooms
- 13 rooms
- 494 rooms
- 545 rooms
- 326 rooms
- 407 rooms
- 208 rooms
- 309+ rooms
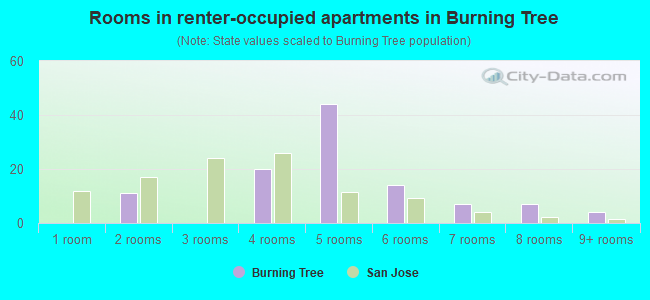
- Rooms in renter-occupied apartments in Burning Tree
- 01 room
- 112 rooms
- 03 rooms
- 204 rooms
- 445 rooms
- 146 rooms
- 77 rooms
- 78 rooms
- 49+ rooms
Owner-occupied
Renter-occupied
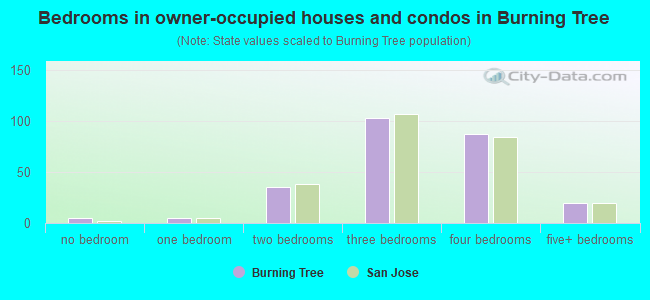
- Bedrooms in owner-occupied houses and condos in Burning Tree
- 5no bedroom
- 51 bedroom
- 352 bedrooms
- 1033 bedrooms
- 874 bedrooms
- 205+ bedrooms
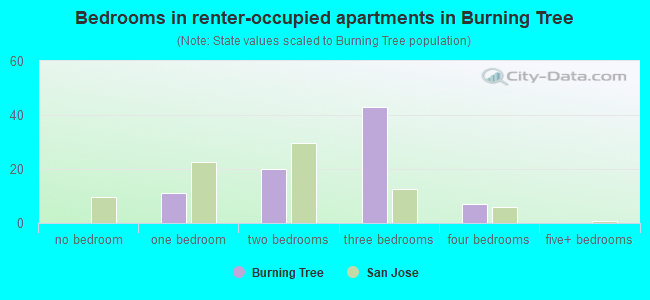
- Bedrooms in renter-occupied apartments in Burning Tree
- 0no bedroom
- 111 bedroom
- 202 bedrooms
- 433 bedrooms
- 74 bedrooms
- 05+ bedrooms
Average number of cars or other vehicles available in houses/condos:
Average number of cars or other vehicles available in apartments:
| This neighborhood: | 2.0 |
| San Jose: | 2.3 |
Average number of cars or other vehicles available in apartments:
| Here: | 1.9 |
| city: | 1.6 |
Percentage of units with a mortgage:
| Burning Tree: | 70.6% |
| San Jose: | 66.9% |
Average estimated value of detached houses in 2022 (90.6% of all units):
| Burning Tree: | $1,100,182 |
| San Jose: | $1,532,815 |
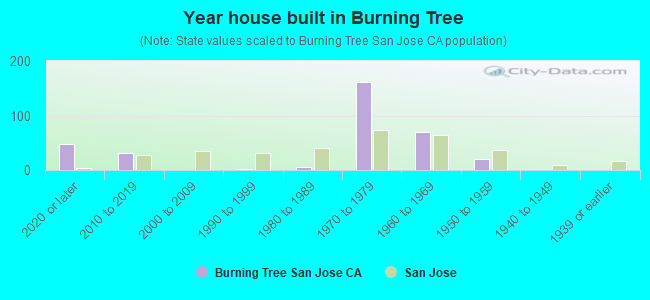
- Year house built in Burning Tree
- 482020 or later
- 312010 to 2019
- 02000 to 2009
- 11990 to 1999
- 51980 to 1989
- 1621970 to 1979
- 701960 to 1969
- 201950 to 1959
- 01940 to 1949
- 01939 or earlier
City-data.com crime index for city in 2020 (higher means more crime):
| City: | 268.4 |
| U.S. average: | 219.5 |
Travel time to work (commute)
![Travel time to work (commute)]()
- 3Less than 5 minutes
- 345 to 9 minutes
- 1410 to 14 minutes
- 2315 to 19 minutes
- 5020 to 24 minutes
- 2925 to 29 minutes
- 6030 to 34 minutes
- 2235 to 39 minutes
- 2440 to 44 minutes
- 3245 to 59 minutes
- 3960 to 89 minutes
- 1590 or more minutes

Means of transportation to work
![Means of transportation to work]()
- 61.1%269Drove a car alone
- 6.6%29Carpooled
- 5.2%23Bus
- 0.7%3Subway or elevated rail
- 0.5%2Long-distance train or commuter rail
- 1.6%7Light rail, streetcar or trolley
- 3.9%17Motorcycle
- 2.0%9Bicycle
- 1.6%7Other means
- 17.5%77Worked at home

Time leaving home to go to work
![Time leaving home to go to work]()
- 1812:00 a.m. to 4:59 a.m.
- 55:00 a.m. to 5:29 a.m.
- 235:30 a.m. to 5:59 a.m.
- 146:00 a.m. to 6:29 a.m.
- 266:30 a.m. to 6:59 a.m.
- 547:00 a.m. to 7:29 a.m.
- 347:30 a.m. to 7:59 a.m.
- 658:00 a.m. to 8:29 a.m.
- 268:30 a.m. to 8:59 a.m.
- 309:00 a.m. to 9:59 a.m.
- 2410:00 a.m. to 10:59 a.m.
- 1211:00 a.m. to 11:59 a.m.
- 1212:00 p.m. to 3:59 p.m.
- 184:00 p.m. to 11:59 p.m.

Occupations of males:
- Percentage of males in management occupations (except farmers):
Here: 26.1% city: 13.0%
- Percentage of males in business and financial operations occupations:
Here: 2.8% city: 4.6%
- Percentage of males in computer and mathematical occupations:
Here: 11.7% city: 13.6%
- Percentage of males in architecture and engineering occupations:
Here: 11.1% city: 10.2%
- Percentage of males in education, training, and library occupations:
Here: 2.9% city: 2.8%
- Percentage of males in healthcare practitioners and technical occupations:
Here: 1.8% city: 2.0%
- Percentage of males in service occupations:
Here: 11.9% city: 12.7%
- Percentage of males in sales and office occupations:
Here: 11.4% city: 12.8%
- Percentage of males in construction, extraction, and maintenance occupations:
Here: 13.2% city: 7.8%
- Percentage of males in material moving occupations:
Here: 6.4% city: 3.1%
Occupations of females:
- Percentage of females in management occupations (except farmers):
Here: 5.5% city: 11.0%
- Percentage of females in business and financial operations occupations:
Here: 15.2% city: 8.6%
- Percentage of females in computer and mathematical occupations:
Here: 10.9% city: 5.4%
- Percentage of females in architecture and engineering occupations:
Here: 2.3% city: 2.8%
- Percentage of females in education, training, and library occupations:
Here: 16.8% city: 8.1%
- Percentage of females in healthcare practitioners and technical occupations:
Here: 3.8% city: 6.8%
- Percentage of females in service occupations:
Here: 23.5% city: 21.7%
- Percentage of females in sales and office occupations:
Here: 16.3% city: 22.0%
- Percentage of females in production occupations:
Here: 5.6% city: 4.0%
Percentage of people 16-64 in Armed Forces:
| Burning Tree: | 0.0% |
| San Jose: | 0.0% |
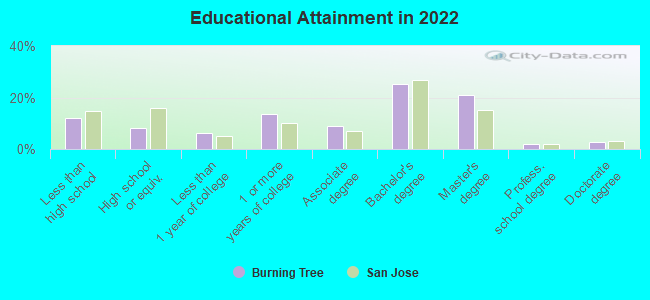
Education in this neighborhood (subdivision or community):
- Percentage of people 3 years and older in K-12 schools:
Burning Tree: 25.0% San Jose: 16.1%
- Percentage of people 3 years and older in undergraduate colleges:
Burning Tree: 2.4% San Jose: 6.5%
- Percentage of people 3 years and older in grad. or professional schools:
Burning Tree: 1.5% San Jose: 2.0%
- Percentage of students K-12 enrolled in private schools:
Burning Tree: 18.5% San Jose: 14.9%
Percentage of population below poverty level:
| Burning Tree: | 11.5% |
| San Jose: | 9.0% |
Median year owner moved in (as recorded in 2022):
| Burning Tree: | 2001 |
| San Jose: | 2008 |
Percentage of married-couple families with both working:
| Burning Tree: | 68.7% |
| San Jose: | 72.5% |
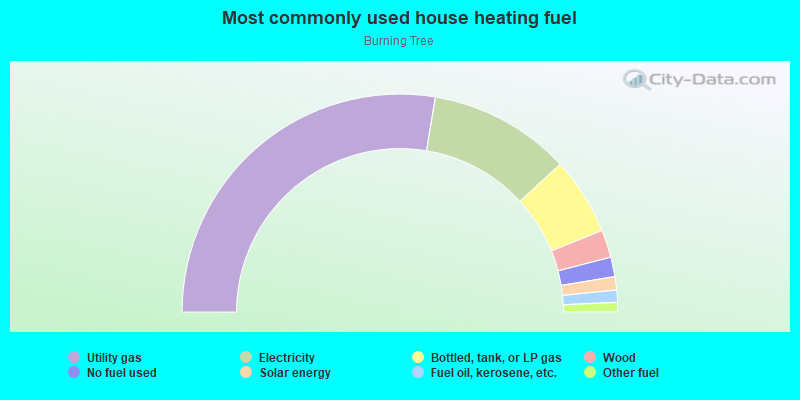
- 55.2%Utility gas
- 21.1%Electricity
- 11.5%Bottled, tank, or LP gas
- 4.1%Wood
- 2.9%No fuel used
- 2.0%Solar energy
- 1.8%Fuel oil, kerosene, etc.
- 1.4%Other fuel
Roads and streets:
Bernal Rd
Length: 0.61 miles
Direction: SW-NE
Address range: 200 to 317
Direction: SW-NE
Address range: 200 to 317
Burning Tree Dr
Length: 0.56 miles
Directions: E-W, N-S, SE-NW, SW-NE
Address range: 100 to 267
Directions: E-W, N-S, SE-NW, SW-NE
Address range: 100 to 267
Polvadero Dr
Length: 0.22 miles
Directions: E-W, N-S, SE-NW, SW-NE
Address range: 6900 to 7099
Directions: E-W, N-S, SE-NW, SW-NE
Address range: 6900 to 7099
Bolado Dr
Length: 0.22 miles
Directions: E-W, SE-NW, SW-NE
Address range: 6900 to 7099
Directions: E-W, SE-NW, SW-NE
Address range: 6900 to 7099
del Rio Dr
Length: 0.21 miles
Directions: E-W, N-S, SE-NW, SW-NE
Address range: 6926 to 7099
Directions: E-W, N-S, SE-NW, SW-NE
Address range: 6926 to 7099
Burning Tree Ct
Length: 0.12 miles
Direction: SE-NW
Address range: 6900 to 6999
Direction: SE-NW
Address range: 6900 to 6999
Santa Teresa Blvd
Length: 0.11 miles
Direction: SE-NW
Address range: 6976 to 6999
Direction: SE-NW
Address range: 6976 to 6999
New River Dr
Length: 0.10 miles
Directions: N-S, SW-NE
Address range: 100 to 299
Directions: N-S, SW-NE
Address range: 100 to 299