Burlingame Gate (Burlingame Grove) neighborhood in Burlingame, California (CA), 94010 detailed profile
Settings
X

Business Search - 14 Million verified businesses
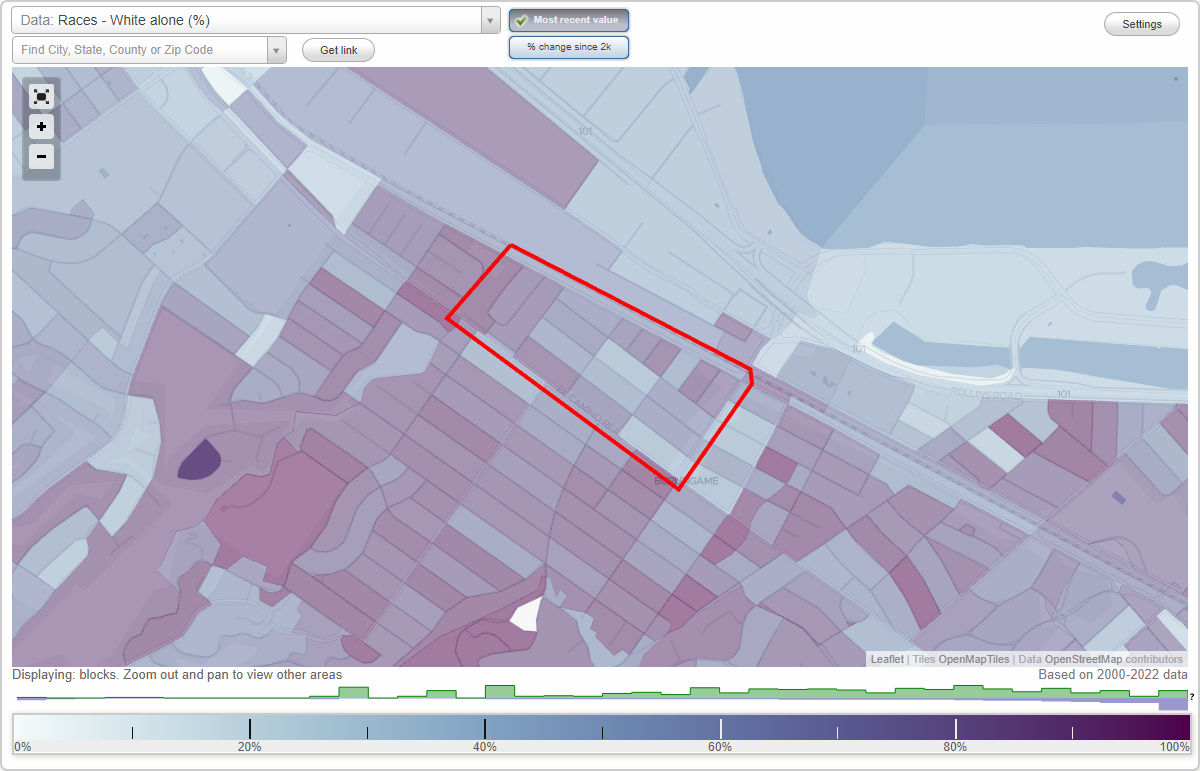
Area: 0.185 square miles
Population: 894
Population density:
| Burlingame Gate (Burlingame Grove): | 4,838 people per square mile |
| Burlingame: | 7,151 people per square mile |

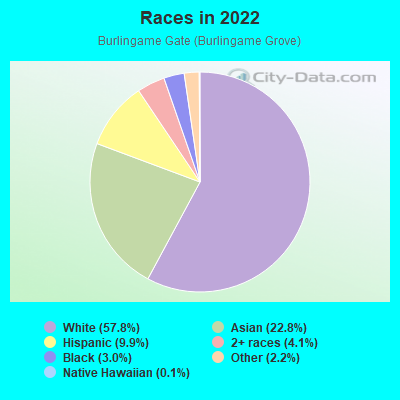
- 51757.8%White
- 20422.8%Asian
- 899.9%Hispanic or Latino
- 374.1%Two or more races
- 273.0%Black
- 202.2%Some other race
- 10.1%Native Hawaiian and Other
Pacific Islander
Median household income in 2022:
| Burlingame Gate (Burlingame Grove): | $165,474 |
| Burlingame: | $165,940 |
Distribution of median household income
![Distribution of median household income]()
- 19Less than $10,000
- 66$10,000 to $19,999
- 27$20,000 to $29,999
- 10$30,000 to $39,999
- 22$40,000 to $49,999
- 7$50,000 to $59,999
- 24$60,000 to $74,999
- 18$75,000 to $99,999
- 28$100,000 to $124,999
- 25$125,000 to $149,999
- 47$150,000 to $199,999
- 132$200,000 or more

Distribution of owner-occupied house/condo value
![Distribution of owner-occupied house/condo value]()
- 20Less than $50,000
- 3$100,000 to $149,999
- 14$200,000 to $249,999
- 18$300,000 to $399,999
- 21$400,000 to $499,999
- 12$500,000 to $749,999
- 5$750,000 to $999,999
- 293$1,000,000 or more

Distribution of rent paid by renters
![Distribution of rent paid by renters]()
- 3$100 to $199
- 68$300 to $399
- 38$1,000 to $1,249
- 5$1,250 to $1,499
- 24$1,500 to $1,999
- 80$2,000 or more

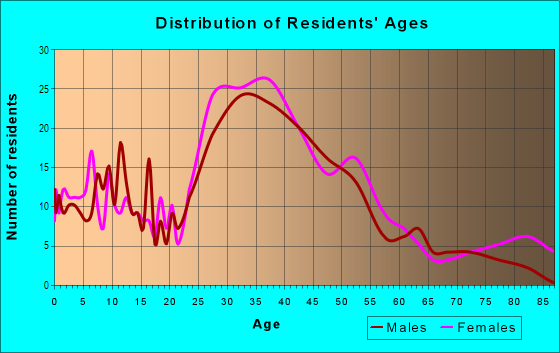
| Males: | 443 |
| Females: | 451 |
Males:
| This neighborhood: | 42.0 years |
| Whole city: | 39.7 years |
| This neighborhood: | 41.7 years |
| Whole city: | 41.7 years |
Average household size:
| Burlingame Gate (Burlingame Grove): | 10.1 people |
| Burlingame: | 2.5 people |
Percentage of family households:
| Burlingame Gate (Burlingame Grove): | 52.1% |
| Burlingame: | 45.6% |
| Here: | 60.6% |
| Burlingame: | 51.2% |
Percentage of married-couple families with children (among all households):
| Burlingame Gate (Burlingame Grove): | 33.4% |
| Burlingame: | 34.1% |
Percentage of single-mother households (among all households):
| Burlingame Gate (Burlingame Grove): | 2.7% |
| Burlingame: | 3.6% |
Percentage of never married males 15 years old and over:
Percentage of never married females 15 years old and over:
| Burlingame Gate (Burlingame Grove): | 14.6% |
| Burlingame: | 18.3% |
Percentage of never married females 15 years old and over:
| Burlingame Gate (Burlingame Grove): | 12.6% |
| city: | 13.4% |
Percentage of people that speak English not well or not at all:
| Burlingame Gate (Burlingame Grove): | 1.7% |
| Burlingame: | 4.7% |
Percentage of people born in this state:
Percentage of people born in another U.S. state:
Percentage of native residents but born outside the U.S.:
Percentage of foreign born residents:
| Here: | 54.5% |
| Burlingame: | 52.5% |
Percentage of people born in another U.S. state:
| Burlingame Gate (Burlingame Grove): | 15.2% |
| Burlingame: | 16.0% |
Percentage of native residents but born outside the U.S.:
| Here: | 2.3% |
| city: | 1.6% |
Percentage of foreign born residents:
| Here: | 28.0% |
| Burlingame: | 30.0% |
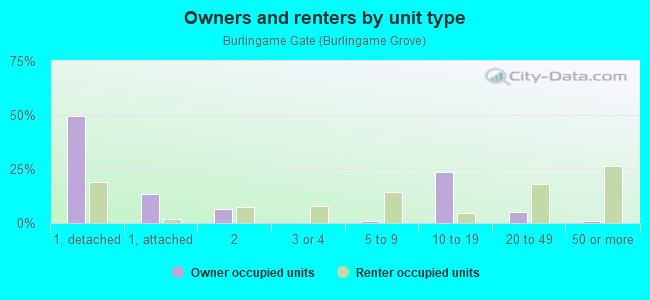
Owner-occupied
Renter-occupied

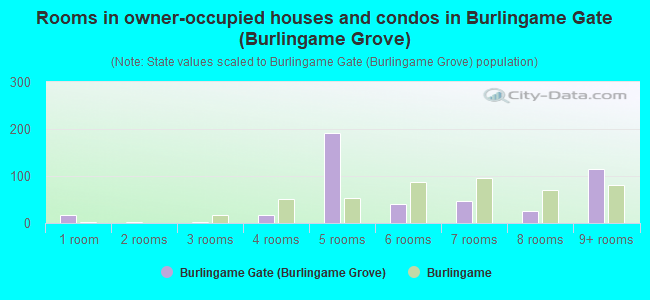
- Rooms in owner-occupied houses and condos in Burlingame Gate <
> - 181 room
- 22 rooms
- 23 rooms
- 174 rooms
- 1925 rooms
- 406 rooms
- 467 rooms
- 268 rooms
- 1149+ rooms
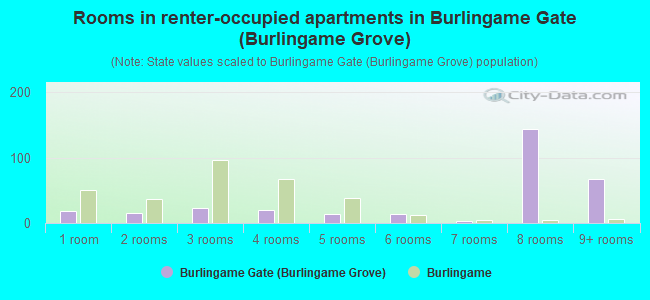
- Rooms in renter-occupied apartments in Burlingame Gate <
> - 181 room
- 162 rooms
- 233 rooms
- 204 rooms
- 145 rooms
- 146 rooms
- 37 rooms
- 1448 rooms
- 679+ rooms
Owner-occupied
Renter-occupied
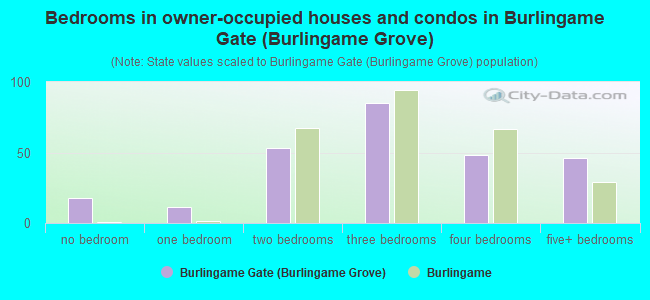
- Bedrooms in owner-occupied houses and condos in Burlingame Gate <
> - 18no bedroom
- 111 bedroom
- 532 bedrooms
- 853 bedrooms
- 484 bedrooms
- 465+ bedrooms
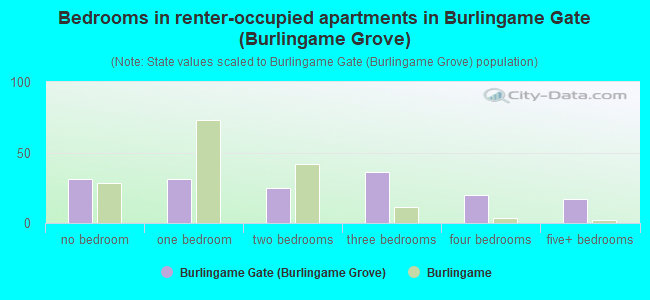
- Bedrooms in renter-occupied apartments in Burlingame Gate <
> - 31no bedroom
- 311 bedroom
- 252 bedrooms
- 363 bedrooms
- 204 bedrooms
- 175+ bedrooms
Average number of cars or other vehicles available in houses/condos:
Average number of cars or other vehicles available in apartments:
| This neighborhood: | 2.2 |
| Burlingame: | 2.2 |
Average number of cars or other vehicles available in apartments:
| Here: | 1.4 |
| city: | 1.4 |
Percentage of units with a mortgage:
| Burlingame Gate (Burlingame Grove): | 73.4% |
| Burlingame: | 71.7% |
Average estimated value of detached houses in 2022 (67.5% of all units):
| Burlingame Gate (Burlingame Grove): | $2,344,367 |
| California: | $988,808 |
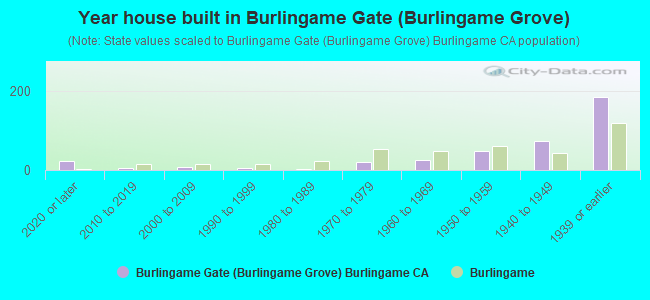
- Year house built in Burlingame Gate <
> - 222020 or later
- 42010 to 2019
- 82000 to 2009
- 51990 to 1999
- 31980 to 1989
- 211970 to 1979
- 251960 to 1969
- 491950 to 1959
- 741940 to 1949
- 1841939 or earlier
City-data.com crime index for city in 2020 (higher means more crime):
| City: | 236.7 |
| U.S. average: | 219.5 |
Travel time to work (commute)
![Travel time to work (commute)]()
- 7Less than 5 minutes
- 185 to 9 minutes
- 2210 to 14 minutes
- 2915 to 19 minutes
- 3320 to 24 minutes
- 1525 to 29 minutes
- 3430 to 34 minutes
- 435 to 39 minutes
- 940 to 44 minutes
- 3245 to 59 minutes
- 3660 to 89 minutes
- 490 or more minutes

Means of transportation to work
![Means of transportation to work]()
- 55.6%252Drove a car alone
- 5.1%23Carpooled
- 11.7%53Bus
- 10.4%47Subway or elevated rail
- 2.2%10Long-distance train or commuter rail
- 5.5%25Light rail, streetcar or trolley
- 9.7%44Taxi
- 19.9%90Motorcycle
- 0.2%1Bicycle
- 0.9%4Walked
- 1.3%6Other means
- 19.0%86Worked at home

Time leaving home to go to work
![Time leaving home to go to work]()
- 612:00 a.m. to 4:59 a.m.
- 115:00 a.m. to 5:29 a.m.
- 95:30 a.m. to 5:59 a.m.
- 206:00 a.m. to 6:29 a.m.
- 206:30 a.m. to 6:59 a.m.
- 197:00 a.m. to 7:29 a.m.
- 287:30 a.m. to 7:59 a.m.
- 248:00 a.m. to 8:29 a.m.
- 288:30 a.m. to 8:59 a.m.
- 319:00 a.m. to 9:59 a.m.
- 1010:00 a.m. to 10:59 a.m.
- 2511:00 a.m. to 11:59 a.m.
- 1912:00 p.m. to 3:59 p.m.
- 54:00 p.m. to 11:59 p.m.

Occupations of males:
- Percentage of males in management occupations (except farmers):
Here: 32.8% city: 21.1%
- Percentage of males in business and financial operations occupations:
Here: 15.1% city: 8.6%
- Percentage of males in computer and mathematical occupations:
Here: 8.4% city: 7.1%
- Percentage of males in architecture and engineering occupations:
Here: 8.2% city: 4.9%
- Percentage of males in life, physical, and social science occupations:
Here: 2.6% city: 3.3%
- Percentage of males in community and social services occupations:
Here: 1.8% city: 1.3%
- Percentage of males in legal occupations:
Here: 2.1% city: 3.3%
- Percentage of males in education, training, and library occupations:
Here: 4.9% city: 3.4%
- Percentage of males in service occupations:
Here: 10.5% city: 12.7%
- Percentage of males in sales and office occupations:
Here: 8.6% city: 12.6%
- Percentage of males in production occupations:
Here: 1.9% city: 1.8%
- Percentage of males in transportation occupations:
Here: 2.1% city: 3.9%
Occupations of females:
- Percentage of females in management occupations (except farmers):
Here: 19.5% city: 20.8%
- Percentage of females in business and financial operations occupations:
Here: 5.6% city: 10.1%
- Percentage of females in computer and mathematical occupations:
Here: 4.0% city: 4.3%
- Percentage of females in life, physical, and social science occupations:
Here: 3.1% city: 4.3%
- Percentage of females in community and social services occupations:
Here: 3.6% city: 1.0%
- Percentage of females in legal occupations:
Here: 3.7% city: 3.4%
- Percentage of females in education, training, and library occupations:
Here: 8.2% city: 7.2%
- Percentage of females in arts, design, entertainment, sports, and media occupations:
Here: 2.2% city: 2.1%
- Percentage of females in healthcare practitioners and technical occupations:
Here: 9.5% city: 10.3%
- Percentage of females in service occupations:
Here: 9.2% city: 11.2%
- Percentage of females in sales and office occupations:
Here: 26.9% city: 19.2%
- Percentage of females in production occupations:
Here: 1.4% city: 1.0%
- Percentage of females in transportation occupations:
Here: 1.2% city: 1.8%
- Percentage of females in material moving occupations:
Here: 2.0% city: 0.9%
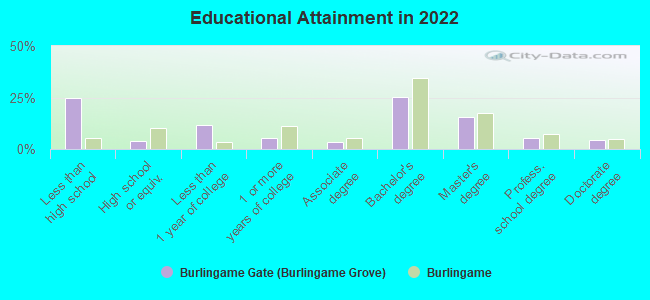
Education in this neighborhood (subdivision or community):
- Percentage of people 3 years and older in K-12 schools:
Burlingame Gate (Burlingame Grove): 54.4% Burlingame: 17.3%
- Percentage of people 3 years and older in undergraduate colleges:
Burlingame Gate (Burlingame Grove): 2.3% Burlingame: 4.6%
- Percentage of people 3 years and older in grad. or professional schools:
Burlingame Gate (Burlingame Grove): 3.3% Burlingame: 1.3%
- Percentage of students K-12 enrolled in private schools:
Burlingame Gate (Burlingame Grove): 57.0% Burlingame: 20.4%
Percentage of population below poverty level:
| Burlingame Gate (Burlingame Grove): | 5.0% |
| Burlingame: | 5.0% |
Median year owner moved in (as recorded in 2022):
| Burlingame Gate (Burlingame Grove): | 2003 |
| Burlingame: | 2002 |
Percentage of married-couple families with both working:
| Burlingame Gate (Burlingame Grove): | 82.5% |
| Burlingame: | 75.6% |
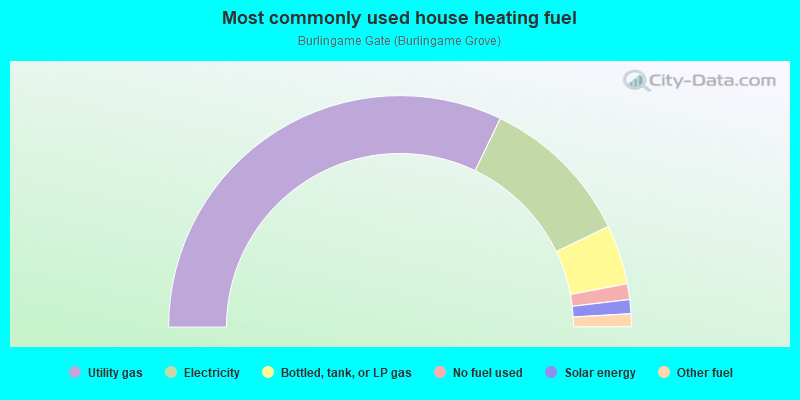
- 64.3%Utility gas
- 21.4%Electricity
- 8.3%Bottled, tank, or LP gas
- 2.2%No fuel used
- 2.0%Solar energy
- 1.8%Other fuel
Highways in this neighborhood:
el Camino Real (Mission St, State Hwy 82)
Length: 0.75 miles
Direction: SE-NW
Address range: 1277 to 1461
Direction: SE-NW
Address range: 1277 to 1461
Roads and streets:
California Dr
Length: 0.70 miles
Direction: SE-NW
Address range: 1200 to 1513
Direction: SE-NW
Address range: 1200 to 1513
Capuchino Ave
Length: 0.56 miles
Direction: SE-NW
Address range: 1200 to 1499
Direction: SE-NW
Address range: 1200 to 1499
Paloma Ave
Length: 0.55 miles
Direction: SE-NW
Address range: 1200 to 1499
Direction: SE-NW
Address range: 1200 to 1499
Laguna Ave
Length: 0.55 miles
Direction: SE-NW
Address range: 1200 to 1499
Direction: SE-NW
Address range: 1200 to 1499
Broadway
Length: 0.33 miles
Directions: N-S, SW-NE
Address range: 1090 to 1499
Directions: N-S, SW-NE
Address range: 1090 to 1499
Lincoln Ave
Length: 0.28 miles
Direction: SW-NE
Address range: 1100 to 1499
Direction: SW-NE
Address range: 1100 to 1499
Grove Ave
Length: 0.25 miles
Direction: SW-NE
Address range: 1100 to 1499
Direction: SW-NE
Address range: 1100 to 1499
Mills Ave
Length: 0.22 miles
Direction: SW-NE
Address range: 1100 to 1499
Direction: SW-NE
Address range: 1100 to 1499
Cambridge Rd
Length: 0.20 miles
Directions: E-W, SE-NW, SW-NE
Address range: 1100 to 1199
Directions: E-W, SE-NW, SW-NE
Address range: 1100 to 1199
Oxford Rd
Length: 0.19 miles
Directions: N-S, SE-NW, SW-NE
Address range: 1100 to 1199
Directions: N-S, SE-NW, SW-NE
Address range: 1100 to 1199
Highway Rd
Length: 0.15 miles
Directions: E-W, SE-NW
Address range: 1400 to 1599
Directions: E-W, SE-NW
Address range: 1400 to 1599
Rhinette Ave
Length: 0.11 miles
Direction: SW-NE
Address range: 1100 to 1199
Direction: SW-NE
Address range: 1100 to 1199
Juanita Ave
Length: 0.10 miles
Direction: SW-NE
Address range: 1100 to 1199
Direction: SW-NE
Address range: 1100 to 1199
Summer Ave
Length: 0.08 miles
Direction: SW-NE
Address range: 1100 to 1199
Direction: SW-NE
Address range: 1100 to 1199
Marquita Ave
Length: 0.07 miles
Direction: SW-NE
Address range: 1100 to 1199
Direction: SW-NE
Address range: 1100 to 1199
Railroad features:
Union Pacific RR
Length: 0.34 miles
Direction: SE-NW
Direction: SE-NW
Freight
Length: 0.25 miles
Directions: E-W, SE-NW
Directions: E-W, SE-NW
Caltrain
Length: 0.11 miles
Direction: E-W
Direction: E-W